Forecast for Q1'16 - levels for GOLD (XAU/USD)
Forum on trading, automated trading systems and testing trading strategies
Sergey Golubev, 2016.01.01 20:05
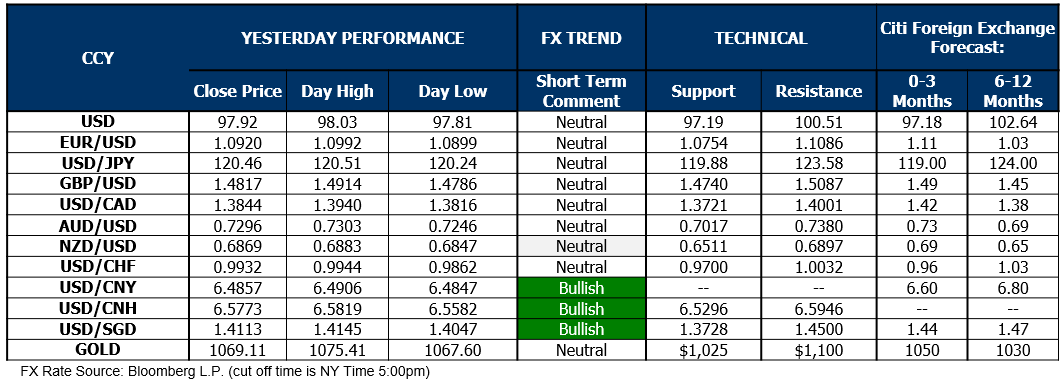
6 month forecast by Citi group for US Dollar, Forex and Gold (based on the article)
Forum on trading, automated trading systems and testing trading strategies
Sergey Golubev, 2016.01.03 12:59
Gold Price Forecast Q1 2016 (based on the article)
- "Gold prices continue to exhibit a strong relationship with Fed policy bets. Indeed, the projected 2016 policy path implied in Fed Funds futures shows an impressive -0.92 inverse correlation with spot prices for the yellow metal (on rolling 60-day studies, see chart). Needless to say, this is not surprising considering gold’s familiar appeal as an alternative store of value and go-to anti-fiat asset. If markets begin to consider the possibility that stimulus withdrawal might proceed closer in line with FOMC projections versus standing market expectations, gold prices are likely to face a swell in selling pressure."
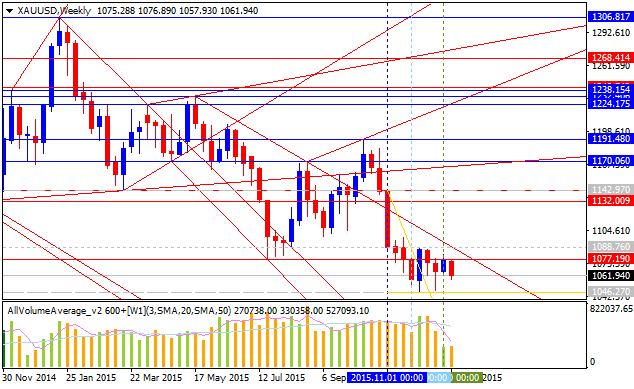
- "Back in September we warned of
the risk for a near-term correction higher to test the 52-week moving
average and indeed the following weeks saw gold prices probe & fail
to break above this threshold before turning over sharply. The
subsequent decline is now testing a key support zone heading into the
close of the year at 1044/53. This region is defined by the 61.8%
extension off the 2012 high, the 2010 low and basic parallel support
extending off the 2014 lows."
Bottom line: 'we’ll be looking
for a push higher in early 1Q for more favorable short entries with a
break of the low targeting support objectives 1005, the sliding parallel
extending off the 2013 low and confluence Fibonacci support at 975/80.'
Forum on trading, automated trading systems and testing trading strategies
Sergey Golubev, 2016.01.09 14:05
Week Ahead: what we’re watching - the Fed is on the verge of changing its outlook (based on the article)
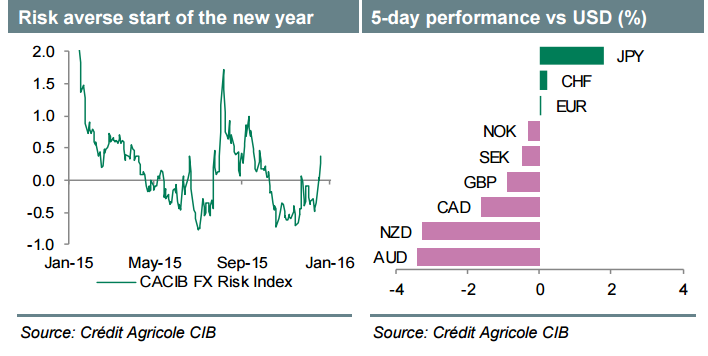
- USD: "threats to the divergence trade? - Risk aversion can still challenge the Fed’s outlook. Solid US retail sales needed next week to limit any risk aversion-driven USD underperformance against JPY, EUR and CHF."
- GBP: "enough pounding? - Improving UK data and the largely unchanged BoE outlook could offset Brexit fears to a degree and support GBP."
- AUD: "remain cautious - AUD latest underperformance could continue next week in view of Australian and Chinese data releases."
- NOK & SEK: "ahead of CPI - CPI data out of Sweden and Norway may matter less in the face of low oil prices and Riksbank’s FX intervention threat."
- XAU: "Gold shines - Gold has been the best performing asset in our universe since the start of 2016 as risk aversion burnished its safe haven appeal."
GOLD (XAU/USD) Price Action Analysis - ranging near bullish reversal
Daily price is located below 200 period SMA (200 SMA) and near below 100 period SMA (100 SMA) for the primary bearish market condition on the border between the primary bearish and the ranging bearish trend:
- Fibo resistance level at 1113.12 is going to be broken by the price from below to above for the ranging condition to be started for the price which will be located between 100 SMA/200 SMA in this case;
- ascending triangle pattern was formed by the price for the breakout to be started with the possible reversal of the price movement to the primary bullish condition;
- RSI indicator is estimating the ranging bullish market condition to be started in the near future for example.
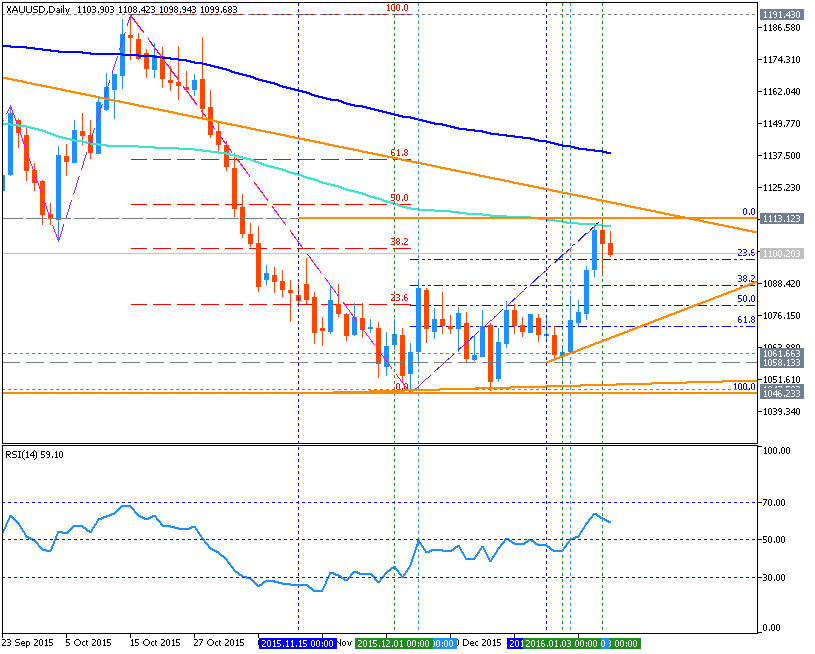
If the price will break Fibo resistance level at 1113.12 so we may see the ranging condition to be started with the good possibility to the bullish reversal in the near future.
If the price will break Fibo support level at 1046.23 from above to below so the primary bearish trend will be continuing.
If not so the price will be ranging within the levels.
| Resistance | Support |
|---|---|
| 1113.12 | 1046.23 |
| N/A | N/A |
- Recommendation to go short: watch the price to break 1046.23 support level for possible sell trade
- Recommendation to go long: watch the price to break 1113.12 resistance level for possible buy trade
- Trading Summary: ranging
Forum on trading, automated trading systems and testing trading strategies
Sergey Golubev, 2016.01.13 12:27
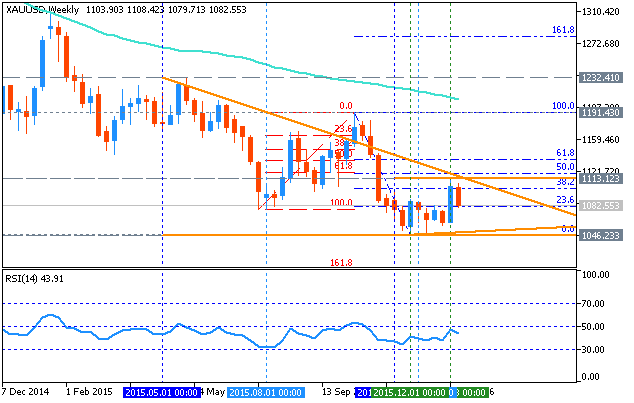
Weekly bearish ranging below 50.0% Fibo resistance level (adapted from the article)
Weekly price is located below 200 period SMA and 100 period SMA for the primary bearish market condition:
- The price is on bearish ranging within 50.0% Fibo resistance level at 1119.33 and Fibo support level at 1046.23.
- Descending triangle pattern was formed by the price to be crossed for the bearish trend to be continuing.
- "After bursting up to a new higher-high of $1,113.03 after NFP last Friday, prices have been pulling back. That pullback may have just found support at that same level of prior resistance, and when a level is relevant in a market this will often happen. This is a simple, but often effective price action tell, and traders can look at this as a chance to play the top-side of Gold with a risk-defined play."
- "Traders can look to play the continued reversal in Gold by
lodging stops below support; the distance of which should be
determined by how aggressively you want to treat the move. The more
aggressive setup would be placing a stop below today’s low at
$1,083.32. Slightly more conservative would be taking that stop below
the nearest psychological level at $1,080. And even more conservative
than that would be placing the stop below the prior July 2015 low at
$1,071.28. On the top-side, that previous high at $1,113 becomes a level of interest, especially for aggressive stops."
| Resistance | Support |
|---|---|
| 1119.33 | 1046.23 |
| 1191.26 | N/A |
If the price will break Fibo support level at 1046.23 so the primary bearish trend will be continuing.
If the price will break 50.0% Fibo resistance level at 1119.33 from below to above so the local uptrend as the bear market rally will be started.
If the price will break Fibo resistance level at 1191.26 from below to above so the reversal of the price movement from the primary bearish to the primary bullish trend will be started.
If not so the price will be ranging within the levels.
- Recommendation for long: watch close W1 price to break 1119.33 for possible buy trade with 1191.26 target to re-enter
- Recommendation
to go short: watch W1 price to break 1046.23 support level for possible sell trade
- Trading Summary: ranging
W1 - ranging bearish
Forum on trading, automated trading systems and testing trading strategies
Sergey Golubev, 2016.01.15 14:36
AUDIO - Gas, Oil and Gold… Oh My! (based on the article)
Solo on the show, Merlin welcomes a small live studio audience, who asks questions pertaining to the decline to oil. Merlin also focuses on listener questions and how to apply risk management techniques to current markets.

Forum on trading, automated trading systems and testing trading strategies
Sergey Golubev, 2016.01.16 09:37
Forex Weekly Outlook January 18-22 (based on the article)The fall in Chinese stock markets and the yuan devaluation intertwined with the crash in oil prices and currencies certainly felt it. AUD, CAD and GBP reached new multi-year lows against the dollar while the latter fell against the safe haven euro and yen. US data was not convincing and the chances of another rate hike coming in March have fallen. Yen and euro crosses have made big moves.
- UK Inflation data: Tuesday, 9:30. The UK’s inflation rate turned positive for the first time in four months, rising 0.1% in November. The main increase occurred in transport costs, alcohol and tobacco prices while clothing prices declined. Analysts expected CPI to remain flat after declining 0.1% in October. Falling oil prices continued to reduce manufacturer’s costs, keeping prices intact while core inflation, excluding food and energy increased to 1.2%. Another 0.1% rise is expected this time.
- Chinese GDP: Tuesday, 2:00. The world’s second largest economy has been the center of attention with the recent weak data, fall in stocks and devaluation of the yuan that expose weakness and an inability to transition from manufacturing and investment to services and consumption. After serving as the engine of growth for the world, especially after the financial crisis, China could be a reason for another crash. GDP is expected to show an annualized growth rate of 6.9% in Q4, exactly like in Q3. And while many doubt the official data, the publication still has an impact. A positive number can boost risk, supporting AUD and also other commodity currencies and the pound, while hurting the euro and yen. All this could be limited. And in case of a weak figure, it’s the other way around. China also publishes industrial output at the same time, and this is expected to stand at 6% y/y after 6.2% beforehand. Fixed Asset Investment carries expectations of 10.2% y/y.
- German ZEW Economic Sentiment: Tuesday, 10:00. Economic Sentiment according to the ZEW report edged up 5.7 points in December reaching 16.1 points. The reading was higher than the estimate of 15.2 points. The current condition index posted 55 rising 0.6% points from the 0.8% fall in November. Although economic sentiment improved in December, it’s still lower than the long-term average of 24.8 points. However, a recent uptick in export orders may provide a breather to the German economy. Economic Sentiment is expected to decline to 8.2 in January.
- NZ Inflation data: Tuesday, 21:45 New Zealand’s inflation was slightly higher than forecasted in the third quarter, rising 0.3% following a 0.4% increase in the June quarter. The main rise occurred in housing prices increasing 1.2%. Analysts expected the third quarter CPI to reach 0.2%. Inflation is predicted to decline by 0.2% in the fourth quarter of 2015.
- UK Employment data: Wednesday, 9:30. The number of people claiming unemployment allowance increased more than expected in November, rising 3,900, while the previous month’s claimant count change was revised down to only 200 people. However, despite the rise, the UK jobless rate declined to 5.2% in the three months to October, down from 5.3%. Wage growth continues to weaken with regular pay slowing to a rise of 2% in the three months to October, down from a revised 2.4% a month before. Total pay, including bonus payments, decelerated to 2.4% from 3%. The number of jobless claims is expected to rise by 4,100 this time.
- US Building Permits: Wednesday, 13:30. Building permits surged 11% in November, reaching 1.29 million-unit rate, the highest level since June. The number of permits is a good indicator for housing starts, indicating the housing market is on a growth trend. Permits for the construction of single-family homes increased 1.1%, the highest level since December 2007. Multi-family building permits soared 26.9%. US building permits is expected to reach 1.2 million in December.
- US Inflation data: Wednesday, 13:30. The weakness in gasoline prices kept CPI flat in November while underlying inflation pressures increased with a 0.2% rise in core Consumer Prices. Core CPI increased for the third month in November. In the 12 months through November, the core CPI edged up 2.0%, the largest gain since May 2014, after rising 1.9% in October. The continuous rise in rents, airline fares, automobiles and medical care indicate rising inflationary pressures. The headline inflation is expected to remain flat again as core inflation is forecasted to rise 0.2% in December.
- Canadian rate decision: Wednesday, 15:00. The Bank of Canada kept its key rate at 0.50% in line with market forecast amid the effects of low oil prices and other pressures. Total inflation remains near the bottom of its one- to three-per-cent target range, due to low energy prices. Furthermore, business investment continues to be weighed down by spending cuts at resource companies. The central bank remains concerned about consumer debt levels. BOC Governor Poloz stated that even as the Fed hikes, Canadian rates would stay steady. The Bank of Canada is expected to cut rates from 0.50% to 0.25% this time.
- Eurozone Rate decision: Thursday, 12:45, press conference at 13:30. In the previous meeting of the ECB, expectations were sky high for more monetary stimulus, and the results fell a bit short. A cut of the deposit rate to -0.30% and an announcement of extending QE to March 2017 + reinvesting proceeds were not enough. EUR/USD shot higher and Draghi made his best effort at damage control. No change is expected this time, but we could get a hint about what the Bank could do in March, when new staff forecasts are published. Draghi and some of colleagues are open to do more, while the hawks, most notably his German colleagues, say they have done more than enough. A promise to do more, as inflation looks weak, could hit the euro, while a relaxed stance, given the improvement in the euro-zone, could lift the common currency.
- US Philly Fed Manufacturing Index: Thursday, 13:30. Manufacturing activity in the Philadelphia area plunged to -5.9 in December, its third negative reading in four months. This unexpected decline followed a 1.9 points reading in the previous month. Analysts expected the index to show 2.1 points. The new orders section remained negative and fell 6 points, to -9.5. However, companies reported higher shipments, as the current shipments index increased 6 points to a reading of 3.7. Furthermore, the 6-month outlook plunged more than 20 points to 23.0. Overall, the report suggests weak global demand. Manufacturing activity in the Philadelphia area is expected to reach -3.1 in January.
- US Unemployment claims: Thursday, 13:30. The number of new jobless claims increased unexpectedly last week, but remained below the 300,000 line. Initial claims for unemployment benefits rose 7,000 to a seasonally adjusted 284,000 worse than the 275,000 forecasted by analysts. However, the rise could be attributed to seasonal volatility rather than a change in labor market conditions. The four-week moving average of claims, rose 3,000 to 278,750 last week and the four-week moving average of continuing claims increased 5,250 to 2.22 million. Jobless claims is expected to reach 281,000 this week.
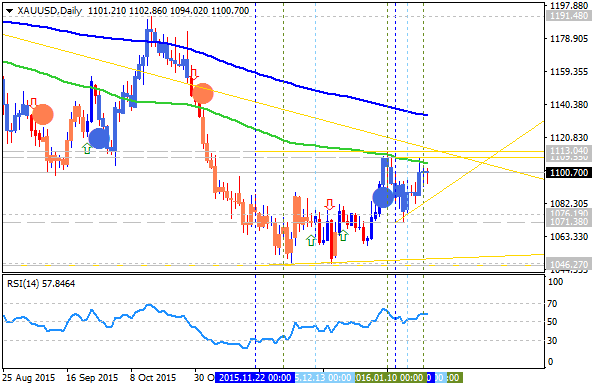
GOLD: End Of Week Technicals - bear market rally to the bullish reversal
Daily price
is on primary bearish market condition located below 100 day SMA (100 SMA) and 200 day SMA (200 SMA) for the local; uptrend as the bear market rally to be started in the beginning of January this year. Symmetric triangle pattern was fomed by the price to be crossed for direction, and RSI indicator is estimating the bear market rally to be continuing with the secondary ranging condition.
If the price breaks 1046.27
support level so the primary bearish will be continuing.
If the price breaks 1113.04 resistance level so the reversal of tjhe price movement from the primary bearish to the primary bullish will be started.
If not so the price will be ranging within the levels.
- Recommendation for long: watch close the price to break 1046.27 for possible buy trade
- Recommendation
to go short: watch the price to break 1046.27 support level for possible sell trade
- Trading Summary: bear market rally
| Resistance | Support |
|---|---|
| 1046.27 | 1071.38 |
| N/A | 1046.27 |
SUMMARY : bearish
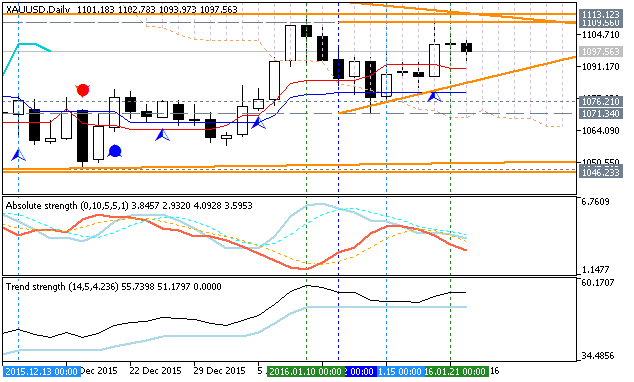
GOLD (XAU/USD) Technical Analysis 2016, 24.01 - 31.01: ranging bearish
Daily price is on primary bearish condition with the secondary ranging located inside Ichimoku cloud and below Senkou Span line which is the virtual border between the primary bearish and the primary bullish trend on the chart.
The price is ranging within the following key reversal s/r levels:
- 1113.12 key resistance level located in the beginning of the bullish trend on the daily chart, and
- 1071.34 key support level located on the border between the ranging bearish and the primary bearish trend.
If D1 price will break 1071.34
support level on close bar so the primary bearish trend will be continuing without secondary ranging and with 1046.23 level as the bearish target.
If D1 price will break 1113.12
resistance level on close bar so the reversal of the price movement to the primary bullish market condition will be started.
If not so the price will be on ranging within the levels.
- Recommendation for long: watch close D1 price to break 1113.12 for possible buy trade
- Recommendation
to go short: watch D1 price to break 1071.34 support level for possible sell trade
- Trading Summary: correction to bearish reversal
| Resistance | Support |
|---|---|
| 1113.12 | 1071.34 |
| N/A | 1046.23 |

SUMMARY : ranging bearish
Forum on trading, automated trading systems and testing trading strategies
Sergey Golubev, 2016.01.30 09:20
Forex Weekly Outlook February 1-5 (based on the article)
US ISM Manufacturing PMI, rate decision in Australia and the UK, Employment data from New Zealand, Canada and the US, including the all-important NFP release, Mark Carney speaks in London and Trade balance in Canada and the US. These are the main highlights for this week. Here is an outlook on these important events.
- US ISM Manufacturing PMI: Monday, 15:00. The manufacturing PMI continued its contraction in December after a disappointing reading of 48.6 in the previous month. This was the lowest reading since July 2009 with declines across the board. The New Orders Index increased 0.3 points reaching 49.2. The Production Index registered 49.8% from 49.2% in November. The Employment Index declined 3.2 to 48.1. The manufacturing PMI is expected to remain at 48.6 this time.
- Australian rate decision: Tuesday, 3:30. The Reserve Bank of Australia maintained the official cash rate at 2.0% on its December meeting. Governor Glenn Stevens noted a certain improvement in economic conditions, but the outlook for may require further monetary easing. Stevens said he is willing to cut rates if economic data worsens.
- NZ Employment data: Tuesday, 21:44. New Zealand employment market unexpectedly contracted for the first time in three years in the third quarter, mainly due to a decline in part-time workers. Employment fell 0.4% after rising 0.3% in the previous quarter. Economists expected employment to grow 0.4% in the third quarter. Furthermore, the unemployment rate increased to 6% from 5.9 in the second quarter. Economists expect New Zealand’s labor market to expand by 0.8% while the unemp[loyment is predicted to rise to 6.1%.
- US ADP Non-Farm Employment Change: Wednesday, 13:15. US private sector employment expanded by 257,000 jobs in December according to the ADP report. The reading pointed to underlying strength in the economy and followed a 211,000 gain in the previous month. Labor market strength suggests the economy’s condition remains solid, and may prompt the Federal Reserve to raise interest rates again in March. US private sector is expected to gain 191,000 in January.
- US ISM Non-Manufacturing PMI: Wednesday, 15:00. US service sector expanded less than expected in December with the slowest growth pace in almost two years. The index declined to 55.3 from 55.9 in November, missing market forecast for a reading of 56.0. The New Orders Index posted 58.2, rising 0.7 points; the Employment Index increased 0.7 points to 55.7, while the Prices Index declined 0.6 points from November. However the majority of respondents’ comments remain positive about business conditions and the overall economy. US service sector activity is expected to decline to 55.2.
- UK Rate decision: Thursday, 12:00. The Bank of England maintained interest rates in January amid volatility in global markets and a continuous fall in oil prices slowing inflation even further. Only Ian McCafferty voted for a rise to 0.75%. MPC members believed “the outlook remained unchanged from the previous economic forecasts in November. But the minutes also noted the volatility on financial markets, and in share prices in particular. Furthermore, the MPC highlighted a 40% fall in the oil price which would badly affect inflation growth.
- Mark Carney speaks: Thursday, 12:00. BOE Governor Mark Carney will speak about the Inflation Report, in London. Carney said at a speech in London that the Bank of England should not begin raising interest rates in the coming months, stating the weak condition of the global economy and the slowed growth in the UK. He also said that the MPC will watch for signs of renewed downturn in inflationary pressures before offering another round of monetary easing.
- US Unemployment Claims: Thursday, 13:30. The number of new US claims for unemployment benefits declined last week from a six-month high of 294,000 to 278,000, reaffirming the strength of the US labor market. Economists forecasted a drop to 282,000 in the latest week. The four-week moving average is now 23,750 above its post-recession low of 259.250 from last October. The number of new claims is expected to be 286,000 this week.
- Canadian Employment data: Friday, 13:30. The Canadian labor market expanded unexpectedly in December adding 22,800 jobs, amid a large gain in part-time work. The number of full-time employment actually declined in December by 6,400 while the economy added 29,200 part-time jobs. Meanwhile, the unemployment rate remained unchanged at 7.1%. The overall picture is less appealing; indicating hiring in the private sector is weak. The 2015 employment growth rate was slightly stronger than in 2014 and 2013, when the overall number of jobs expanded by just 0.7% in each of those years.
- US Non-Farm Employment Change and Unemployment rate: Friday, 13:30. U.S. payrolls surged in December by 292,000 following 252,000 in the previous month. Hiring got a boost from unseasonably warm weather and the unemployment rate remained unchanged at a 7-1/2-year low of 5%. The firm employment data indicates the economy sustains growth while the recent weakness could be attributed to the manufacturing and export-oriented sectors. U.S. payrolls for October and November were revised up to show 50,000 more jobs created than previously reported, adding to the report’s upbeat tone. US private sector is expected to expand by 192,000 in January, while the unemployment rate is estimated to remain at 5%.
- US Trade Balance: Friday, 13:30. US trade deficit contracted in November to a nine-month low of $42.4 billion as a sharp decline in imports outweighed a decline in exports. However, the overall picture shows both exports and imports are now falling due to the dollar’s strength and the weakness in global economy. Exports fell 0.9% to US$182.2 billion, more than a four-year low. US trade deficit is predicted to inch up to $42.8 billion in December.
- Free trading apps
- Over 8,000 signals for copying
- Economic news for exploring financial markets
You agree to website policy and terms of use
Daily price is on bearish market condition to be located below 100 period SMA (100 SMA) and 200 period SMA (200 SMA). The price is ranging within the following key reversal support/resistance levels:
The bullish reversal level is 1142.94, and if the price breaks this level to above so the bullish reversal will be started on daily price. By the way, the RSI indicator is estimating the ranging trend to be continuing so the more likely scenario for daily gold price is the ranging bearish for Q1 for example.
Weekly price is on bearish market condition to be below 100 period SMA (100 SMA) and 200 period SMA (200 SMA). The price was bounced from 1046.23 support level to start with the secondary ranging within the following s/r levels::
The key reversal resistance level for weekly price is 1232.41, and if the price breaks this level to above on close weekly bar so the reversal to the primary bullish condition will be started with the secondary ranging: the price will be located within 100 SMA/200 SMA. Descending triangle pattern was formed by the price to the crossed for the bearish trend to be continuing, and RSI indicator is estimating the ranging bearish condition in the future.
Monthly price is on ranging condition located to be between 100 SMA and 200 SMA within the following key support/resistance levels:
Descending triangle pattern was formed by the price to be crossed for the bearish trend to be continuing, and RSI indicator is estimating the bearish trend as well in the future for this pair.