Forecast and levels for Cryptocurrencies
Bitcoin vs USD January-March 2017
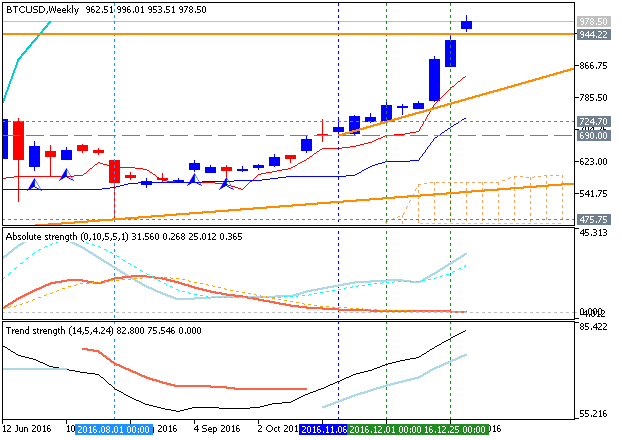
Forecast: key resistance level at 850.15 to be broken for the bullish trend to be continuing
Weekly (W1) price is located above Ichimoku cloud in the bullish area of the chart. The price is on ranging within the following support/resistance levels:
- 850.15 resistance level located far above Ichimoku cloud in the beginning of the bullish trend to be resumed, and
- 745.00 support level located in the beginning of the secondary correction to be started.
Chinkou Span line is located above the price indicating the ranging condition to be continuing in the near future for example.
- If the price breaks 850.15
resistance level on close weekly bar to above so the primary bullish trend will be resumed.
- If weekly price breaks 745.00 support level on close bar to below so the secondary correction within the primary bullish trend will be started.
- If weekly price breaks 475.75 support level on close bar to below so we may see the bearish reversal to be started.
- If not so the price will be on bullish ranging within the levels.
| Resistance | Support |
|---|---|
| 850.15 | 745.00 |
| N/A | 475.75 |
Trend:
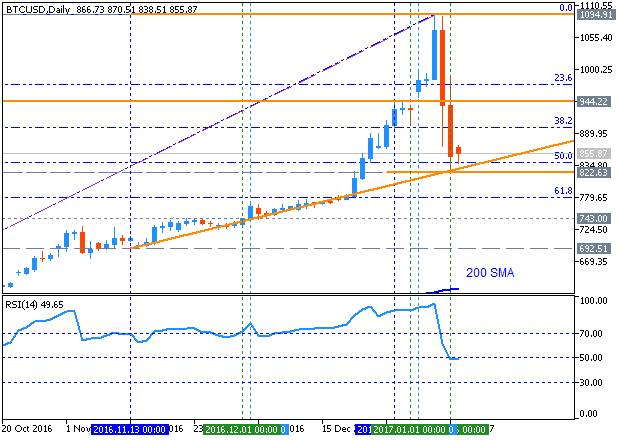
Weekly price broke 850.15 resistance level to above together with 944.22 new level. So, it is bullish breakout!
Forum on trading, automated trading systems and testing trading strategies
Sergey Golubev, 2017.01.09 12:32
Bitcoin/USD: Intra-day breakdown with the bearish reversal; daily correction to be started (adapted from the article)
- "BTCUSD has been selling off after testing record highs recently due to profit-taking and as a reaction to Chinese government action. Last week, monetary authorities in the mainland warned consumers and exchanges about bitcoin trading and investment, emphasizing that it is not currency and shouldn’t be treated as such."
- "Bitcoin firms were prompted to cancel marketing events that promote the anonymity of BTCUSD trading as authorities reiterated the need to implement KYC and AML checks on trading. With that, investors continued liquidating their long positions and might continue to do so in the next few days."
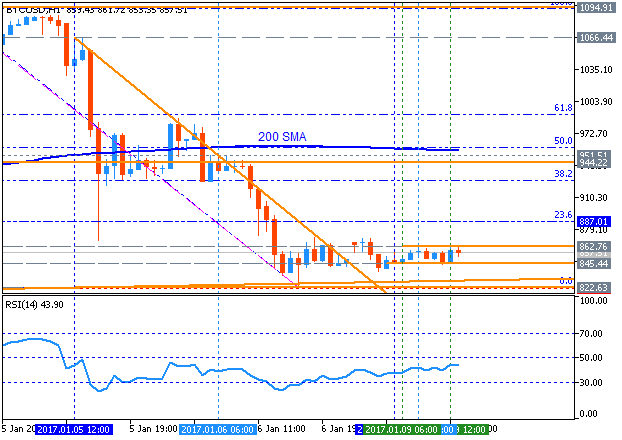
- "Bitcoin price found support around $815 and has since pulled up to the 61.8% Fibonacci retracement level on the latest swing high and low. Price is still stalling close to the 38.2% Fib and might be ready to drop back to the previous lows and beyond. The 100 SMA has crossed below the longer-term 200 SMA on this time frame to confirm that sellers are taking control of price action."
Forum on trading, automated trading systems and testing trading strategies
Sergey Golubev, 2017.01.12 16:06
Bitcoin Price Crashes as China’s PBOC Performs “On-Site Checks” of Major Exchanges (based on the article)
- "China’s central bank - the People’s Bank of China - has revealed that it carried out on-site checks on major Chinese bitcoin exchanges in Beijing and Shanghai."
- "In a public notice, the Shanghai branch of the PBOC revealed it carried out spot checks on BTC China."
From official statement:
The People’s Bank of China Shanghai HQ, the Shanghai Municipal Finance Office and other units formed a joint inspection team to carry out site inspections on Bitcoin China, focusing on checking whether it was operating beyond its business scope, whether it was engaging in unlicensed forex, payment, financing and other related businesses; whether it engaged in market manipulation; implementing anti-money laundering, financial security risks and so on.
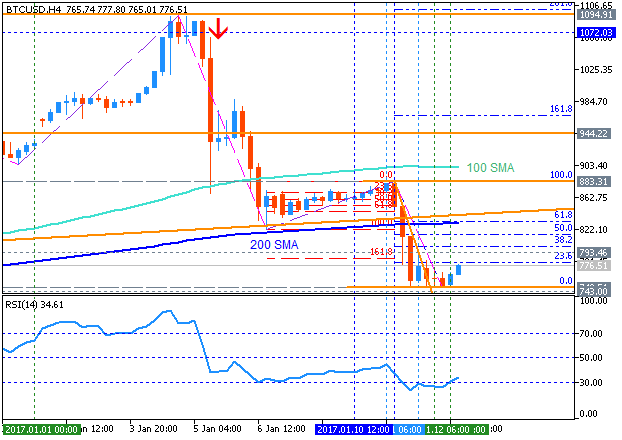
H4 intra-day price broke 100 SMA/200 SMA reversal area for the bearish breakdown: the price is on testing with 743 support level for the bearish trend to be continuing.
Forum on trading, automated trading systems and testing trading strategies
Sergey Golubev, 2017.01.27 15:45
Intra-Day Fundamentals - EUR/USD, USD/CNH and Bitcoin/USD: U.S. Advance GDP
2017-01-27 13:30 GMT | [USD - GDP]
- past data is 3.5%
- forecast data is 2.1%
- actual data is 1.9% according to the latest press release
if actual > forecast (or previous one) = good for currency (for USD in our case)
[USD - GDP] = Annualized change in the inflation-adjusted value of all goods and services produced by the economy.
==========
From official report:
- "Real gross domestic product (GDP) increased at an annual rate of 1.9 percent in the fourth quarter of 2016 (table 1), according to the "advance" estimate released by the Bureau of Economic Analysis. In the third quarter, real GDP increased 3.5 percent."
==========
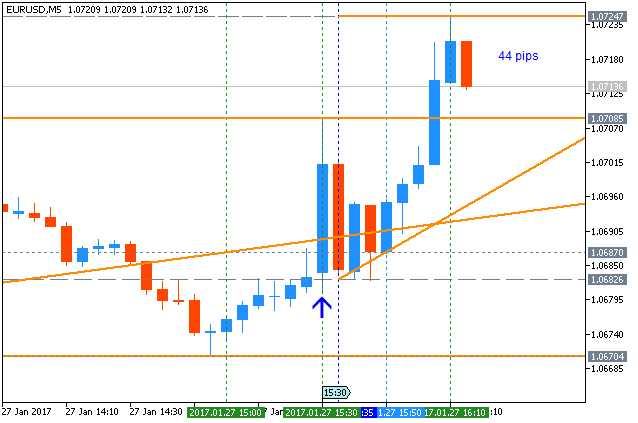
EUR/USD M5: 44 pips range price movement by U.S. Advance GDP news events
==========
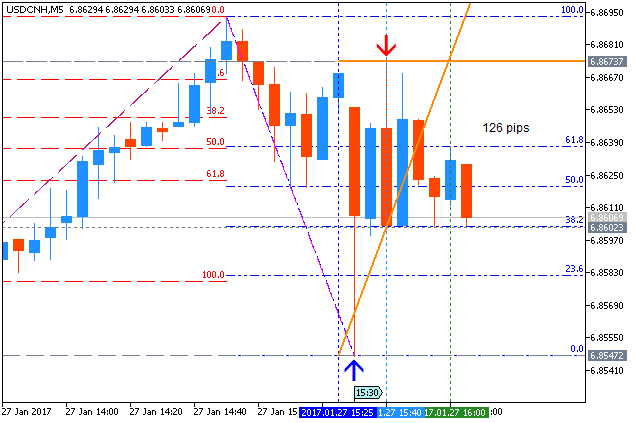
USD/CNH M5: 126 pips range price movement by U.S. Advance GDP news events
==========
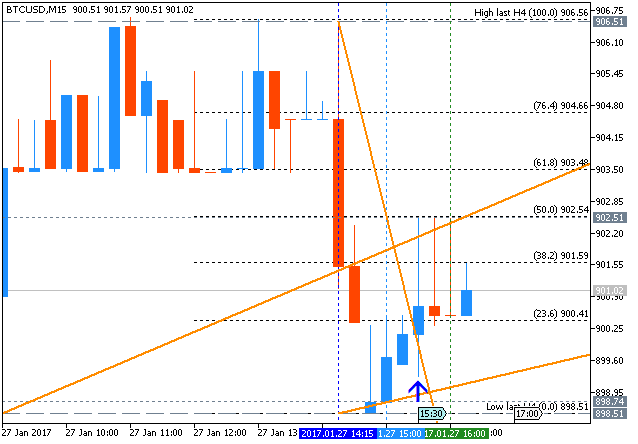
BTC/USD M5: range price movement by U.S. Advance GDP news events
BTC has been trending up and trading off of the fibonacci trendlines since this latest bull run. Use fib fans if you want the best entry points. Cheers!

Forum on trading, automated trading systems and testing trading strategies
Sergey Golubev, 2017.03.05 07:37
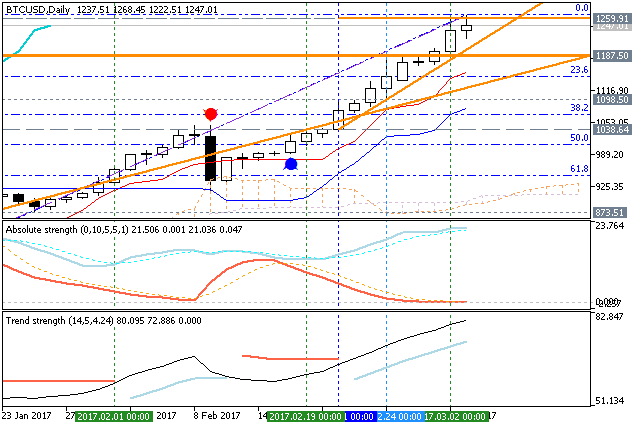
Bitcoin Is Better Than Gold; or 1,259.91 resistance level to be testing for the bullish breakout to be continuing (based on the article)
Bitcoin/USD daily price is above Ichimoku cloud to be located in the bullish area of the chart. The price is on bullish breakout which was started in the beginning of the January this year by breaking Ichimoku kumo to above with the bullish reversal. For now, the price is on testing resistance level at 1,259.91 for the bullish breakout to be continuing.
- "The Bitcoin Investment Trust Shares have almost tripled in value in the last twelve months, gaining more than 30 percent in the last three months alone. Meanwhile, SPDR Gold shares are down 3.78 percent in the last twelve months and up 4.49 percent in the last three months."
- "Apparently, Bitcoin is more popular than gold among investors."
- "The last three months in the digital currency rally, for instance, has coincided with India and Venezuela’s efforts to get rid of old currency notes. Prime Minister Modi and President Maduro have very little in common -- except they have pursued policies late last year that replace large notes in circulation with new notes (India) or with coins (Venezuela)."
- "Bitcoin supply is expected to be limited to 21 million. The supply of gold, on the other hand, is expected to increase anytime its price rises, as it provides an incentive for gold miners to mine for gold."
Forum on trading, automated trading systems and testing trading strategies
Sergey Golubev, 2017.03.10 15:08
Intra-Day Fundamentals - EUR/USD, GBP/USD, BTC/USD and Brent Crude Oil: Non-Farm Payrolls
2017-03-10 13:30 GMT | [USD - Non-Farm Employment Change]
- past data is 238K
- forecast data is 196K
- actual data is 235K according to the latest press release
if actual > forecast (or previous one) = good for currency (for USD in our case)
[USD - Non-Farm Employment Change] = Change in the number of employed people during the previous month, excluding the farming industry.
==========
From official report:
- "Total nonfarm payroll employment increased by 235,000 in February, and the unemployment rate was little changed at 4.7 percent, the U.S. Bureau of Labor Statistics reported today. Employment gains occurred in construction, private educational services, manufacturing, health care, and mining."
- "The change in total nonfarm payroll employment for December was revised down from +157,000 to +155,000, and the change for January was revised up from +227,000 to +238,000. With these revisions, employment gains in December and January combined were 9,000 more than previously reported. Monthly revisions result from additional reports received from businesses since the last published estimates and from the recalculation of seasonal factors. Over the past 3 months, job gains have averaged 209,000 per month."
==========
EUR/USD M5: 45 pips range price movement by Non-Farm Payrolls news events

==========
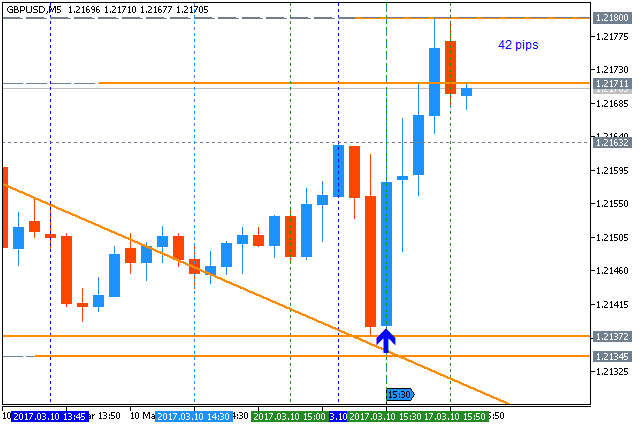
GBP/USD M5: 42 pips range price movement by Non-Farm Payrolls news events
==========
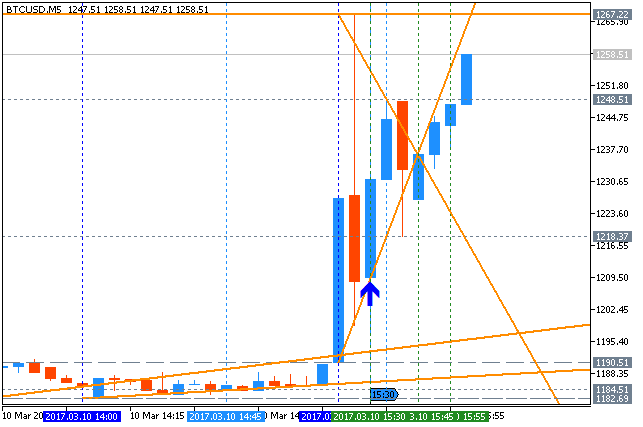
BTC/USD M5: range price movement by Non-Farm Payrolls news events
==========
Brent Crude Oil M5: range price movement by Non-Farm Payrolls news events

Forum on trading, automated trading systems and testing trading strategies
Sergey Golubev, 2017.03.14 16:14
Intra-Day Fundamentals - Dollar Index, Bitcoin/USD and Gold (XAU/USD): U.S. Producer Price Index
2017-03-14 12:30 GMT | [USD - PPI]
- past data is 0.6%
- forecast data is 0.1%
- actual data is 0.3% according to the latest press release
if actual > forecast (or previous one) = good for currency (for USD in our case)
[USD - PPI] = Change in the price of finished goods and services sold by producers.
==========
From official report:
- "The Producer Price Index for final demand increased 0.3 percent in February, seasonally adjusted, the U.S. Bureau of Labor Statistics reported today. Final demand prices rose 0.6 percent in January and 0.2 percent in December. On an unadjusted basis, the final demand index climbed 2.2 percent for the 12 months ended February 2017, the largest advance since a 2.4-percent increase in the 12 months ended March 2012."
- "In February, over 80 percent of the advance in the final demand index is attributable to a 0.4-percent increase in prices for final demand services. The index for final demand goods moved up 0.3 percent."
==========
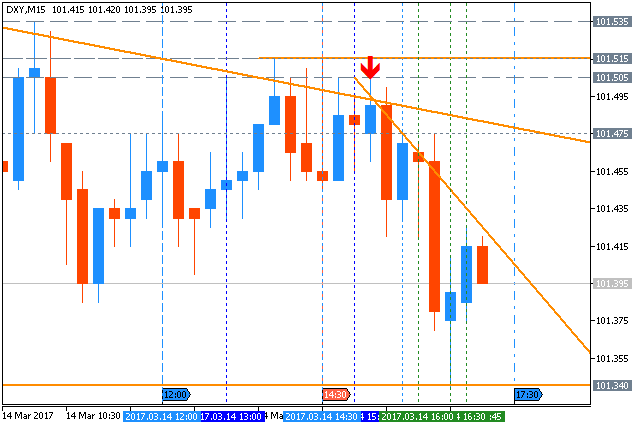
Dollar Index M5: range price movement by U.S. Producer Price Index news events
==========
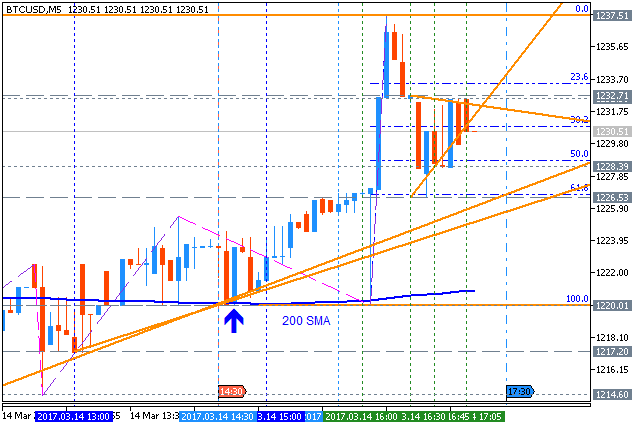
Bitcoin/USD M5: range price movement by U.S. Producer Price Index news events
==========
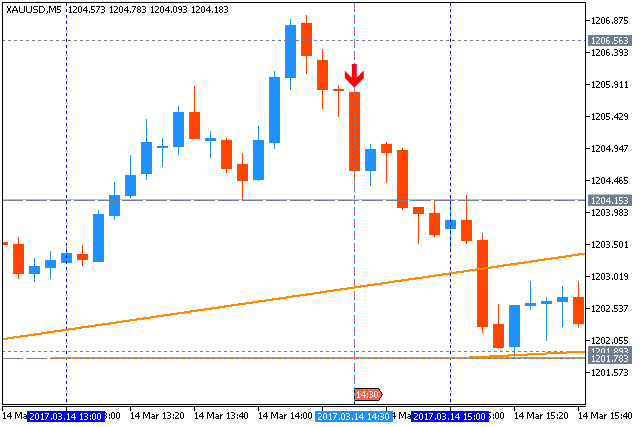
Gold (XAU/USD) M5: range price movement by U.S. Producer Price Index news events
Bitcoin vs USD January-March 2017
Forecast: key resistance level at 850.15 to be broken for the bullish trend to be continuing
Weekly (W1) price is located above Ichimoku cloud in the bullish area of the chart. The price is on ranging within the following support/resistance levels:
- 850.15 resistance level located far above Ichimoku cloud in the beginning of the bullish trend to be resumed, and
- 745.00 support level located in the beginning of the secondary correction to be started.
Chinkou Span line is located above the price indicating the ranging condition to be continuing in the near future for example.
- If the price breaks 850.15
resistance level on close weekly bar to above so the primary bullish trend will be resumed.
- If weekly price breaks 745.00 support level on close bar to below so the secondary correction within the primary bullish trend will be started.
- If weekly price breaks 475.75 support level on close bar to below so we may see the bearish reversal to be started.
- If not so the price will be on bullish ranging within the levels.
| Resistance | Support |
|---|---|
| 850.15 | 745.00 |
| N/A | 475.75 |
Trend:
- Free trading apps
- Over 8,000 signals for copying
- Economic news for exploring financial markets
You agree to website policy and terms of use
Bitcoin vs USD January-March 2017 Forecast: key resistance level at 850.15 to be broken for the bullish trend to be continuing
Weekly (W1) price is located above Ichimoku cloud in the bullish area of the chart. The price is on ranging within the following support/resistance levels:
Chinkou Span line is located above the price indicating the ranging condition to be continuing in the near future for example.
Trend:
W1 - bullish