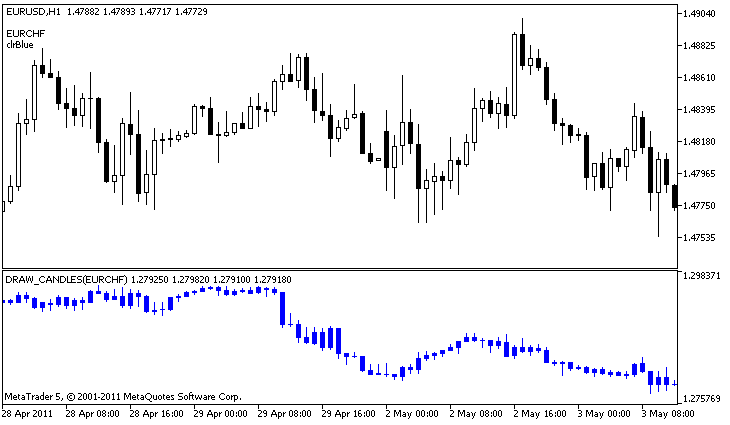
//+------------------------------------------------------------------+
//| DRAW_CANDLES.mq5 |
//| Copyright 2000-2024, MetaQuotes Ltd. |
//| https://www.mql5.com |
//+------------------------------------------------------------------+
#property copyright "Copyright 2000-2024, MetaQuotes Ltd."
#property link "https://www.mql5.com"
#property version "1.00"
#property description "An indicator to demonstrate DRAW_CANDLES."
#property description "It draws candlesticks of a selected symbol in a separate window"
#property description " "
#property description "The color and width of candlesticks, as well as the symbol are changed"
#property description "randomly every N ticks"
#property indicator_separate_window
#property indicator_buffers 4
#property indicator_plots 1
//--- plot Bars
#property indicator_label1 "DRAW_CANDLES1"
#property indicator_type1 DRAW_CANDLES
#property indicator_color1 clrGreen
#property indicator_style1 STYLE_SOLID
#property indicator_width1 1
//--- input parameters
input int N=5; // The number of ticks to change the type
input int bars=500; // The number of bars to show
input bool messages=false; // Show messages in the "Expert Advisors" log
//--- Indicator buffers
double Candle1Buffer1[];
double Candle1Buffer2[];
double Candle1Buffer3[];
double Candle1Buffer4[];
//--- Symbol name
string symbol;
//--- An array to store colors
color colors[]={clrRed,clrBlue,clrGreen,clrPurple,clrBrown,clrIndianRed};
//+------------------------------------------------------------------+
//| Custom indicator initialization function |
//+------------------------------------------------------------------+
int OnInit()
{
//--- If bars is very small - complete the work ahead of time
if(bars<50)
{
Comment("Please specify a larger number of bars! The operation of the indicator has been terminated");
return(INIT_PARAMETERS_INCORRECT);
}
//--- indicator buffers mapping
SetIndexBuffer(0,Candle1Buffer1,INDICATOR_DATA);
SetIndexBuffer(1,Candle1Buffer2,INDICATOR_DATA);
SetIndexBuffer(2,Candle1Buffer3,INDICATOR_DATA);
SetIndexBuffer(3,Candle1Buffer4,INDICATOR_DATA);
//--- An empty value
PlotIndexSetDouble(0,PLOT_EMPTY_VALUE,0);
//--- The name of the symbol, for which the bars are drawn
symbol=_Symbol;
//--- Set the display of the symbol
PlotIndexSetString(0,PLOT_LABEL,symbol+" Open;"+symbol+" High;"+symbol+" Low;"+symbol+" Close");
IndicatorSetString(INDICATOR_SHORTNAME,"DRAW_CANDLES("+symbol+")");
//---
return(INIT_SUCCEEDED);
}
//+------------------------------------------------------------------+
//| Custom indicator iteration function |
//+------------------------------------------------------------------+
int OnCalculate(const int rates_total,
const int prev_calculated,
const datetime &time[],
const double &open[],
const double &high[],
const double &low[],
const double &close[],
const long &tick_volume[],
const long &volume[],
const int &spread[])
{
static int ticks=INT_MAX-100;
//--- Calculate ticks to change the style, color and width of the line
ticks++;
//--- If a sufficient number of ticks has been accumulated
if(ticks>=N)
{
//--- Select a new symbol from the Market watch window
symbol=GetRandomSymbolName();
//--- Change the form
ChangeLineAppearance();
//--- Select a new symbol from the Market watch window
int tries=0;
//--- Make 5 attempts to fill in the buffers of plot1 with the prices from symbol
while(!CopyFromSymbolToBuffers(symbol,rates_total,0,
Candle1Buffer1,Candle1Buffer2,Candle1Buffer3,Candle1Buffer4)
&& tries<5)
{
//--- A counter of calls of the CopyFromSymbolToBuffers() function
tries++;
}
//--- Reset the counter of ticks to zero
ticks=0;
}
//--- return value of prev_calculated for next call
return(rates_total);
}
//+------------------------------------------------------------------+
//| Fills in the specified candlestick |
//+------------------------------------------------------------------+
bool CopyFromSymbolToBuffers(string name,
int total,
int plot_index,
double &buff1[],
double &buff2[],
double &buff3[],
double &buff4[]
)
{
//--- In the rates[] array, we will copy Open, High, Low and Close
MqlRates rates[];
//--- The counter of attempts
int attempts=0;
//--- How much has been copied
int copied=0;
//--- Make 25 attempts to get a timeseries on the desired symbol
while(attempts<25 && (copied=CopyRates(name,_Period,0,bars,rates))<0)
{
Sleep(100);
attempts++;
if(messages) PrintFormat("%s CopyRates(%s) attempts=%d",__FUNCTION__,name,attempts);
}
//--- If failed to copy a sufficient number of bars
if(copied!=bars)
{
//--- Form a message string
string comm=StringFormat("For the symbol %s, managed to receive only %d bars of %d requested ones",
name,
copied,
bars
);
//--- Show a message in a comment in the main chart window
Comment(comm);
//--- Show the message
if(messages) Print(comm);
return(false);
}
else
{
//--- Set the display of the symbol
PlotIndexSetString(plot_index,PLOT_LABEL,name+" Open;"+name+" High;"+name+" Low;"+name+" Close");
}
//--- Initialize buffers with empty values
ArrayInitialize(buff1,0.0);
ArrayInitialize(buff2,0.0);
ArrayInitialize(buff3,0.0);
ArrayInitialize(buff4,0.0);
//--- On each tick copy prices to buffers
for(int i=0;i<copied;i++)
{
//--- Calculate the appropriate index for the buffers
int buffer_index=total-copied+i;
//--- Write the prices to the buffers
buff1[buffer_index]=rates[i].open;
buff2[buffer_index]=rates[i].high;
buff3[buffer_index]=rates[i].low;
buff4[buffer_index]=rates[i].close;
}
return(true);
}
//+------------------------------------------------------------------+
//| Randomly returns a symbol from the Market Watch |
//+------------------------------------------------------------------+
string GetRandomSymbolName()
{
//--- The number of symbols shown in the Market watch window
int symbols=SymbolsTotal(true);
//--- The position of a symbol in the list - a random number from 0 to symbols
int number=MathRand()%symbols;
//--- Return the name of a symbol at the specified position
return SymbolName(number,true);
}
//+------------------------------------------------------------------+
//| Changes the appearance of bars |
//+------------------------------------------------------------------+
void ChangeLineAppearance()
{
//--- A string for the formation of information about the bar properties
string comm="";
//--- A block for changing the color of bars
int number=MathRand(); // Get a random number
//--- The divisor is equal to the size of the colors[] array
int size=ArraySize(colors);
//--- Get the index to select a new color as the remainder of integer division
int color_index=number%size;
//--- Set the color as the PLOT_LINE_COLOR property
PlotIndexSetInteger(0,PLOT_LINE_COLOR,colors[color_index]);
//--- Write the color
comm=comm+"\r\n"+(string)colors[color_index];
//--- Write the symbol name
comm="\r\n"+symbol+comm;
//--- Show the information on the chart using a comment
Comment(comm);
}
|
