Watch how to download trading robots for free
Find us on Twitter!
Join our fan page
Join our fan page
You liked the script? Try it in the MetaTrader 5 terminal
- Views:
- 20077
- Rating:
- Published:
- Updated:
-
Need a robot or indicator based on this code? Order it on Freelance Go to Freelance
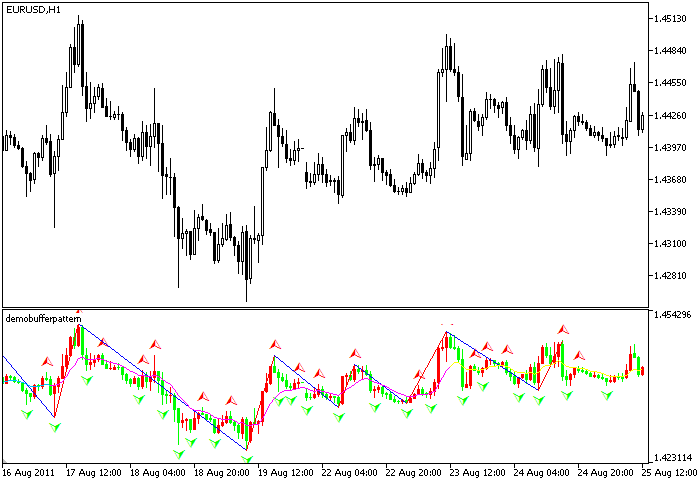
A indicator to demo buffer-pattern: Candles + Fractals + ZigzagColor + ColorMaLine.
It uses the folllowing drawing styles:
//+------------------------------------------------------------------+
//| Custom indicator initialization function                         |
//+------------------------------------------------------------------+
int OnInit()
  {
//--- indicator buffers mapping
   SetIndexBuffer( 0,P1B1,INDICATOR_DATA);
   SetIndexBuffer( 1,P1B2,INDICATOR_DATA);
   SetIndexBuffer( 2,P1B3,INDICATOR_DATA);
   SetIndexBuffer( 3,P1B4,INDICATOR_DATA);
   SetIndexBuffer( 4,P1BC,INDICATOR_COLOR_INDEX);
   SetIndexBuffer( 5,P2B1,INDICATOR_DATA);
   SetIndexBuffer( 6,P3B1,INDICATOR_DATA);
   SetIndexBuffer( 7,P4B1,INDICATOR_DATA);
   SetIndexBuffer( 8,P4B2,INDICATOR_DATA);
   SetIndexBuffer( 9,P4BC,INDICATOR_COLOR_INDEX);
   SetIndexBuffer(10,P5B1,INDICATOR_DATA);
   SetIndexBuffer(11,P5BC,INDICATOR_COLOR_INDEX);
//--- Auxiliary buffers for intermediate calculations
   SetIndexBuffer(12,P4M1,INDICATOR_CALCULATIONS);
   SetIndexBuffer(13,P4M2,INDICATOR_CALCULATIONS);
//--- They should be placed after all the buffer to be displayed, or else ... you can try it by youself

//--- ARROW
   PlotIndexSetInteger(1,PLOT_ARROW,217);
   PlotIndexSetInteger(2,PLOT_ARROW,218);
   PlotIndexSetInteger(1,PLOT_ARROW_SHIFT,-iArrowShift);
   PlotIndexSetInteger(2,PLOT_ARROW_SHIFT,iArrowShift);
   PlotIndexSetDouble(1,PLOT_EMPTY_VALUE,EMPTY_VALUE);
   PlotIndexSetDouble(2,PLOT_EMPTY_VALUE,EMPTY_VALUE);
//--- ZIGZAG
   PlotIndexSetDouble(3,PLOT_EMPTY_VALUE,0.0);
//--- MA
   maHandle=iMA(Symbol(),0,ExtPeriod,0,MODE_EMA,PRICE_CLOSE);

   return(0);
  }
//+------------------------------------------------------------------+
//| Custom indicator iteration function                              |
//+------------------------------------------------------------------+
int OnCalculate(const int rates_total,
                const int prev_calculated,
                const datetime& time[],
                const double& open[],
                const double& high[],
                const double& low[],
                const double& close[],
                const long& tick_volume[],
                const long& volume[],
                const int& spread[])
  {
//---
   CalcCandles(rates_total,prev_calculated,open,high,low,close);
   CalcFractal(rates_total,prev_calculated,high,low,P2B1,P3B1);
   CalcZigzag (rates_total,prev_calculated,high,low,P4B1,P4B2,P4BC,P4M1,P4M2);
   CalcColorMA(rates_total,prev_calculated,P5B1,P5BC);
//--- return value of prev_calculated for next call
   return(rates_total);
  }

 Ticks
Ticks
Example of a tick chart.
 Trade Sessions Indicator
This indicator is based on DRAW_FILLING buffers. The input parameters are absent, the TimeTradeServer(), TimeGMT() functions are used.
 Up and Down Indicator
This indicator allows to see the activity of the market.
 Color Parabolic SAR
Added colors to Parabolic SAR.