Join our fan page

id_digits_object - indicator for MetaTrader 5

- Views:
- 14019
- Rating:
- Published:
- Updated:
-
 You are missing trading opportunities:
- Free trading apps
- Over 8,000 signals for copying
- Economic news for exploring financial markets
Registration Log inYou agree to website policy and terms of use
If you do not have an account, please register -
 Need a robot or indicator based on this code? Order it on Freelance
Go to Freelance
Need a robot or indicator based on this code? Order it on Freelance
Go to Freelance
Clicking on any graphical object makes this indicator display these kinds of information in the Experts tab of the terminal:
- name and type of the clicked object;
- date and values of its anchor points;
- the number of decimal places (the number of digits in the fractional part) in these anchor point values.
It works with graphical objects in the main window and its subwindows.
It can help identify non-normalized anchor point values by displaying the number of decimal places in them. The function for calculation of decimal place number can be used separately for any other purpose in any other programs.
This indicator works with graphical objects listed below:
| Identifier: | Description: |
|---|---|
| OBJ_HLINE |
Horizontal Line |
| OBJ_TREND |
Trend line |
| OBJ_TRENDBYANGLE |
Trendline by angle |
| OBJ_CYCLES |
Cycle Lines |
| OBJ_ARROWED_LINE |
Arrowed line |
| OBJ_CHANNEL |
Equidistant Channel |
| OBJ_PITCHFORK |
Andrews' Pitchfork |
| OBJ_GANNLINE |
Gann Line |
| OBJ_GANNFAN |
Gann Fan |
| OBJ_GANNGRID |
Gann Grid |
| OBJ_FIBO |
Fibonacci Retracement |
| OBJ_FIBOTIMES |
Fibonacci Time Zones |
| OBJ_FIBOFAN |
Fibonacci Fan |
| OBJ_FIBOARC |
Fibonacci Arcs |
| OBJ_FIBOCHANNEL |
Fibonacci Channel |
| OBJ_EXPANSION |
Fibonacci Expansion |
| OBJ_ELLIOTWAVE5 |
Elliott Motive Wave |
| OBJ_ELLIOTWAVE3 |
Elliott Correction Wave |
| OBJ_RECTANGLE |
Rectangle |
| OBJ_TRIANGLE |
Triangle |
| OBJ_ELLIPSE |
Ellipse |
| OBJ_ARROW_THUMB_UP |
Thumb Up |
| OBJ_ARROW_THUMB_DOWN |
Thumb Down |
| OBJ_ARROW_UP |
Arrow Up |
| OBJ_ARROW_DOWN |
Arrow Down |
| OBJ_ARROW_STOP |
Stop sign |
| OBJ_ARROW_CHECK |
Check sign |
| OBJ_ARROW_LEFT_PRICE |
Left Price Label |
| OBJ_ARROW_RIGHT_PRICE |
Right Price Label |
| OBJ_ARROW_BUY |
Buy sign |
| OBJ_ARROW_SELL |
Sell sign |
| OBJ_ARROW |
Arrow object |
| OBJ_TEXT |
Text object |
Often indicators set in a chart's subwindows have values that differ from the chart's main window by the number of decimal places. This auxiliary program makes it possible to verify the decimal place number of values of the anchor points of the graphical objects (set in the subwindows of the indicators). Regardless of the decimal place number set in the main window:
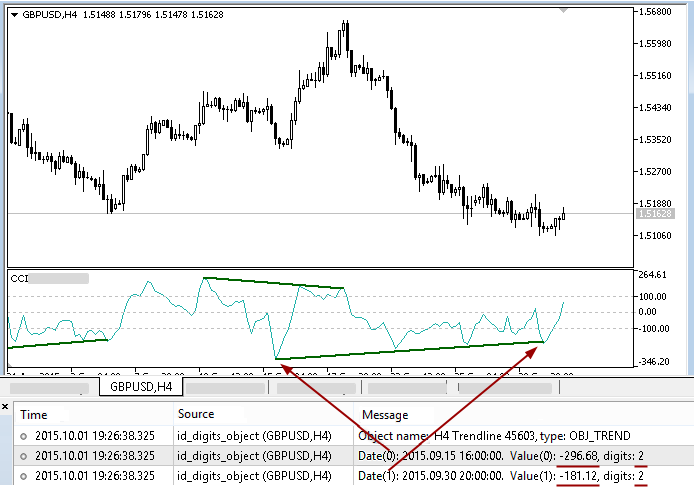
Fig. 1. CCI indicator's subwindow with two-digit values on a chart with five-digit quotes. The trend line in the CCI subwindow with two-digit values
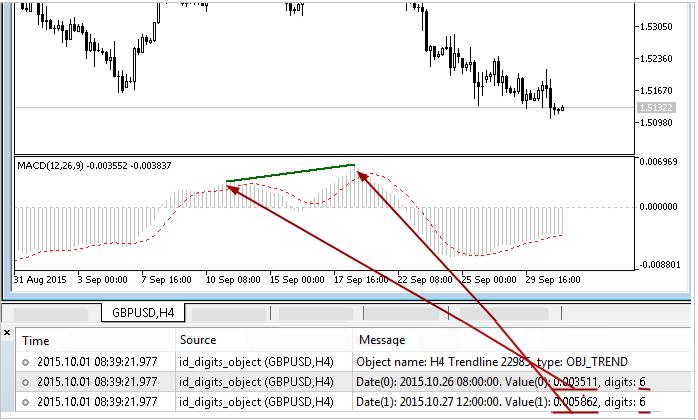
Fig. 2. MACD indicator subwindow with six-digit values on a chart with five-digit quotes. The trend line in MACD subwindow with six-digit values
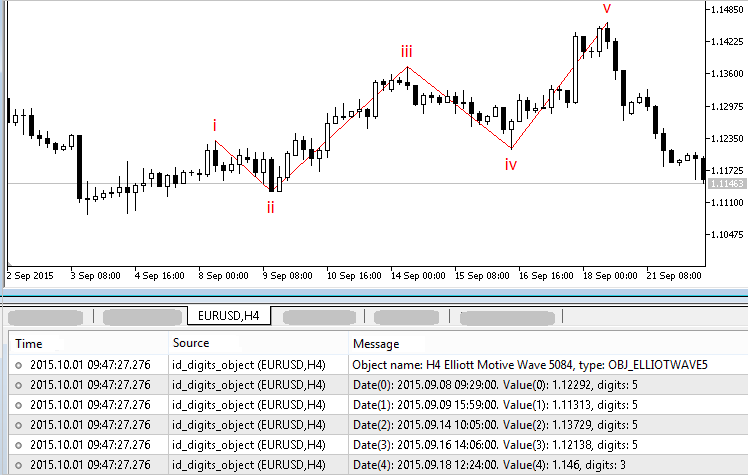
Fig. 3. Elliott Motive Wave anchor point values in a chart's main window.
Seemingly strange differences can be encountered during the application of the id_digits_objects indicator. For example, in the fig. 4 below a line with five digits is clearly visible on a five-digit quotes chart, the properties of this line also show five digits, but the indicator "boldly" displays eight:
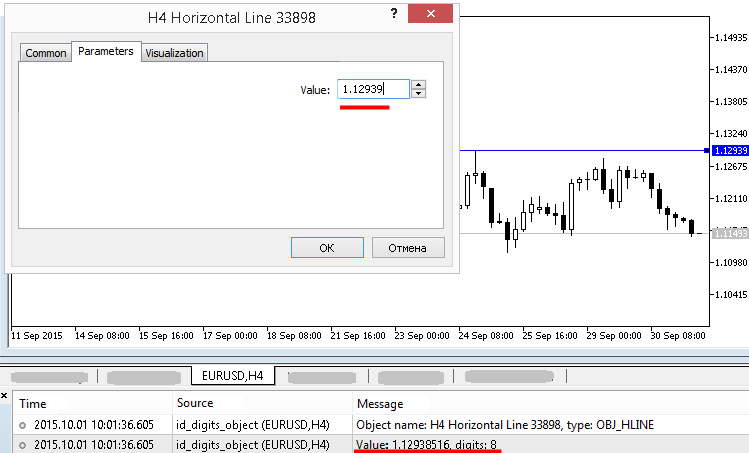
Fig. 4. id_digits_object has found a non-normalized value at a horizontal line
If this happens on a click on a programmatically set graphical object, then, if necessary, check the usage of the value normalizaton at the time the objects are set in the code of the program, which created the object. If the object was set on the chart manually, then, if necessary, its values can be edited manually in the following way:
- in the "Settings" tab of the properties dialog of such an object, click on its anchor point value (if it has several acnhor point values, it is sufficient to click on the top one, for instance);
- close the properties dialog box of the object by pressing the "Ok" button.
After that click on the object again to make sure the values are normalized with the help of id_digits_object. Figures 5 and 6 demonstrate visual oreder of the described steps:
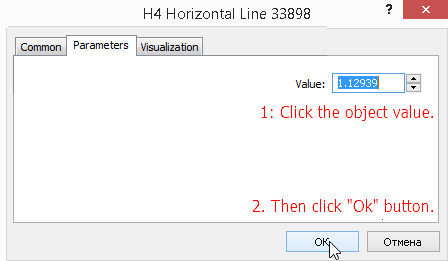
Fig. 5. Normalization of a manually set object via its properties dialog box
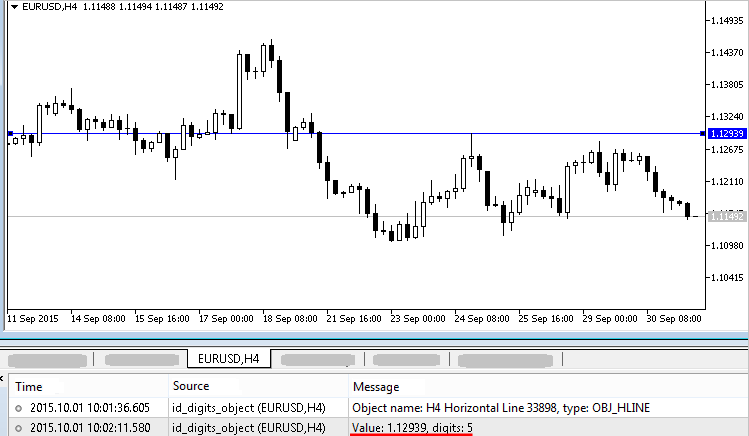
Fig. 6. The same horizontal line, but with a normalized value
However, if necessary, to normalize the anchor point values of the manually set objects programmatic ways can be used. For example, there is a ready-made indicator for trend lines, horizontal lines and Fibonacci levels: ID Rounding or deleting 3 for MT5, which not only helps normalize graphical object values, but also round them up to the required decimal point if needed.
Translated from Russian by MetaQuotes Ltd.
Original code: https://www.mql5.com/ru/code/13935
TEMA_CUSTOMCandle
The TEMA_CUSTOM indicator implemented as a sequence of candlesticks.
TEMA_CUSTOM_HTF
The TEMA_CUSTOM indicator with the timeframe selection option available in the input parameters.
 Exp_TEMA_CUSTOM
The Exp_TEMA_CUSTOM Expert Advisor is based on the TEMA_CUSTOM indicator change of direction.
Exp_XDerivative
The Exp_XDerivative Expert Advisor is based on the XDerivative oscillator change of direction.