Join our fan page
- Views:
- 3944
- Rating:
- Published:
- Updated:
-
Need a robot or indicator based on this code? Order it on Freelance Go to Freelance
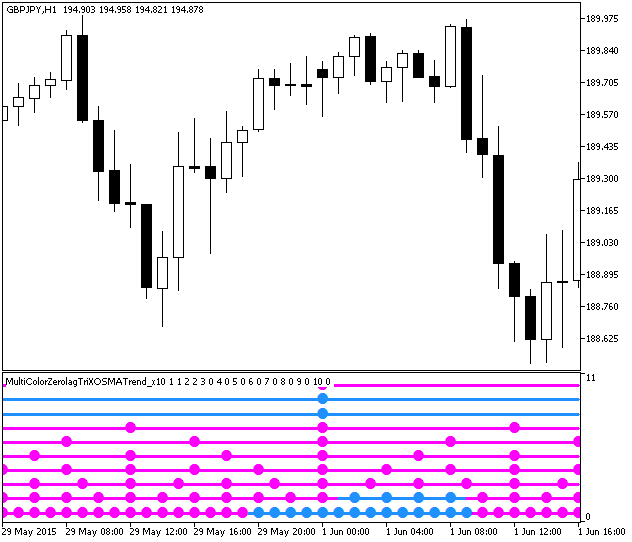
The MultiColorZerolagTriXOSMATrend_x10 indicator shows information on current trends using the ColorZerolagTriXOSMA indicator direction from ten different timeframes.
Each of the ten indicator lines corresponds to a separate indicator. Growing oscillator movement paints the lines in purple, and falling movement — in pink. Otherwise, the lines are gray. Colored dots on lines appear when a new bar opens on the corresponding timeframe.

Fig.1. The MultiColorZerolagTriXOSMATrend_x10 indicator
Translated from Russian by MetaQuotes Ltd.
Original code: https://www.mql5.com/ru/code/13293
 Time Price Scale Enables Disables
The script controls the display of time and price scales for all open charts or only for one chart.
 Keltner Channel
The indicator shows the Keltner Channel on a chart.
 ColorZerolagTriXOSMATrend_x10
The ColorZerolagTriXOSMATrend_x10 indicator shows the ColorZerolagTriXOSMA oscillator direction from ten different timeframes.
 MomentumCloud
Cloud indicator, the envelopes of which represent the Momentum oscillator values calculated for High and Low prices.