Join our fan page
- Views:
- 3534
- Rating:
- Published:
- Updated:
-
Need a robot or indicator based on this code? Order it on Freelance Go to Freelance
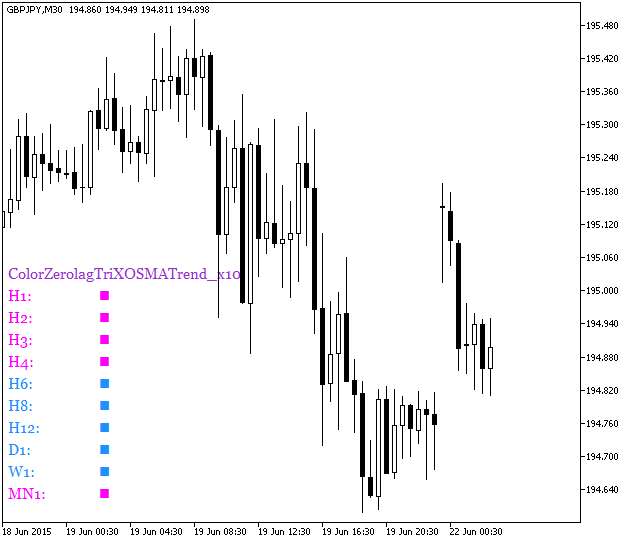
The ColorZerolagTriXOSMATrend_x10 indicator shows the ColorZerolagTriXOSMA oscillator direction from ten different timeframes.
Falling oscillator movement paints the squares in pink, growing movement — in light blue. Otherwise, the squares are gray. The indicator uses the values of the last closed bars.

Fig.1. The ColorZerolagTriXOSMATrend_x10 indicator
Translated from Russian by MetaQuotes Ltd.
Original code: https://www.mql5.com/ru/code/13294
 MultiColorZerolagTriXOSMATrend_x10
The MultiColorZerolagTriXOSMATrend_x10 indicator shows information on current trends using the ColorZerolagTriXOSMA indicator direction from ten different timeframes.
 Time Price Scale Enables Disables
The script controls the display of time and price scales for all open charts or only for one chart.
 MomentumCloud
Cloud indicator, the envelopes of which represent the Momentum oscillator values calculated for High and Low prices.
 Peak Lines by Price Histogram
This indicator shows the support/resistance lines using price histogram.