Join our fan page
- Views:
- 4417
- Rating:
- Published:
- Updated:
-
Need a robot or indicator based on this code? Order it on Freelance Go to Freelance
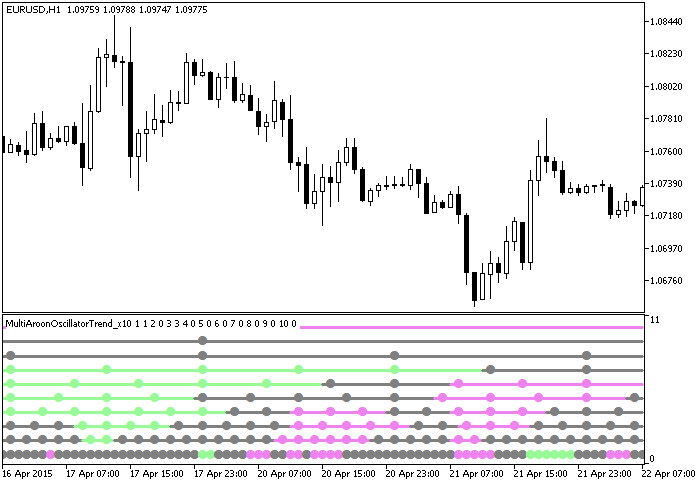
The MultiAroonOscillatorTrend_x10 indicator shows information on current trends using the AroonOscillator oscillator position from ten different timeframes.
Each of the ten indicator lines corresponds to a separate indicator. If the oscillator is positioned lower than the oversold level, the lines are painted in pale pink, if it's higher than the overbought level, the lines are painted in light green. Otherwise, the lines are gray. Colored dots on lines appear when the bar of the corresponding timeframe changes.

Fig.1. The MultiAroonOscillatorTrend_x10 indicator
Translated from Russian by MetaQuotes Ltd.
Original code: https://www.mql5.com/ru/code/13096
 ColorXMA_Ishimoku_StDev
The XMA_Ishimoku indicator with additional trend strength indication using colored dots based on the standard deviation algorithm.
 AnchoredMomentumCandle
The AnchoredMomentum indicator implemented as a sequence of candlesticks.
 AroonOscillatorTrend_x10
The AroonOscillatorTrend_x10 indicator shows the AroonOscillator oscillator position from ten different timeframes.
 KC_Cloud
Cloud channel based on Moving Averages and Average True Range.