Join our fan page
- Views:
- 15885
- Rating:
- Published:
- Updated:
-
Need a robot or indicator based on this code? Order it on Freelance Go to Freelance
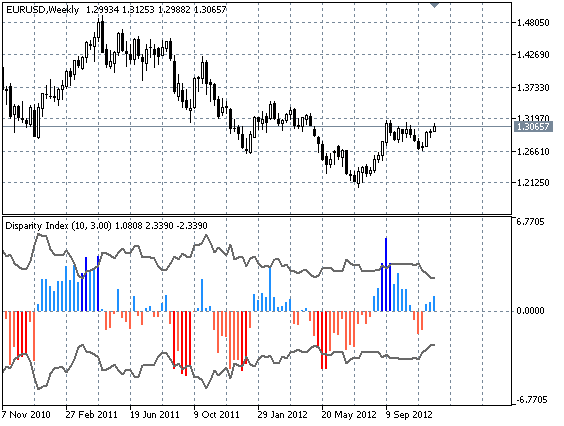
It is often said that the candlestick models of the reversal should be applied only when the market is at the high/low price level. The Disparity Index indicator is used to define these levels. I.e. when the histogram bars are blue and rising above the overbought level, you must search the candlestick combinations that signal about down reversal. And, vice versa, if the histogram bars fall below the oversold level and changes the color to red then look if it coincides with some candlestick model of up reversal.
Although you can use a fixed overbought/oversold level (3-10 percents depending on the market and the indicator parameters), this version levels are calculated dynamically. Behavior is the following:
- calculates the absolute value of price change in percentage in each bar
- calculates the average value of these changes for the set period and multiplies it on the coefficient. The received value is the overbought level. The same value with a minus sign is the oversold level

Recommendations:
- when overbought/oversold levels are overcome then it is recommended to use in combination with the candlestick models.
- when the difference index is between overbought/oversold levels, it can serve to define the trend. The increasing index indicates of the bull market, the decreasing index is about the bear market.
- another way of application is divergence trade.
Translated from Russian by MetaQuotes Ltd.
Original code: https://www.mql5.com/ru/code/1353
 i-KlPrice
A trend indicator drawn on the basis of the advanced Keltner channel.
 Renko
Renko
The renko (renko) chart in a separate subwindow. No matter on what chart timeframe the indicator is attached, the renko is drawn on close price of М1 timeframe.
 Exp_ColorLeManTrend
The Exp_ColorLeManTrend trading system is based on changes of the trend direction displayed by the ColorLeManTrend indicator
 The class to create the ring buffer
The class allows to organize the mini time series, indicator minibuffers, short sized buffers to store intermediate stream data inside the Expert Advisor or indicator.