Join our fan page
- Views:
- 19347
- Rating:
- Published:
- Updated:
-
Need a robot or indicator based on this code? Order it on Freelance Go to Freelance
Author of an idea:
The original code has been published by Collector.
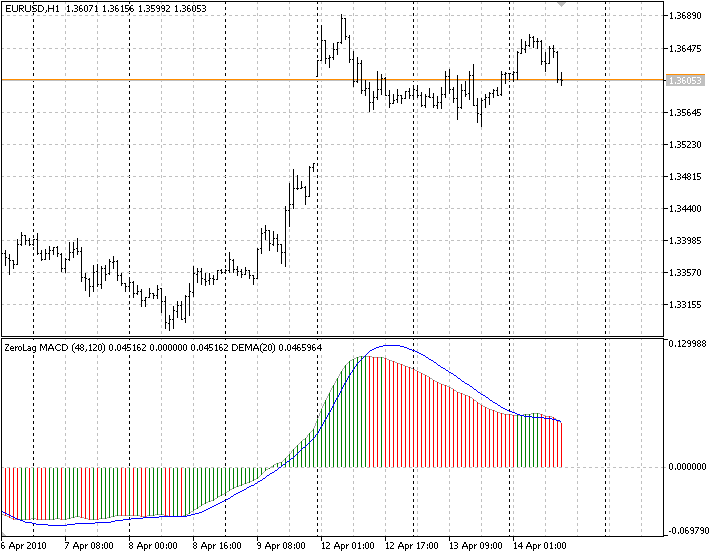
The ZeroLag MACD indicator shows the histogram with color of the previous bar.
The indicator is based on the MACD from MetaTrader 5 standard package. Added the filling and changed the formula of its calculation. I used the formula from the original code.
The signal line has been removed. The original version is based on the Double Exponential Moving Average (DEMA).

ZeroLag MACD
Translated from Russian by MetaQuotes Ltd.
Original code: https://www.mql5.com/ru/code/100
 XmlParser
A simple XML-parser, based on the msxml library.
 iBBFill
The indicator plots the Bollinger Bands ®, filled with different colors depending on the trend direction.
 Murrey Math Lines (support and resistance)
The indicator plots Murrey Math Lines for all available history, it doesn't uses any objects.
 PivotPointUniversal
The indicator plots Pivot levels for all available history. There are 5 variants of Pivot levels is supported: Classic, Fibonacci, Demark, Camarilla, Woodies. There are 3 calculation periods: daily, weekly, monthly. For the daily pivot levels it's possible to specify the GMT time shift.