

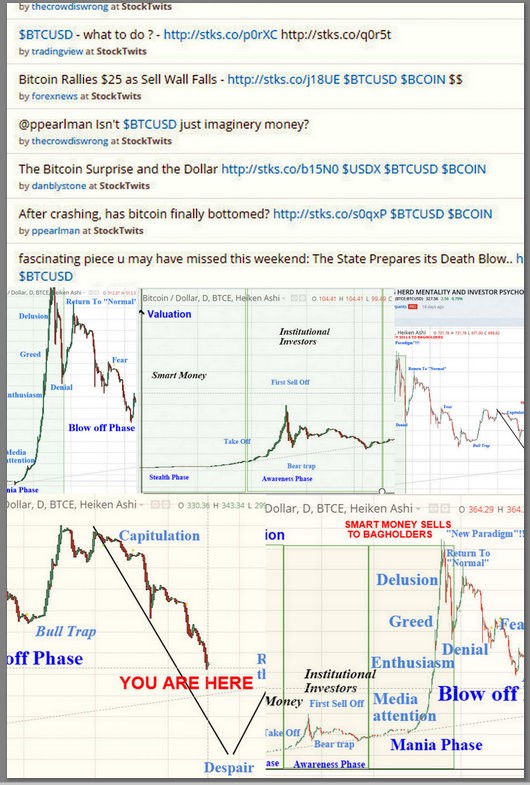
The main take away from this bitcoin charts is the irrationally euphoric parabolic rise and subsequent "fall from grace". This momo bitcoin pattern can be seen in so many 2000 tech stocks and more recently AAPL or TSLA. Once momentum is broken, the initial retreat is fast and hard followed by the "it's too cheap" bounce (momo is trying to regain) unfortunately the psychological trading bitcoin trend has long since been broken and what is left are the corrective bitcoin price waves down. (the underlying security is left to it's own merits and not driven by easy money).

Bitcoin price charts psychology gallery
Files:


 & AMD Framework")

")