Multi Timeframe Signal Workshop: rule language and indicator reference

Multi Timeframe Signal Workshop marks every bar where a signal you build fires. Every signal is a rule written in a small text language: the condition cards write it for you as you click, and a signal file takes it as you type it. This post is the full reference for that language: every name a rule can read, every number it takes, what each one means and where its definition comes from, so you can decide which ones you trust.
Installing the indicator, the panel, building a signal by clicks, groups, alerts and signal files are in the user guide: Multi Timeframe Signal Workshop: user guide for MT5 and MT4.
Contents
- The rule language
- Indicator reference
- Price structure reference
- Examples
1. The rule language
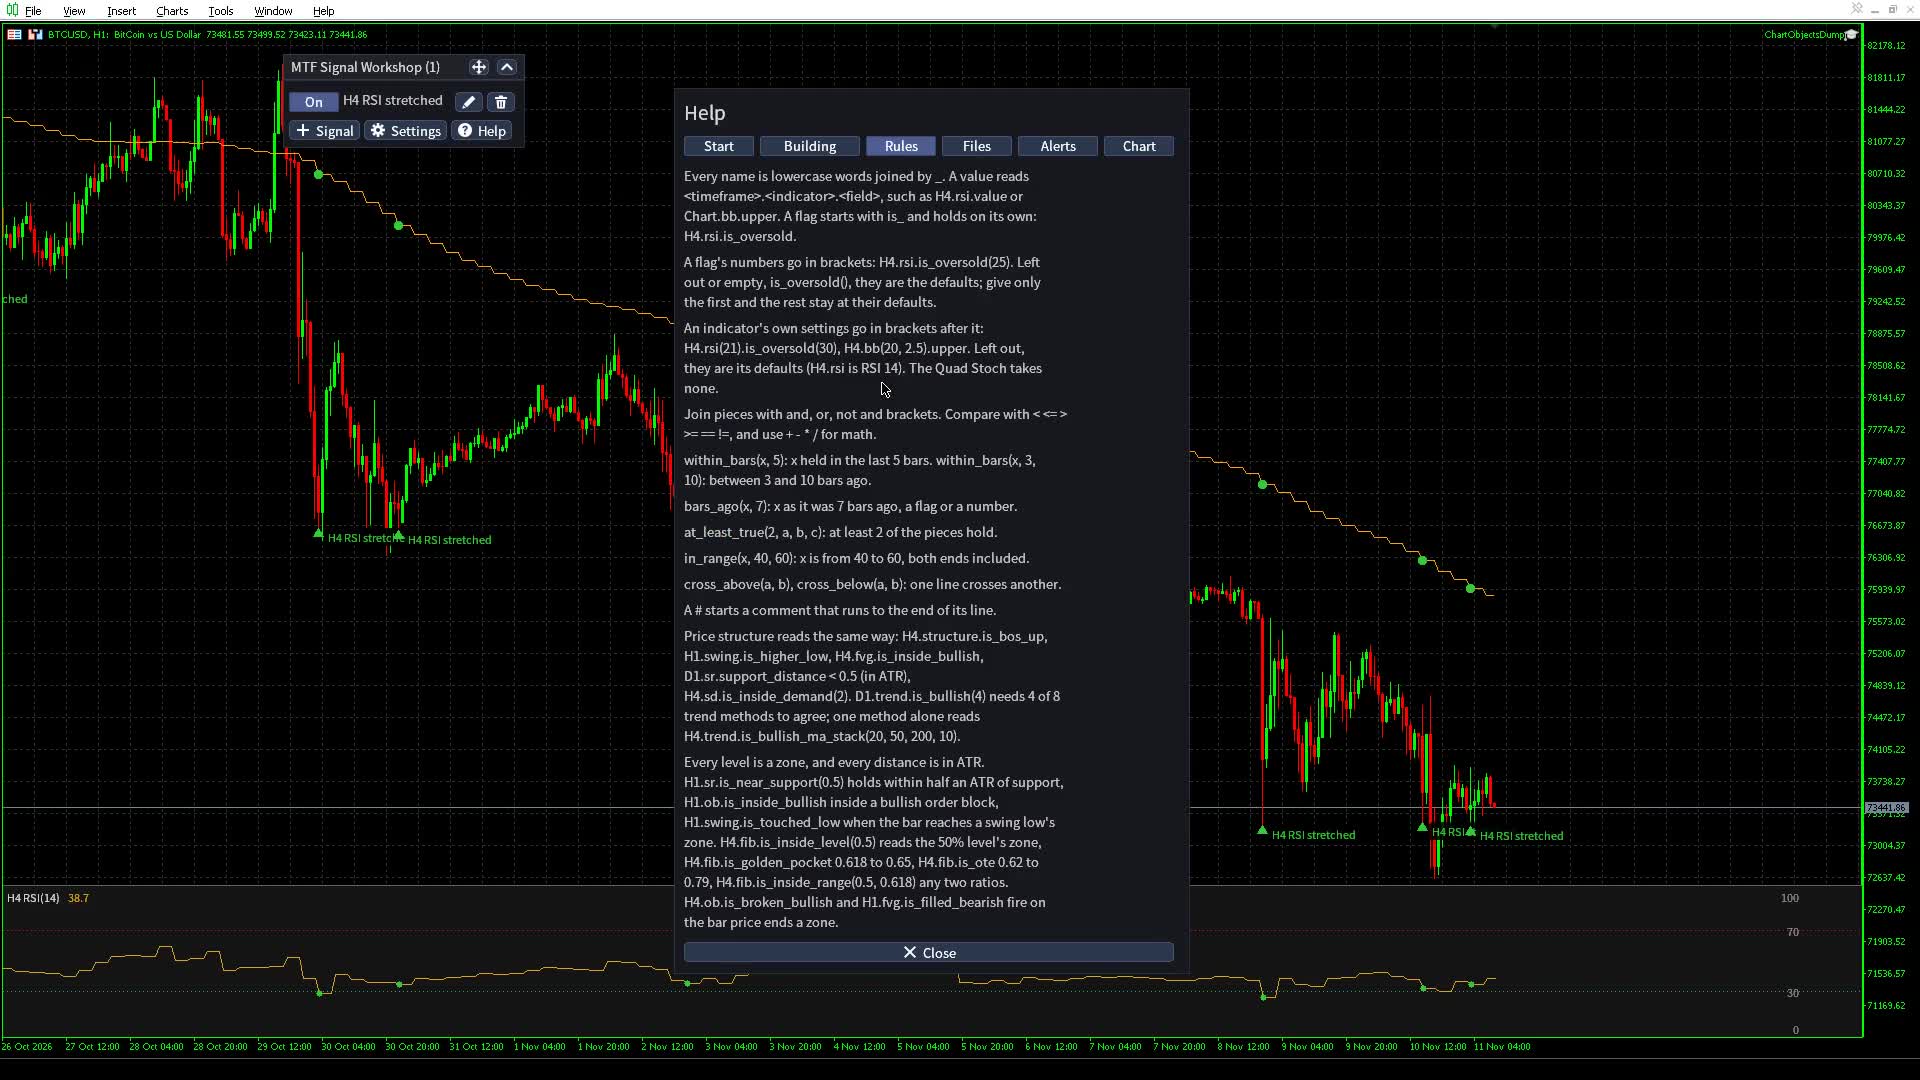
Every condition, from a card or a file, is a piece of this language. The cards write it for you; a file takes it as you write it. The Help dialog's Rules page sums it up.
A signal file is plain text: lines starting with # are comments, marker: bullish or marker: bearish before the rule sets the arrow (bullish without it), and everything else is the rule, over as many lines as you like. Where the files live and how to write, load and share one is in the user guide.
Names
A value is named in three parts, <timeframe>.<indicator>.<field>, joined by dots:
- timeframe: Chart, the timeframe of the chart the rule runs on, or a fixed one: M1, M5, M15, M30, H1, H4, D1, W1, MN1, and on MT5 also M2, M3, M4, M6, M10, M12, M20, H2, H3, H6, H8 and H12. Fixed timeframes are uppercase; Chart is written as here.
- indicator: an id from section 2, at its default settings, or with its own settings in brackets after it (below). ema<N> and sma<N> take any period from 1 to 1000: ema200, sma9.
- field: a line of the indicator, which is a number (value, upper, hist), or a flag, a true or false test that starts with is_ (is_oversold, is_cross_up).
Every name is lowercase words joined by _. H4.rsi.value is the RSI on H4. D1.ema200.is_above is true while the daily close is above the daily EMA 200. Chart.bb.upper is the upper Bollinger band on the chart's own timeframe.
Indicator settings
An indicator takes its own settings in brackets right after its id, in the order section 2 lists them: H4.rsi(21).is_oversold(30) is a 21-period RSI under 30, H4.bb(20, 2.5).upper the upper band at 2.5 deviations, D1.macd(8, 21, 5).is_cross_up a faster MACD crossing its signal, ema(30) an EMA of 30 (the same as ema30). Left out, the settings are the defaults: H4.rsi.is_oversold is RSI 14. Give only the first ones and the rest stay at their defaults: D1.macd(8, 21) keeps the signal at 9.
- A switch is 0 for Off and 1 for On, a choice its position from 0: H1.fvg(1) is a gap filled at its middle (Half) instead of in full.
- Settings that only change the drawing (how many zones show, whether used ones stay, the Fib extensions) are not settings a rule takes.
- The Quad Stoch takes none: its four stochastics are Kurisko's setup. price, obv and the ema<N> / sma<N> ids take none either; write ema(N) for another period.
- A setting out of range, a fraction where a whole number is needed, MACD's fast period at or above its slow one, or too many settings refuses the rule with the setting named.
- Each set of settings is its own indicator: a rule reading H4.rsi and H4.rsi(7) draws two RSI docks, labelled RSI(14) and RSI(7).
The condition editor shows the settings under the indicator, at their defaults; change one there and the rule text carries it.
Flags and their numbers
A flag that takes numbers has them in brackets after its name: H4.rsi.is_oversold(25), D1.macd.is_bull_div(3, 40). Left out, or left empty as in H4.rsi.is_oversold(), they are the defaults listed in section 2. Give only the first numbers and the rest stay at their defaults: D1.rsi.is_bull_div(3) is 3 pivot bars and the default 60 for the most bars between pivots. A number may have a sign (H1.cci.is_oversold(-150)). A number out of range, a fraction where a whole number is needed, or too many numbers refuses the rule with a reason that names the number.
A flag is either a state, true on every bar it holds (is_oversold, is_above, is_inside_bullish), or an event, true on the one bar it happens (is_cross_up, is_bos_up, is_flip_up). Section 2 marks the events. An event is usually read with within_bars, so it counts for a few bars after it happened.
Numbers, comparisons and math
Lines compare with numbers or other lines: <, <=, >, >=, ==, !=. Math takes +, -, *, / and power (^ or **), and the functions abs(x), min(a, b), max(a, b), round(x), floor(x) and ceil(x). Lines from different timeframes mix freely:
H1.rsi.value > D1.rsi.value
H4.macd.hist > 0
H1.atr.value > 1.3 * H1.atr.average
abs(H4.price.value - H4.ema50.value) / H4.atr.value < 0.5
A rule must end as true or false. H4.rsi.value alone is a number and is refused with expected bool.
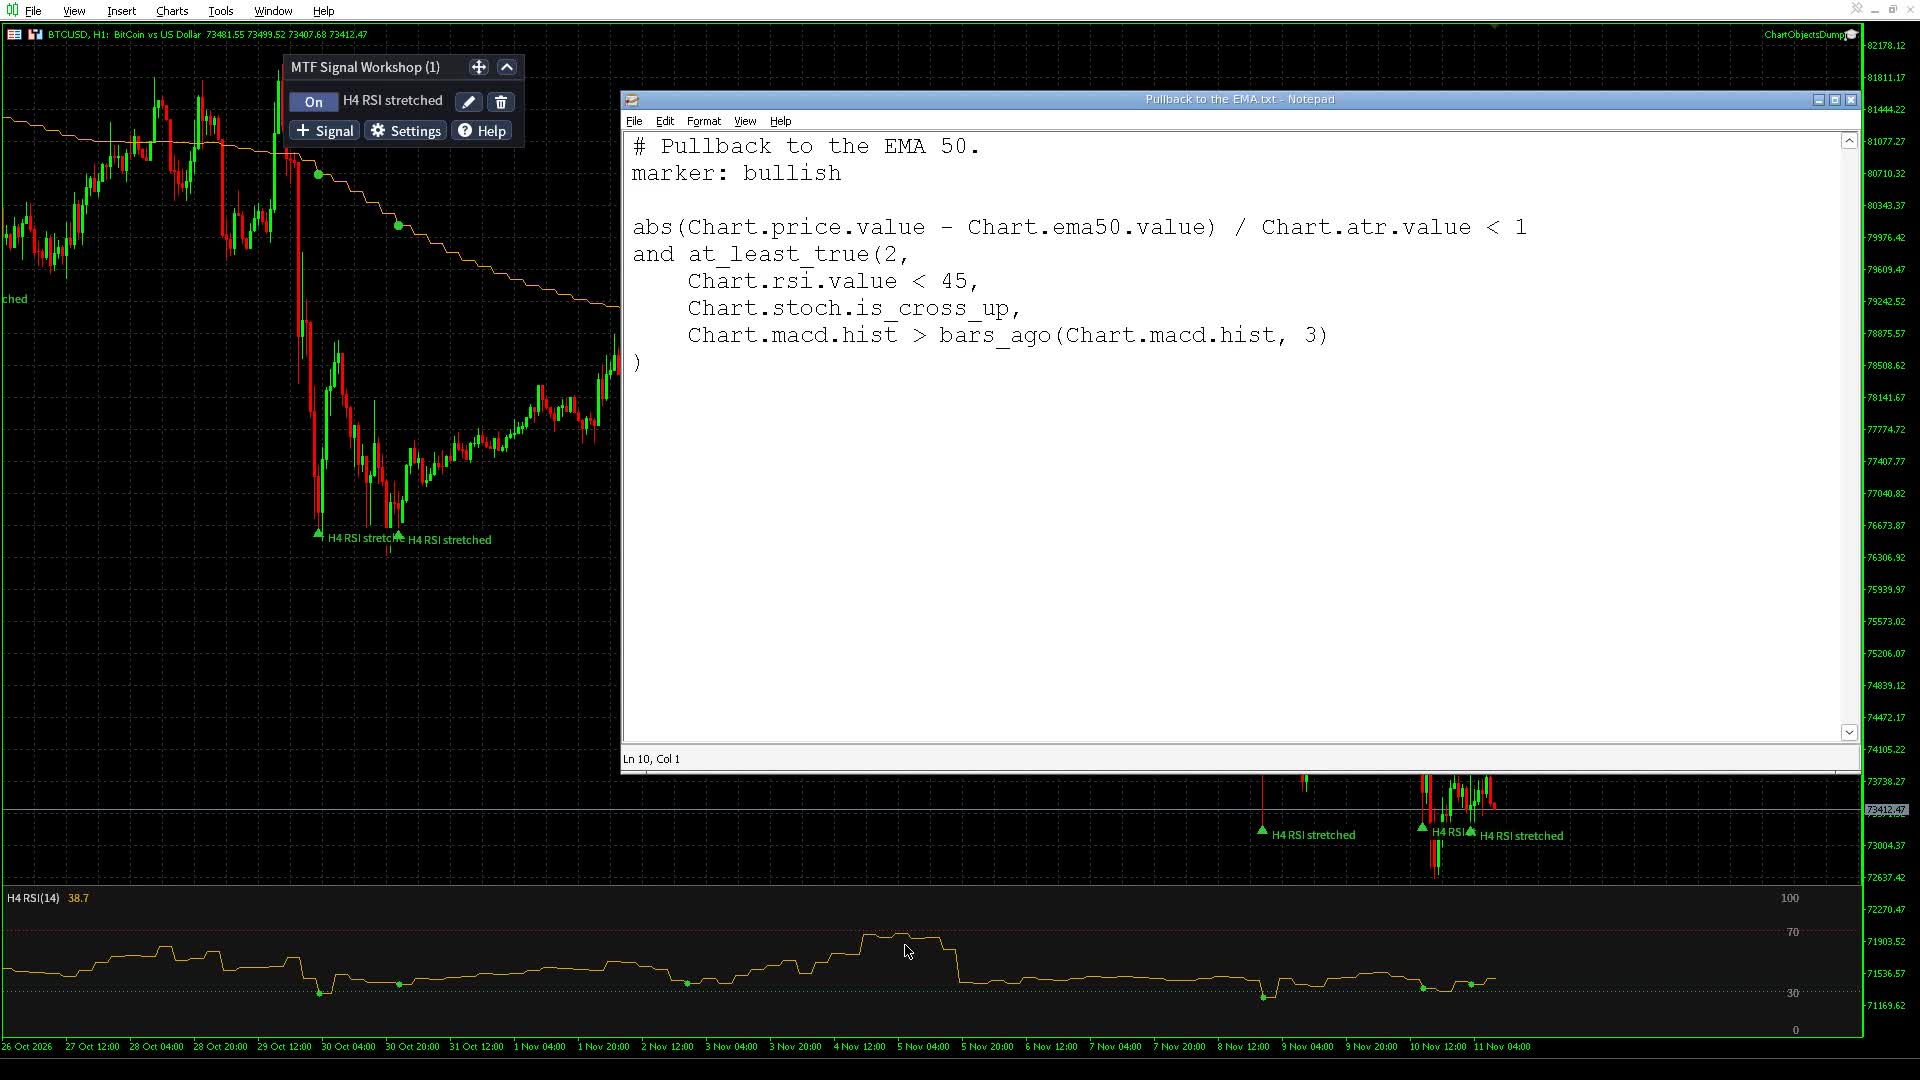
The video's last file, Pullback to the EMA.txt, uses math and a count together:
# Pullback to the EMA 50.
marker: bullish

abs(Chart.price.value - Chart.ema50.value) / Chart.atr.value < 1
and at_least_true(2,
    Chart.rsi.value < 45,
    Chart.stoch.is_cross_up,
    Chart.macd.hist > bars_ago(Chart.macd.hist, 3)
)
The first line takes the close minus the EMA 50, made positive by abs, and divides it by the ATR: under 1 means the close is within one ATR of the average, on any symbol. at_least_true(2, ...) then wants two of the three after it: RSI under 45, the stochastic crossing up, and the MACD histogram above its value three bars ago, which bars_ago reads. Because abs counts the distance on either side, the rule also fires just under the EMA in a downtrend; add and Chart.ema50.is_above to keep only pullbacks that stay above it.

Joining pieces
and, or and not join pieces, and brackets group them; &&, || and ! work too. Operators bind in this order, tightest first: a sign or not, power, * and /, + and -, comparisons, and, then or. Power groups right to left. Put brackets around a comparison after not: not (H4.rsi.value > 50). Brackets nest up to 32 deep.
The group headers of the signal editor write these words:
| Header | Rule text |
|---|---|
| All of these | a and b and c |
| Any of these | (a or b or c) |
| At least K of these | at_least_true(K, a, b, c) |
| Not all of these | not (a and b and c) |
| None of these | not (a or b or c) |
| Fewer than K of these | not at_least_true(K, a, b, c) |
| When: In the last N bars | within_bars(group, N) |
| When: N bars ago | bars_ago(group, N) |
| When: Between N and M bars ago | within_bars(group, N, M) |
Functions
| Function | Holds when |
|---|---|
| within_bars(x, N) | x held on any of the last N closed bars of its own timeframe, the latest included. N from 1 to 1000. |
| within_bars(x, near, far) | x held on a bar from near to far bars back, 0 being the latest closed bar. within_bars(H4.macd.is_cross_up, 3, 10) is a cross between 3 and 10 H4 bars ago. |
| bars_ago(x, N) | x as it was N bars back, a flag (bars_ago(H4.rsi.is_oversold, 7) held exactly 7 bars ago) or a number (H4.rsi.value > bars_ago(H4.rsi.value, 7) is RSI above where it was 7 bars ago). |
| at_least_true(K, a, b, ...) | at least K of the pieces hold. K from 1 to the number of pieces. |
| in_range(x, low, high) | the number x is from low to high, both ends included. A range written high to low never holds. |
| cross_above(a, b) | a is above b on the latest bar and was at or below it on the bar before. |
| cross_below(a, b) | a is below b on the latest bar and was at or above it on the bar before. |
within_bars and bars_ago count the bars of each name's own timeframe: within_bars(D1.rsi.is_bull_div, 3) looks back three daily bars on any chart.
The Quad Stoch's all and any
The Quad Stoch has four lines. quad_stoch.all and quad_stoch.any compare all of them at once, in an ordered comparison only (<, <=, >, >=): H4.quad_stoch.all < 10 holds when every line is under 10, H4.quad_stoch.any > 90 when at least one is over 90. ==, !=, math and a bare all are refused with the reason.
How a rule is evaluated
- Every value is read on closed bars of its own timeframe. A value from a higher timeframe changes only when that timeframe's bar closes, so an H4 piece can make the rule true only on the chart bar where an H4 bar closed.
- A signal fires on the closed bar where its rule becomes true, then waits Min bars between signals before it can fire again.
- A value that is missing (history still loading, an indicator still warming up) is unknown, never 0 and never true. A rule with an unknown piece has no match on that bar, including the other side of an or and anything under a not.
- A rule reading another timeframe runs over the history the broker has for that timeframe.
2. Indicator reference
Each indicator id has default settings, so a rule names everything it needs, and takes its own settings in brackets in the order the tables list them (section 1). The tables list each id's settings, its lines (numbers to compare) and its flags with their numbers and defaults. A flag marked (event) is true only on the bar it happens. Every flag follows a published definition, and its source is given so you can check it and decide whether to trust it.
Price and moving averages
price is the close, ema<N> an exponential and sma<N> a simple moving average over N bars (1 to 1000). The indicator list offers EMA and SMA at 21, 50, 100 and 200; a file takes any period.
| Field | What it is |
|---|---|
| value | the close (price) or the average, in price units |
| is_above, is_below | the close above or below the average (Granville) |
| is_cross_up, is_cross_down (event) | the close crosses the average upward or downward |
| is_near(percent = 0.5) | the close within that percent of the average. There is no published number; 0.5 percent is a common screener default |
| is_near_atr(distance = 0.5) | the close within that many ATR (14) of the average, the same on every symbol and timeframe |
H4.price.value is the close of the last closed H4 bar and compares with anything: D1.price.value > D1.ema200.value is the same as D1.ema200.is_above.
Bands and channels
| Id | Settings | Lines |
|---|---|---|
| bb (Bollinger Bands) | period 20, deviations 2.0 | upper, middle, lower |
| keltner (Keltner Channel) | period 20, ATR multiplier 2.0, ATR period 10 | upper, middle, lower |
| donchian (Donchian Channel) | period 20 | upper, middle, lower |
Where the definitions and defaults come from: Bollinger Bands are John Bollinger's, as TradingView and StockCharts draw them: the simple average of the close and bands that many standard deviations away, where the standard deviation divides by the period (the population deviation), 20 bars and 2 deviations. The Keltner Channel is the one in StockCharts and TradingView's Keltner Channels: the 20-bar EMA of the close plus and minus 2 times Wilder's ATR, and the ATR has its own period, the third setting (10 by default).
| Flag | Of | True when | Source |
|---|---|---|---|
| is_above_upper, is_below_lower | bb, keltner | the close beyond the upper or the lower band | Bollinger's %B above 1 or below 0 |
| is_break_up, is_break_down (event) | bb, keltner | the close crosses over the upper band or under the lower one | %B crossing 1 or 0 |
| is_squeeze(bars = 125) | bb | BandWidth, (upper - lower) / middle, at its lowest of the last bars bars | Bollinger, "Bollinger on Bollinger Bands": about six months of daily bars |
| is_breakout_up, is_breakout_down (event) | donchian | the close beyond the channel of the bars before it, on the first bar it is | Donchian; the Turtle rule |
Trend indicators
| Id | Settings | Lines |
|---|---|---|
| supertrend | ATR period 10, multiplier 3.0 | up (has a value in an up trend), down (in a down trend) |
| psar (Parabolic SAR) | step 0.02, maximum 0.2 | long (the dots below price), short (the dots above) |
| ichimoku | tenkan 9, kijun 26, senkou B 52 | tenkan, kijun, spanA, spanB |
| adx | period 14 | adx, plus (+DI), minus (-DI) |
Where the definitions and defaults come from: the Supertrend is TradingView's, with its built-in numbers (ATR period 10, factor 3): the bands are the middle of the bar plus and minus the factor times Wilder's ATR, the first bar with an ATR starts a down trend, and the trend flips when the close passes the band of the same bar. The Parabolic SAR is Wilder's, as TradingView draws it: step 0.02 and maximum 0.2, and the SAR never moves inside the range of the two bars before it.
| Flag | Of | True when | Source |
|---|---|---|---|
| is_bullish, is_bearish | supertrend, psar | the up line or the down line is drawn | the published Supertrend; Wilder for the SAR |
| is_flip_up, is_flip_down (event) | supertrend, psar | the trend turns | same |
| is_above_cloud, is_below_cloud, is_in_cloud | ichimoku | the close against the cloud drawn over the bar (the spans shifted 25 bars ahead) | Hosoda's Ichimoku |
| is_cloud_break_up, is_cloud_break_down (event) | ichimoku | the close crosses out of the cloud | the Kumo breakout |
| is_trending(level = 25) | adx | ADX above the level | Wilder |
| is_strong_trend(level = 50) | adx | ADX above the level | the usual "very strong" band starts at 50 |
| is_ranging(level = 20) | adx | ADX below the level | Wilder |
| is_cross_up, is_cross_down (event) | adx | +DI crosses -DI upward or downward | Wilder |
Oscillators
| Id | Settings | Lines | Oversold, overbought |
|---|---|---|---|
| rsi | period 14 | value (0 to 100) | 30, 70 |
| mfi (Money Flow Index, tick volume) | period 14 | value (0 to 100) | 20, 80 |
| stoch (Stochastic) | %K 14, %D 3, slowing 3 | k, d | 20, 80 |
| stochrsi (Stochastic RSI) | stoch 14, RSI 14, %K 3, %D 3 | k, d | 20, 80 |
| cci | period 20 | value | -100, 100 |
| willr (Williams %R) | period 14 | value (-100 to 0) | -80, -20 |
| macd | fast 12, slow 26, signal 9 | line, signal, hist | |
| quad_stoch (Quad Stochastic) | %K / %D 9/3, 14/3, 40/4, 60/10 | d1, d2, d3, d4 (the four %D lines), all, any | 20, 80 |
| Flag | Of | True when | Source |
|---|---|---|---|
| is_oversold(level), is_overbought(level) | rsi, mfi, stoch, stochrsi, cci, willr | the line below or above the level; the defaults are in the table above | Wilder (RSI); Quong and Soudack (MFI); Lane (Stochastic); Lambert (CCI); Williams (%R) |
| is_extreme(level = 200) | cci | CCI beyond the level either way | the usual CCI extreme band |
| is_cross_up, is_cross_down (event) | stoch, stochrsi | %K crosses %D | Lane |
| is_cross_up, is_cross_down (event) | macd | the MACD line crosses its signal | Appel |
| is_zero_cross_up, is_zero_cross_down (event) | macd | the MACD line crosses 0 | the centerline crossover |
| is_hist_above_zero, is_hist_below_zero | macd | the histogram above or below 0 | the MACD histogram |
| is_bull_div(pivot bars = 5, max bars = 60), is_bear_div(...) | every oscillator, volume, obv | a regular divergence holds (below) | the standard pivot divergence method |
| is_hidden_bull_div(...), is_hidden_bear_div(...) | every oscillator, obv | a hidden divergence holds (below) | same |
| is_oversold(level = 20), is_overbought(level = 80) | quad_stoch | all four lines below or above the level | Kurisko's quad rotation |
| is_super_bull(level = 20, pivot bars = 5, max bars = 60), is_super_bear(level = 80, ...) | quad_stoch | Kurisko's divergence on the 9-3 (below) | Kurisko |
| is_embedded_bull(level = 80, 9-3 level = 20, EMA length = 20), is_embedded_bear(20, 80, 20) | quad_stoch | the 60-10 and the 40-4 at or above the first level, the 9-3 at or under the second, and the close on or above the EMA; the bear flag mirrors it | Kurisko's embedded flag |
Divergences. A pivot low is the lowest bar of pivot bars bars on each side, so it is known pivot bars bars after it. Two pivot lows at most max bars apart form a regular bullish divergence when price makes a lower low and the indicator a higher low, and a hidden bullish divergence when price makes a higher low and the indicator a lower low. Bearish mirrors it at the highs. A divergence is a state: true from the bar that confirms it for as many bars as its line is long, first pivot to second, and false from the first bar price goes past the second pivot (under its low for bullish). So D1.macd.is_bull_div and H4.quad_stoch.all <= 20 holds while the daily divergence is still in play, not only on the bar it is confirmed. MACD diverges on its MACD line, the stochastics on %K, the Quad Stoch on its first line.
Kurisko's super divergence. is_super_bull takes its two lows from 9-3 pivots, paired as above. At the first low all four stochastics are under the level. At the second, price makes a lower low or at least a double bottom while the 9-3 holds at or above the level and makes a higher low. is_super_bear mirrors it at the highs.
Volatility and volume
| Id | Settings | Lines |
|---|---|---|
| atr | period 14, Wilder's smoothing, its average over 50 bars | value, average |
| volume (tick volume) | its average over 20 bars | value, average |
| obv (On Balance Volume, tick volume) | value |
| Flag | Of | True when | Source |
|---|---|---|---|
| is_expansion(times = 1.5) | atr | ATR above that many times its average | no published number; a common screener default |
| is_contraction(times = 0.7) | atr | ATR under that many times its average | same |
| is_spike(times = 2) | volume | volume at or above that many times its average | same |
| is_dry(times = 0.3) | volume | volume under that many times its average | same |
volume and obv also take is_bull_div and is_bear_div, and obv the hidden ones, as above.
Price structure ids
Section 3 defines each of these. Their fields:
| Id | Lines | Flags |
|---|---|---|
| swing | last_high, last_low (the latest known swing prices) | is_new_high, is_new_low, is_higher_high, is_lower_high, is_higher_low, is_lower_low (events); is_inside_high, is_inside_low, is_touched_high, is_touched_low, is_near_high(distance = 0.5), is_near_low(distance = 0.5) |
| structure | trend (1 up, -1 down, 0 none), high_level, low_level (the swing levels not broken yet) | is_bos_up, is_bos_down, is_choch_up, is_choch_down (events); is_up, is_down |
| trend | value (1 bullish, -1 bearish, 0 neither) | is_bullish(methods = 4), is_bearish(...), is_sideways(...), and for each method is_bullish_<method>, is_bearish_<method>, is_sideways_<method> |
| fib | start, end (the last leg's start and end prices) | is_above(ratio = 0.618), is_below(ratio = 0.382), is_golden_zone, is_golden_pocket, is_ote, is_inside_range(from = 0.618, to = 0.65), is_inside_level(ratio = 0.5), is_touched_level(ratio = 0.5), is_near_level(ratio = 0.5, distance = 0.5) |
| fvg | distance_bullish, distance_bearish (ATR to the nearest live gap, 0 inside) | is_inside_bullish, is_inside_bearish, is_touched_bullish, is_touched_bearish, is_near_bullish(distance = 0.5), is_near_bearish(...); is_filled_bullish, is_filled_bearish (events) |
| ob | distance_bullish, distance_bearish (ATR to the nearest live block, 0 inside) | is_inside_bullish, is_inside_bearish, is_touched_bullish, is_touched_bearish, is_near_bullish(distance = 0.5), is_near_bearish(...); is_broken_bullish, is_broken_bearish (events) |
| sr | support (top of the nearest support zone), resistance (bottom of the nearest resistance zone), support_distance, resistance_distance (in ATR, 0 inside) | is_at_support(min touches = 0, max touches = 0), is_at_resistance(...), is_inside_support(...), is_inside_resistance(...), is_near_support(distance = 0.5, min touches = 0, max touches = 0), is_near_resistance(...); is_break_up(...), is_break_down(...) (events) |
| sd | demand_distance, supply_distance (in ATR, 0 inside), demand_strength, supply_strength (0 to 5) | is_inside_demand(strength = 0), is_inside_supply(...), is_touched_demand(...), is_touched_supply(...), is_near_demand(distance = 0.5, strength = 0), is_near_supply(...); is_broken_demand, is_broken_supply (events) |
The trend methods and their numbers, all of which a rule can change. A flag with its brackets empty starts from the Trend entry's own numbers, which are these at the defaults:
| Flag | Numbers (defaults) |
|---|---|
| is_bullish_structure | swing bars (5) |
| is_bullish_ma_stack | fast EMA (20), middle EMA (50), slow EMA (200), rising bars (10) |
| is_bullish_donchian | period (20), bars back (10) |
| is_bullish_adx | period (14), level (25) |
| is_bullish_supertrend | ATR period (10), multiplier (3) |
| is_bullish_psar | step (0.02), maximum (0.2) |
| is_bullish_ichimoku | tenkan (9), kijun (26), senkou B (52) |
| is_bullish_vwap | anchor (0 day, 1 week, 2 month, 3 quarter, 4 year; 0) |
The bearish and sideways versions take the same numbers.
The price structure ids' own settings, in the order a rule writes them (H1.ob(3), H4.sr(10, 0.8)), with their defaults. Section 3 says what each does.
| Id | Settings (defaults) |
|---|---|
| swing | swing bars (5), zone band in ATR each side (0.25) |
| structure | swing bars (5) |
| trend | a switch per method for the vote, structure, MA stack, Donchian, ADX, Supertrend, Parabolic SAR, Ichimoku, VWAP (all 1, On), then every method's numbers in the order the flags table above lists them: structure swing bars (5); MA stack fast, middle, slow EMA and rising bars (20, 50, 200, 10); Donchian period and bars back (20, 10); ADX period and level (14, 25); Supertrend ATR period and multiplier (10, 3); Parabolic SAR step and maximum (0.02, 0.2); Ichimoku tenkan, kijun and senkou B (9, 26, 52); VWAP anchor (0 day). The methods that must agree are the vote flag's own number |
| fib | swing bars (5), zone band in ATR each side (0.25), new leg after, in ATR (3) |
| fvg | filled at (0 Full, 1 Half), smallest gap in ATR (0) |
| ob | swing bars (5), zone (0 Range, 1 Body), used up at (0 Touch, 1 Middle, 2 Close past; 2), needs a gap after (1), blocks (0 Origin, 1 All), needs a sweep (1), displacement in ATR (1), displacement bars (5) |
| sr | swing bars (10), zone width in ATR (1), zones kept (6), min height in ATR (0.5), lookback in bars (300), min touches (2), bars between tests (10), max touches (0, any) |
| sd | base candles at most (6), base body share of the range (0.5), leg-out body in ATR (0.7), departure in ATR (1), departure bars (5), tallest zone in ATR (1.5), used up at percent in (25) |
3. Price structure reference
Every value at a bar is what was known when that bar closed; nothing is drawn back into history. Zones are live from the bar after they form. ATR is 14 bars with Wilder's smoothing, on the name's own timeframe, and every distance is measured in it.
Every level is a zone. A single price, a swing or a fib level, spans 0.25 ATR on each side, with the ATR of the bar it becomes known on. Every zone kind reads its zones four ways: the close inside one, the bar touching one (its high or low reaching it), the close near one (the distance in ATR within a limit, 0 inside), and price breaking one (the zone ended on that bar by price). At most 50 zones of a kind are live at once; past that the oldest ends without counting as broken.
| What | Definition | Settings in rules |
|---|---|---|
| Swing | A swing high is at least as high as every one of the 5 bars before it and higher than every one of the 5 bars after it, so it is known 5 bars later (the standard pivot high and low). A bar can be both a swing high and a swing low. | 5 bars each side, zone 0.25 ATR |
| Swing label | Against the previous swing of the same side: higher high or lower high (an equal high counts as lower), lower low or higher low (an equal low counts as higher). | |
| Swing zone | The swing's price ± 0.25 ATR, formed when the swing is confirmed. A swing high's zone ends when a close goes above its top, a swing low's when a close goes under its bottom. | |
| Structure | A swing becomes the level to break when it is confirmed; a newer swing of the same side replaces it. A close above the swing high level breaks it: a change of character (CHoCH) when the trend was down, a break of structure (BOS) otherwise, and the trend becomes up. Downward mirrors it. A level breaks once. | 5 bars each side |
| Fib leg | The automatic Fibonacci retracement rule: a zigzag of the swings, where a swing of the other side starts a new leg only when it moved at least 3 × ATR(10) / close × 100 percent from the last point, and a swing of the same side that goes further moves the leg's end. The last two points known by a bar are its leg. | 5 bars, deviation 3 |
| Fib level | On a leg from start to end, the level at a ratio is end + (start - end) × ratio, so 0 is the leg's end and 1 its start, as the terminal's own Fibonacci tool labels them. Its zone is the level ± 0.25 ATR. The golden zone is 0.5 to 0.618, the golden pocket 0.618 to 0.65, the optimal trade entry (ICT) 0.62 to 0.79. | |
| Fair value gap | Bullish where a bar's low is above the high two bars before it and the middle candle closed above that high (LuxAlgo's smart money concepts): the zone from that high to that low. Bearish mirrors it. A gap is filled when a low goes under its bottom (Full) or its middle (Half). A low equal to the edge leaves it open. | filled at Full, no minimum height |
| Order block | ICT's order block: the last down-close candle before a displacement that took liquidity and broke structure. On an upward break of structure, the block is the last down-close candle at or before the lowest low since the last downward break. Its low must sweep a short-term low from the last 50 bars that nothing had traded under since. Within 5 bars a close runs 1 ATR over the block's top, and the move leaves a bullish fair value gap. The block forms on the first bar that knows all of that, and is used up (broken) when a close goes under its bottom. Bearish mirrors it. The sweep, the displacement, the gap, the break of structure, the origin of the move and the invalidation on a close past the block are ICT's. ICT gives no numbers, so these are ours: displacement of 1 ATR within 5 bars, a sweep of the last 50 bars, and a newer block replacing an older one it overlaps by half. | 5 bars, full candle range, used up on a close past it, sweep and gap required, displacement 1 ATR within 5 bars |
| Support and resistance | Clusters of swings (10 bars each side) from the last 300 bars. Each swing seeds a zone with the swings nearest its price that keep it at most 1 ATR tall, padded to at least 0.5 ATR; a zone needs at least 2 swings, its touches. Its strength is 2 per swing plus 1 per rejection, a bar reaching into it and closing back out on the side it came from, at least 10 bars after the last one. The strongest zone is kept, the ones overlapping it dropped, and so on, up to 6. A zone under the close is support, one over it resistance, so a broken resistance acts as support. Each zone remembers the side of the last close outside it. A break up is a close over its top when that side was under its bottom, a break down the mirror (AlgoAlpha's Support and Resistance Retest Breakout Signals). A close that leaves a zone upward after entering it from above is a bounce, not a break. | 10 bars, 1 ATR, 2 touches, 300 bars |
| Supply and demand | Seiden's base and leg out. The move into the base must oppose the move out of it: the candle before the base closes down for demand (drop, base, rally) and up for supply (rally, base, drop). Seiden does not count a drop, base, drop as supply, because those sit in the middle of moves and typically do not work well. A base is 1 to 6 candles, each with a body at most half its range or at most 0.5 ATR. The leg-out candle has a body of at least 0.7 ATR or gaps past the base, and within 5 bars a close runs 1 ATR past the base. Demand runs from the lowest low of the base and the leg-out candle to the base's highest body top; a zone taller than 1.5 ATR is dropped. Strength 0 to 5: 2 for a departure of 3 ATR or a gap (1 otherwise), 1 for a base of at most 3 candles, and freshness, 2 untested, 1 after the first visit, 0 after the second. Used up when price goes 25 percent into it (Seiden's own limit for taking another trade at a level) or a close goes past its far edge. Supply mirrors it. | as written |
S/R touches. Every sr flag reads only zones with that many touches; 0 means the defaults, at least 2 and no upper limit. H1.sr.is_inside_support(3) is a support zone of at least 3 touches, H1.sr.is_inside_support(2, 2) one of exactly 2.
Supply and demand strength. Every sd flag that takes a strength reads only zones at least that strong: H4.sd.is_inside_demand(4) is a fresh, strong zone.
The trend methods. Each reads bullish, bearish or neither on every bar, and is unknown while its indicators warm up.
| Method | Bullish when (bearish mirrors it; neither is sideways) |
|---|---|
| structure | the structure above is up |
| ma_stack | EMA 20 over EMA 50 over EMA 200, and the EMA 200 higher than 10 bars ago |
| donchian | both 20-bar bands higher than 10 bars ago |
| adx | ADX 14 over 25 and +DI over -DI |
| supertrend | Supertrend (10, 3), TradingView's built-in numbers, is in its up trend |
| psar | the Parabolic SAR (0.02, 0.2), Wilder's numbers, is under price |
| ichimoku | the close over the cloud and Tenkan over Kijun (9, 26, 52) |
| vwap | the close over the VWAP of its anchor, the day by default |
The vote. is_bullish(K) holds where at least K methods read bullish and more read bullish than bearish. is_bearish(K) is the other way round, and is_sideways(K) holds where neither does. K is 4 by default. The vote is unknown while any method is unknown.
Which to trust. The vote needs several methods to agree, so it turns later than any one of them. The methods differ in what they look at. MA stack reads the EMA 200 and its slope over 10 bars, Donchian the 20-bar range against 10 bars ago, so both need a long move to turn. ADX needs strength as well as direction, so a slow drift reads sideways. Supertrend and Parabolic SAR follow price closely and turn on the first strong move against them. Ichimoku needs the close past the whole cloud. VWAP reads the current day, unless you set another anchor. Structure turns when a close breaks the last swing.
4. Examples
Each example is a whole rule, ready for a signal file. Chart. follows the chart's timeframe; write H4. or D1. to fix one.
A pullback in an uptrend:
# RSI oversold while the daily close is above the daily EMA 200.
marker: bullish

H4.rsi.is_oversold(35)
and D1.ema200.is_above
A faster RSI at the lower band of wider Bollinger Bands, with each indicator's own settings:
H1.rsi(7).is_oversold(20)
and H1.bb(20, 2.5).is_below_lower
A slower trend filter and a faster MACD:
D1.ema(100).is_above
and within_bars(H4.macd(8, 21, 5).is_cross_up, 3)
A MACD cross under zero with a trend in the last 3 bars:
Chart.macd.is_cross_up
and within_bars(Chart.adx.is_trending(25), 3)
and Chart.macd.line < 0
Divergence on two of three oscillators:
at_least_true(2,
    within_bars(Chart.rsi.is_bull_div, 5),
    within_bars(Chart.macd.is_bull_div, 5),
    within_bars(Chart.stoch.is_bull_div(3, 40), 5)
)
A squeeze and its break on volume:
within_bars(Chart.bb.is_squeeze(125), 10)
and Chart.bb.is_break_up
and Chart.volume.is_spike(1.5)
RSI in a band and rising:
in_range(H1.rsi.value, 40, 60)
and H1.rsi.value > bars_ago(H1.rsi.value, 3)
Two moving averages crossing on another timeframe:
cross_above(H4.ema50.value, H4.ema200.value)
Price close to an average, measured in ATR, in a bullish trend:
abs(H1.price.value - H1.ema50.value) / H1.atr.value < 0.3
and D1.trend.is_bullish
All four Quad Stoch lines low on H4 while the daily lines are not all low:
H4.quad_stoch.all < 20
and D1.quad_stoch.any > 50
A fair value gap pullback in a strong trend:
# The close inside a bullish gap while 5 of 8 trend methods are bullish.
marker: bullish

Chart.fvg.is_inside_bullish
and Chart.trend.is_bullish(5)
An order block retest after a break of structure:
within_bars(Chart.structure.is_bos_up, 20)
and Chart.ob.is_touched_bullish
Near a support zone of 3 touches or more, with RSI low:
H1.sr.is_near_support(0.5, 3)
and H1.rsi.value < 40
The golden pocket after a new swing high:
within_bars(H4.swing.is_new_high, 20)
and H4.fib.is_golden_pocket
and H4.structure.is_up
A strong demand zone with the stochastic turning up:
H4.sd.is_inside_demand(4)
and within_bars(H4.stoch.is_cross_up, 2)
A bearish setup, a rally into resistance after a change of character down:
marker: bearish

within_bars(H1.structure.is_choch_down, 30)
and H1.sr.is_inside_resistance
and not H1.trend.is_bullish
A trend vote of your own, three methods with your own numbers:
at_least_true(2,
    H4.trend.is_bullish_ma_stack(10, 30, 100, 5),
    H4.trend.is_bullish_adx(14, 20),
    H4.trend.is_bullish_supertrend(10, 2)
)
and H1.rsi.is_oversold(40)
A rule that does not compile shows the reason and where it is in the editor. The usual causes: a name with two parts instead of three (H4.rsi for H4.rsi.value), an uppercase field or a lowercase timeframe (h4.RSI.value), a number alone as the whole rule, a comparison after not without brackets, or a marker: line after the rule has started.
Installing, the panel, alerts, signal files and the Strategy Tester are in the user guide. For questions or problems, write in the Comments tab of the product page or send me a private message on MQL5.