

A win rate is the first number anyone reads on a signal page, and the one that moves the least. The number that tells you whether a win rate is enough moves more, and it is not printed anywhere. You work it out, and then you work it out again.
The check
Under Statistics, every MQL5 signal page shows Average Profit and Average Loss. Put them into one line:
break-even win rate = average loss ÷ (average win + average loss)
That is the share of trades an account must win just to stand still. The real win rate minus that number is the room the edge has. A system that wins 70% but needs 68% has two points of room, however good 70% sounds.
Three readings of one account
We run this on our own flagship, Techno Long Term, and publish the result. Three readings of the same statistics tab:
28 September, 4 659 trades: won 69.54%, average win 3.25 EUR, average loss 5.65 EUR. Needed 63.48%. Gap about 6.1 points.
4 November, 4 826 trades: won 69.35%, average win 3.32 EUR, average loss 6.18 EUR. Needed 65.05%. Gap 4.3.
11 November, this morning, 4 864 trades: won 69.36%, average win 3.37 EUR, average loss 6.27 EUR. Needed 65.04%. Gap 4.3.
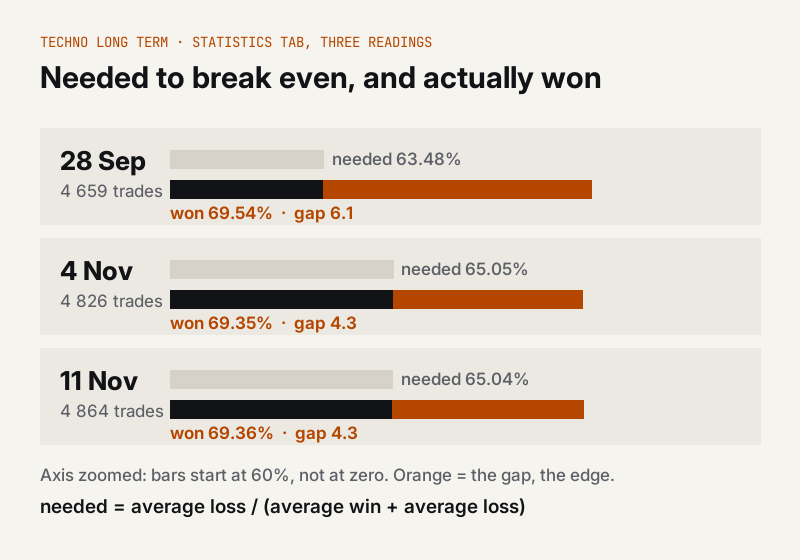
The win rate hardly moved across all three. The break-even rate rose by a point and a half between the first two readings, because a run of larger losses pulled the average loss up, and then it held this week. So the room shrank by more than a quarter between the first two readings and has not shrunk since.
What to do with it
Run it once a month on any signal you copy or any robot you rent, and write the result down with the date. One reading tells you the room. Two readings tell you the direction.
A gap that holds is good news even when the month was red. A gap that narrows month after month while the win rate stays put is the early sign: the losses are getting bigger, and no headline number will show it until the curve does.
The flagship's statistics tab, free to read, the bad months included: https://www.mql5.com/en/signals/2307342