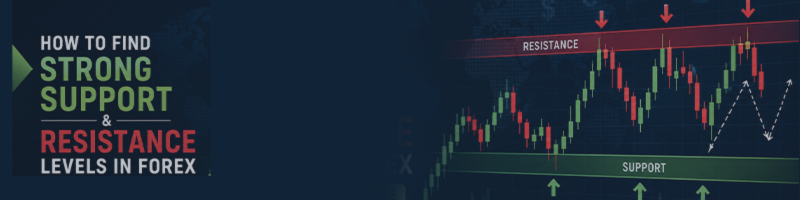
How to Find Strong Support and Resistance Levels in Forex: A Practical Trading Guide

How to Find Strong Support and Resistance Levels in Forex:
A Practical Trading Guide
Support and resistance are among the most important concepts in Forex technical analysis. Traders use these levels to identify potential market reversals, plan entry and exit points, and manage trading risk. However, not every price level deserves attention. Some zones generate strong reactions, while others are easily broken by market momentum.
Learning how to identify high-probability support and resistance levels can help traders build a more structured trading strategy. Instead of drawing multiple random lines on a chart, the goal is to recognize important price zones supported by market structure, previous reactions, and technical confirmation.
In this guide, we will explore how support and resistance work, how to identify stronger levels, and how to use them in practical Forex trading.
What Are Support and Resistance Levels in Forex Trading?
Support and resistance represent price areas where buying or selling pressure has previously influenced market direction.
What Is a Support Level?
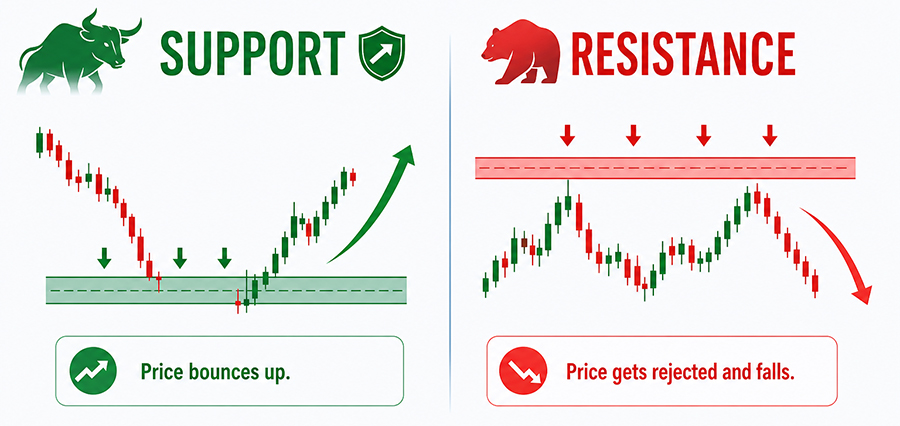
Support is an area where a falling market may slow down or reverse because buying pressure becomes stronger than selling pressure.
When price approaches a previous support zone, traders watch for signs of buying activity, bullish price action, or a potential reversal.
For example, if EURUSD repeatedly falls toward a particular price area and then moves higher, that zone may represent an important support level.
However, support does not guarantee a bullish reversal. Strong selling pressure can push price below the zone and create a bearish breakout.
What Is a Resistance Level?
Resistance is an area where an upward price movement may slow down or reverse because selling pressure becomes stronger.
When price approaches a previous resistance zone, traders look for bearish rejection, weakening momentum, or other signs that buyers may be losing control.
For example, if XAUUSD repeatedly fails to move above a specific price area, traders may consider it a significant resistance zone.
A strong bullish breakout, however, can invalidate that resistance and open the way for further upside movement.
How to Identify Strong Support and Resistance Levels
Not all levels have the same importance. Professional traders generally focus on zones supported by several technical factors rather than relying on a single price reaction.
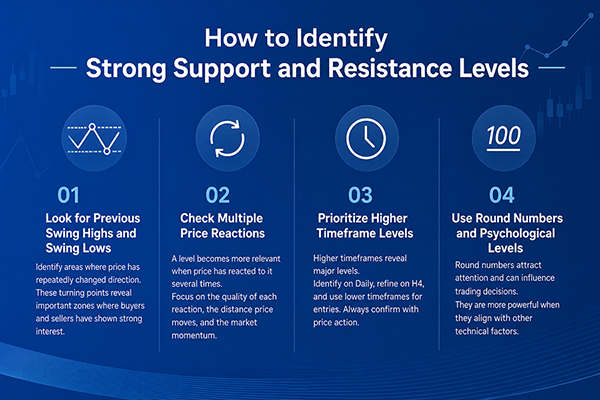
1. Look for Previous Swing Highs and Swing Lows
Previous swing highs and lows are among the most useful areas for identifying support and resistance.
A swing high forms when price reaches a local peak before moving lower. A swing low forms when price reaches a local bottom before moving higher.
Look for areas where the market has repeatedly changed direction. These turning points can reveal important zones where buyers and sellers have previously shown strong interest.
Avoid marking every small movement. Focus on clear market reactions that are visible without excessive chart analysis.
2. Check Multiple Price Reactions
A support or resistance zone becomes more relevant when price has reacted to it several times.
For example, if EURUSD approaches the same resistance area on three separate occasions and fails to break above it, traders may consider that zone important.
However, the number of touches alone does not determine a level's strength. Pay attention to the quality of each reaction, the distance price moves away from the zone, and whether the market shows signs of weakening momentum.
Repeated tests with increasingly weak reactions may also indicate that a breakout is becoming more likely.
3. Prioritize Higher Timeframe Levels
Higher timeframe analysis helps traders distinguish major market levels from short-term price noise.
Daily and H4 charts often reveal important support and resistance zones that may not be visible on M5 or M15 charts.
A practical approach is to:
-
Identify major levels on the Daily chart.
-
Refine important zones on the H4 chart.
-
Use H1 or M15 to search for potential entry opportunities.
-
Confirm the setup with price action before entering.
For scalpers, lower timeframes are useful for execution, but ignoring major higher timeframe levels can expose trades to unexpected reversals.
4. Use Round Numbers and Psychological Levels
Round numbers can attract attention because many traders monitor prices ending in familiar values.
For example, levels such as 1.1000 on EURUSD or 2500.00 on XAUUSD may become important psychological reference points.
These prices can influence trading decisions and may coincide with existing technical support or resistance.
Round numbers should not be treated as automatic entry signals. They become more useful when they align with previous swing highs, swing lows, or other technical factors.
Technical Tools That Can Improve Support and Resistance Analysis
Combining different technical methods can help traders identify stronger trading zones.
Fibonacci Retracement Levels
Fibonacci retracement is commonly used to identify potential pullback areas during trending markets.
The 38.2%, 50%, and 61.8% levels are frequently monitored by traders.
When a Fibonacci level overlaps with a previous support or resistance zone, it creates a technical confluence area worth watching.
For example, during an uptrend, a pullback toward the 61.8% retracement may become more interesting if the same area also contains previous support.
Moving Averages
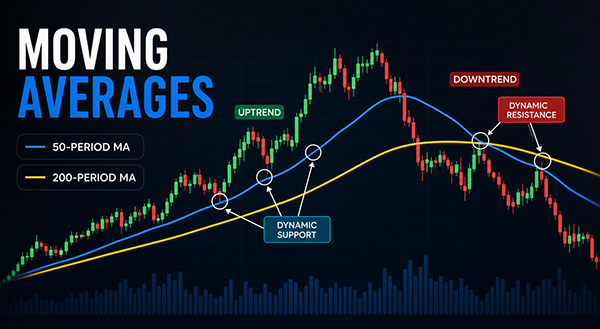
Moving averages can act as dynamic support and resistance because their values change with market price.
The 50-period and 200-period Moving Averages are widely monitored for identifying broader market direction.
During an uptrend, price may repeatedly pull back toward a Moving Average before continuing higher. In a downtrend, the same indicator may act as dynamic resistance.
Moving Averages are most useful when they support an existing market structure rather than being used as standalone trading signals.
Trendlines and Price Channels
Trendlines connect important swing highs or swing lows and help traders visualize the direction of the market.
An upward trendline may act as dynamic support, while a downward trendline may act as dynamic resistance.
When a trendline intersects with a horizontal support or resistance zone, traders can monitor that area for a possible reaction or breakout.
How to Trade Support and Resistance Levels
Identifying a strong zone is only the first step. Traders also need a clear entry strategy and predefined risk management rules.
1. Trading Reversals at Support and Resistance
A reversal strategy involves waiting for price to approach an important zone and show evidence of rejection.
At support, traders may look for bullish engulfing candles, pin bars, or other bullish price action patterns.
At resistance, bearish rejection candles or weakening upward momentum may provide confirmation.
Entering immediately when price touches a level can be risky. Waiting for confirmation helps reduce the chance of trading against strong market momentum.
2. Trading Breakouts
A breakout occurs when price moves decisively beyond an established support or resistance zone.
A bullish breakout above resistance may indicate increasing buying pressure, while a bearish breakout below support may signal stronger selling activity.
Traders should avoid treating every temporary move beyond a level as a valid breakout. A candle close beyond the zone and confirmation from subsequent price action can help evaluate the move.
3. Trading Breakouts and Retests
After breaking resistance, price may return to test the same area from above. The former resistance can then act as support.
Similarly, broken support may become resistance when price moves back toward it from below.
This behavior is known as role reversal.
Waiting for a retest can provide a more structured entry opportunity, although not every breakout produces a retest.
Common Support and Resistance Trading Mistakes
Even experienced traders can make mistakes when analyzing important price levels.
Avoid these common problems:
-
Drawing too many levels: Too many lines make charts difficult to read. Focus on the most significant zones.
-
Treating levels as exact prices: Support and resistance should generally be viewed as zones rather than perfectly precise lines.
-
Ignoring higher timeframes: A short-term setup may fail when it conflicts with a major Daily or H4 level.
-
Entering without confirmation: A price touch alone does not guarantee a reversal.
-
Ignoring risk management: Every setup needs a predefined stop loss and position size.
-
Assuming every breakout is valid: False breakouts are common, particularly during volatile market conditions.
A clean chart and consistent trading rules are usually more useful than complicated analysis.

How to Improve Your Support and Resistance Trading Strategy
A reliable approach starts with a repeatable analysis process.
First, identify the broader market trend and mark the most important support and resistance zones on higher timeframes. Next, look for areas where multiple technical factors overlap, such as Fibonacci retracements, Moving Averages, or previous swing points.
When price approaches one of these zones, wait for a predefined confirmation signal. Before entering, calculate your stop loss, take profit, and position size based on your risk tolerance.
Keep a trading journal and record the levels you trade, the confirmation signals, market conditions, and final results. Reviewing this information can help you understand which setups perform consistently and which need improvement.
Recommended Tool for Trade Management
Advanced Position Management is designed to help traders manage open positions more systematically. Its features include partial closing at customizable profit levels and hidden stop-loss management, allowing traders to manage exits according to predefined rules.
It can complement a support and resistance strategy by helping manage positions around planned profit targets. However, it does not replace proper market analysis or independent risk management.
Conclusion
Finding high-probability support and resistance levels requires more than drawing horizontal lines on a Forex chart. Traders should consider previous price reactions, swing highs and lows, higher timeframe structure, psychological levels, and technical confluence.
The most effective approach is to keep the analysis simple, wait for price action confirmation, and define risk before entering a trade.
Remember that no support or resistance zone is guaranteed to hold. Consistent execution, disciplined risk management, and systematic evaluation are essential for building a more reliable trading strategy.