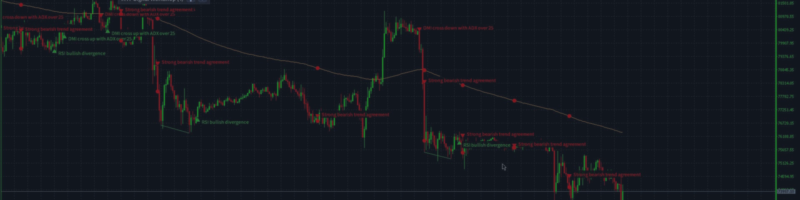

Multi Timeframe Signal Workshop watches signals you build from indicators on any timeframe and marks every bar where one fires. You build a signal by clicks from conditions such as "H4 RSI oversold" and "price above the daily EMA 200", write it as text in a file, or load one of 36 ready-made signals. Each firing is an arrow on the chart, drawn with the zones, lines and indicator values the signal read, and a new firing can alert you through the Alert window, a sound, a push notification or an email. It places no orders.
Video tutorial: https://youtu.be/ZDXKUbAn4cI
The video tutorial shows sections 2 to 9 below on a live chart, in the same order. The rule language itself, with every name a rule can read, every number it takes, what each one means and where its definition comes from, has its own post: Multi Timeframe Signal Workshop: rule language and indicator reference.
Contents
- Install and attach
- What a firing shows
- The ready-made signals
- Build a signal
- Groups
- Price structure
- Alerts and settings
- Signal files: save, write, load and share
- The rule language
- The settings file
- Inputs
- The Strategy Tester
- Limits and MT4 differences
- Troubleshooting
1. Install and attach
Install the indicator from the Market in MetaTrader itself (the Market tab of the Toolbox), and it goes into the terminal's Indicators directory. Drag MTF Signal Workshop from the Navigator onto a chart. The panel opens at the top left with a title bar, MTF Signal Workshop (0), and under it + Signal, Settings and Help. The title bar's buttons fold the panel and pick it up to move it; the position and the folded state are kept per chart.
2. What a firing shows
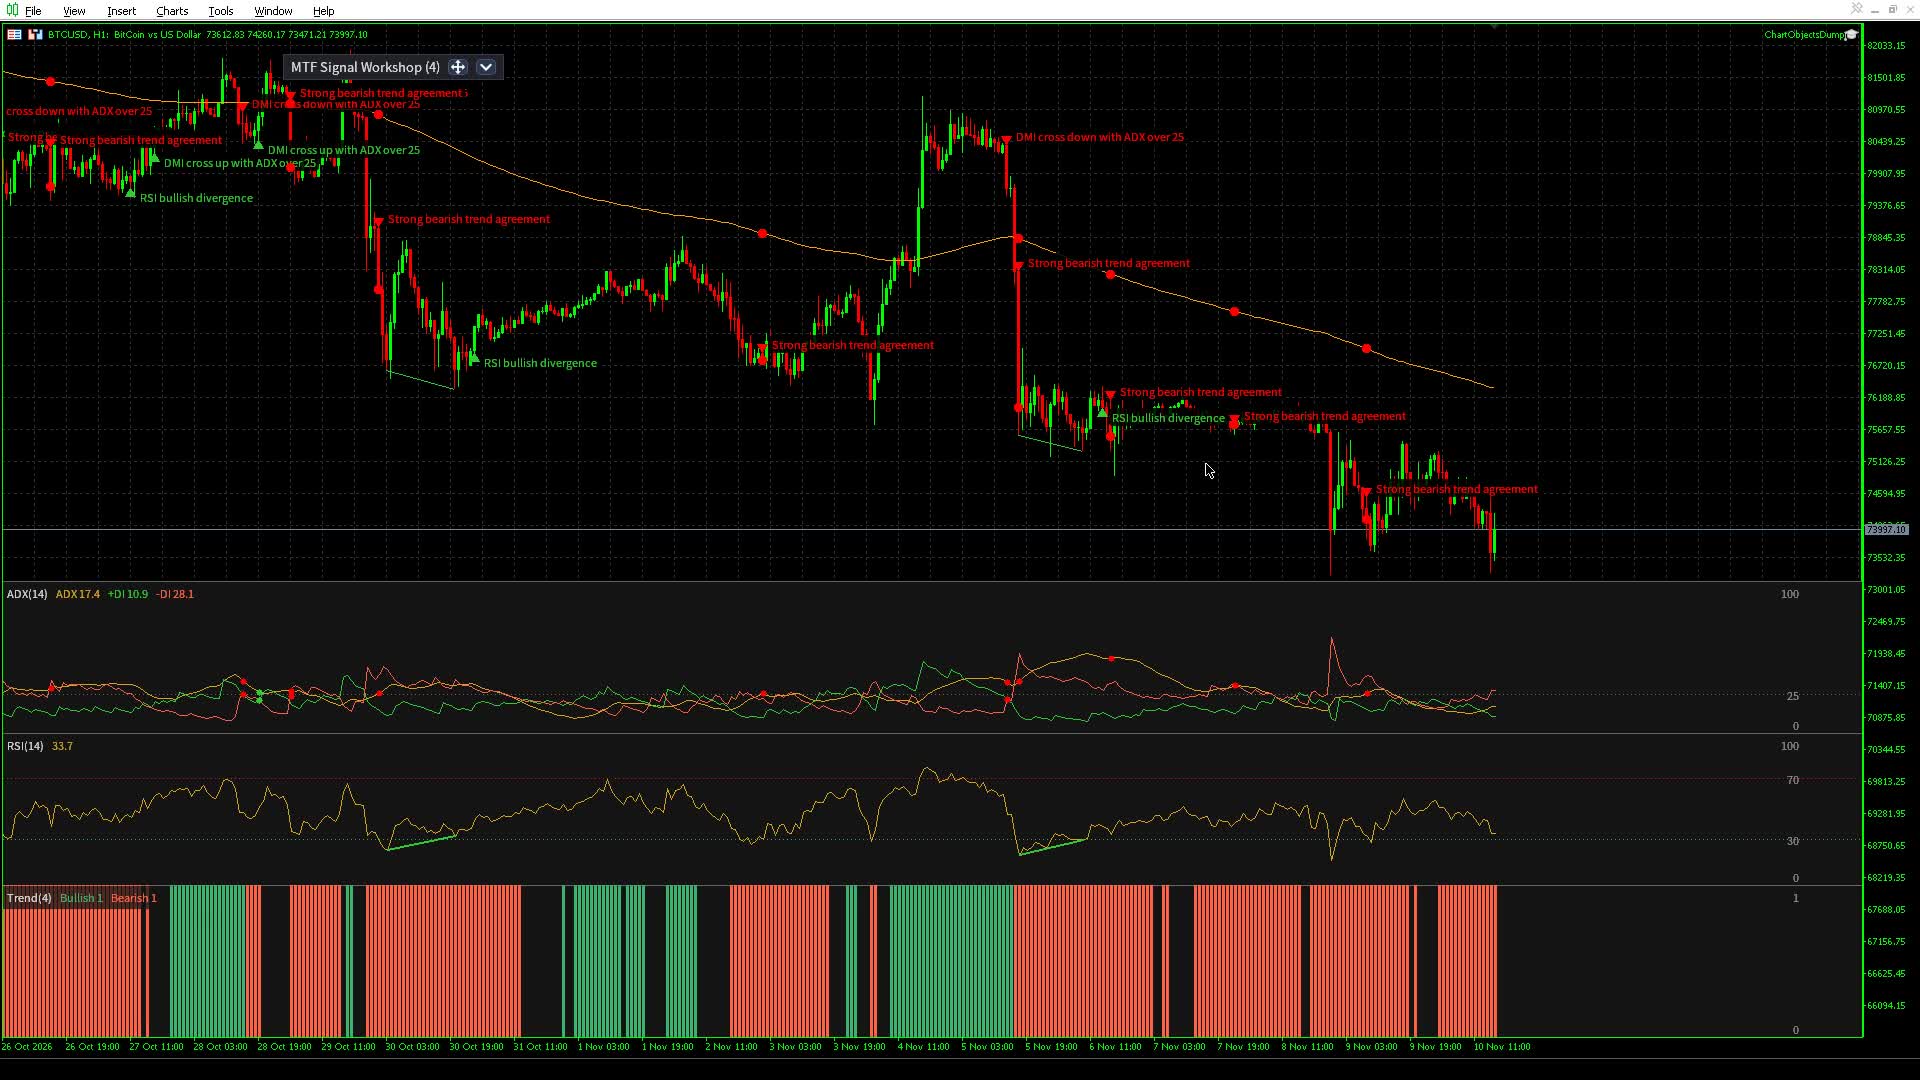
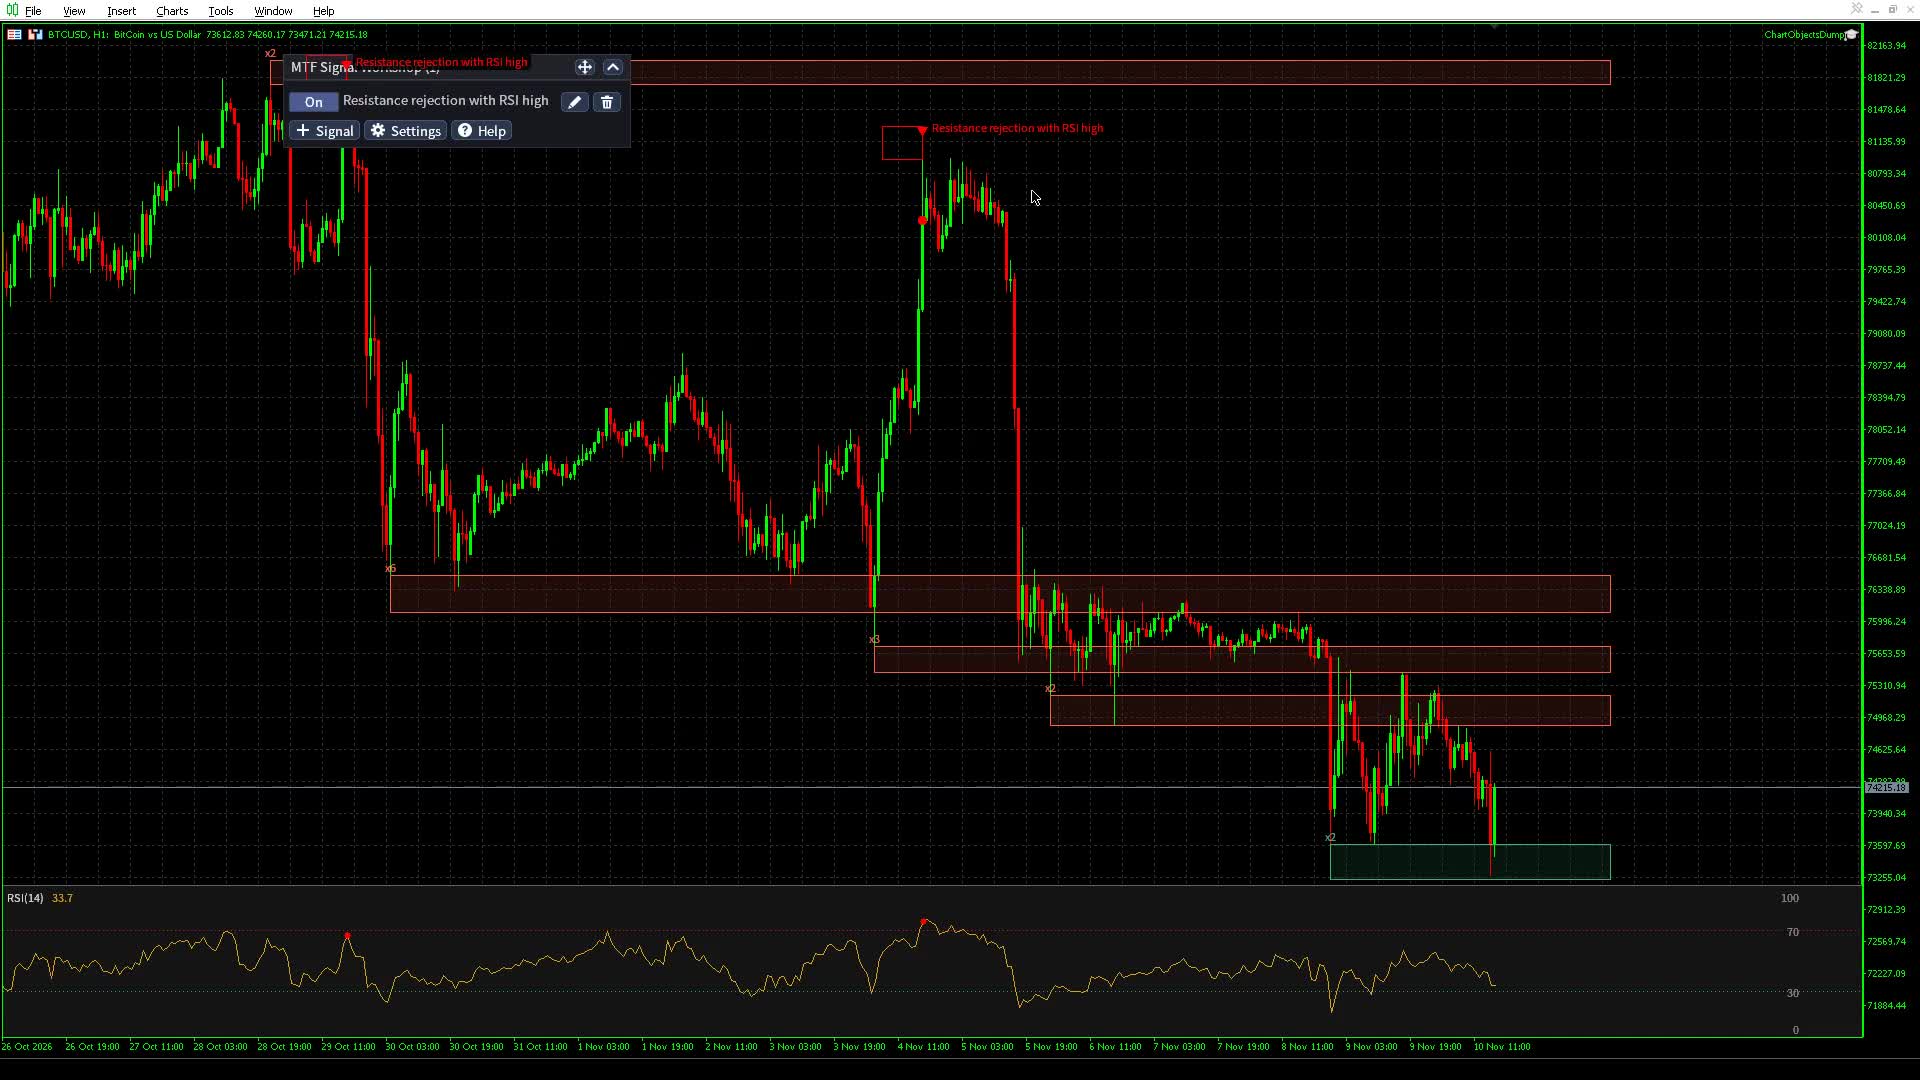
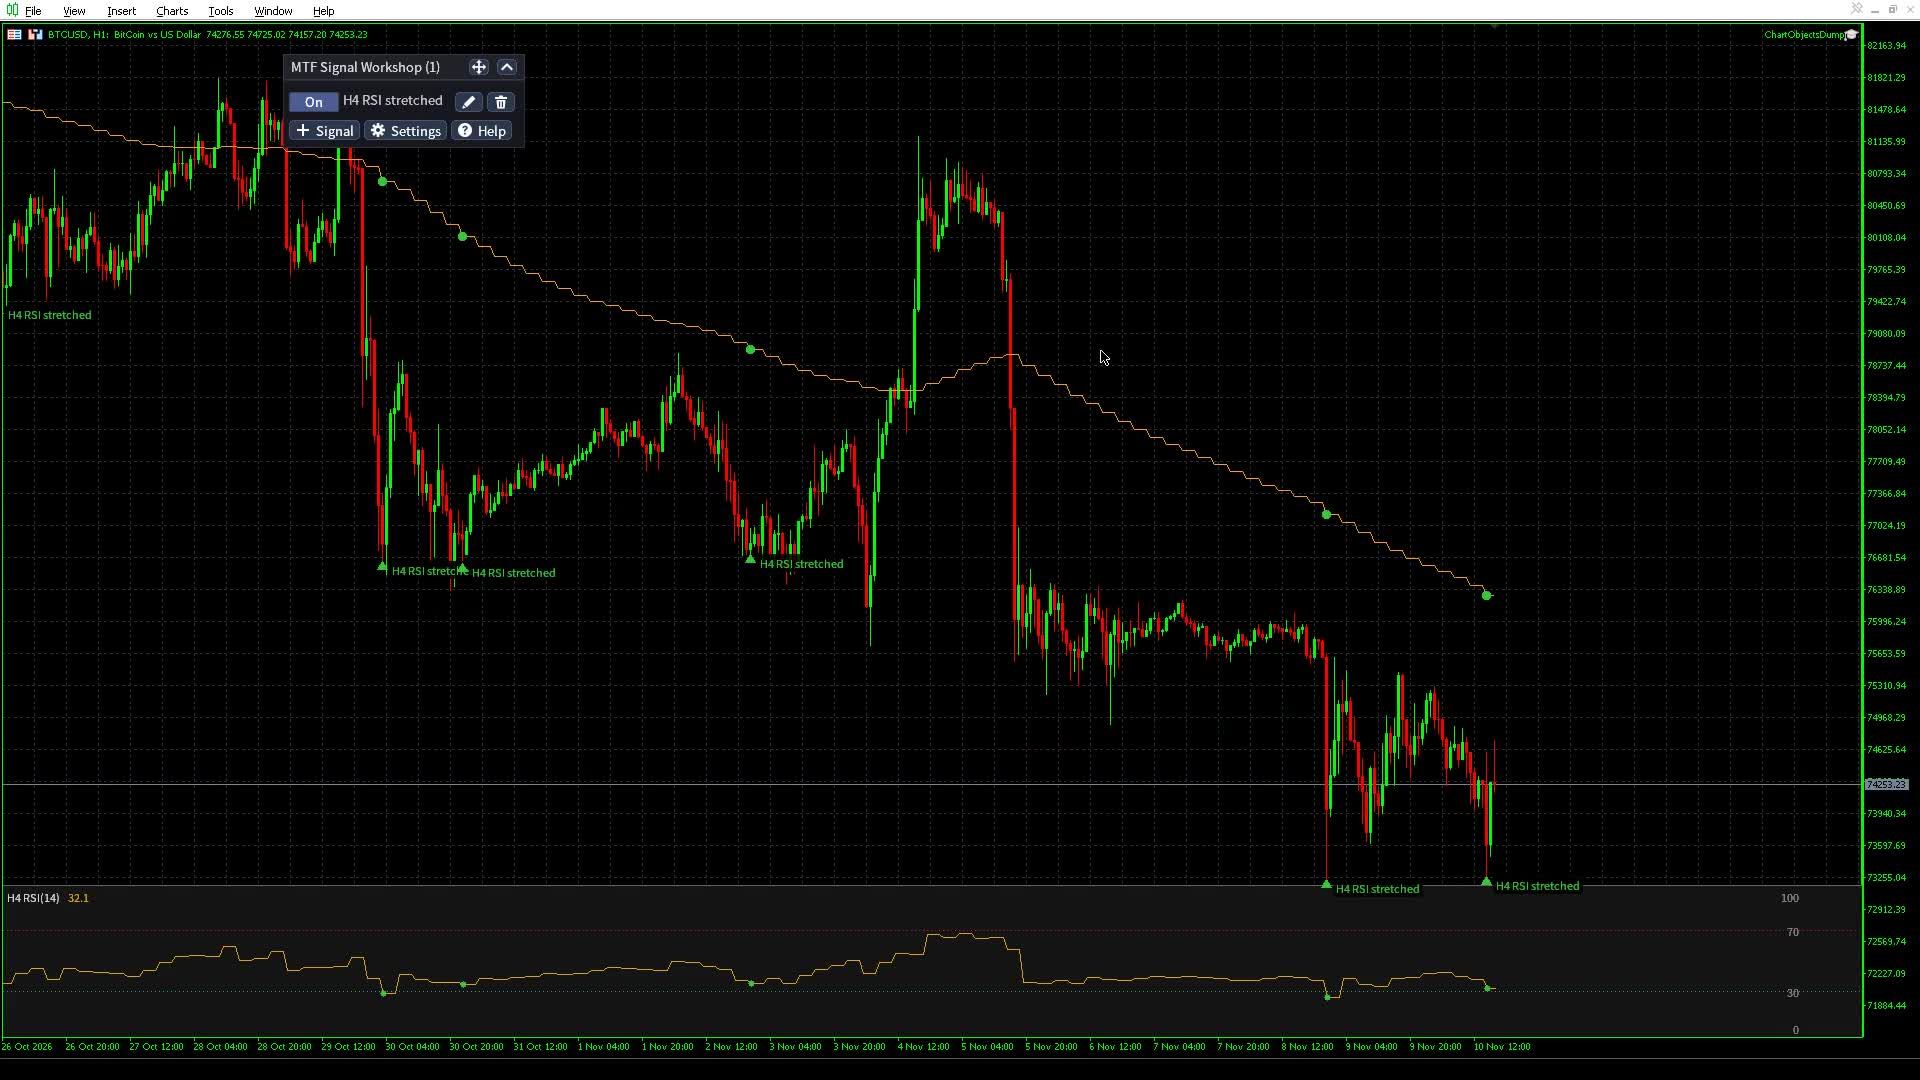
Every firing is an arrow on its bar: up under the low for a bullish signal, down over the high for a bearish one. Every firing carries the signal's name beside it on a box of the chart's background; where names of nearby firings meet, the newer one covers the older. Every arrow's tooltip lists the signal's name and the conditions that held.
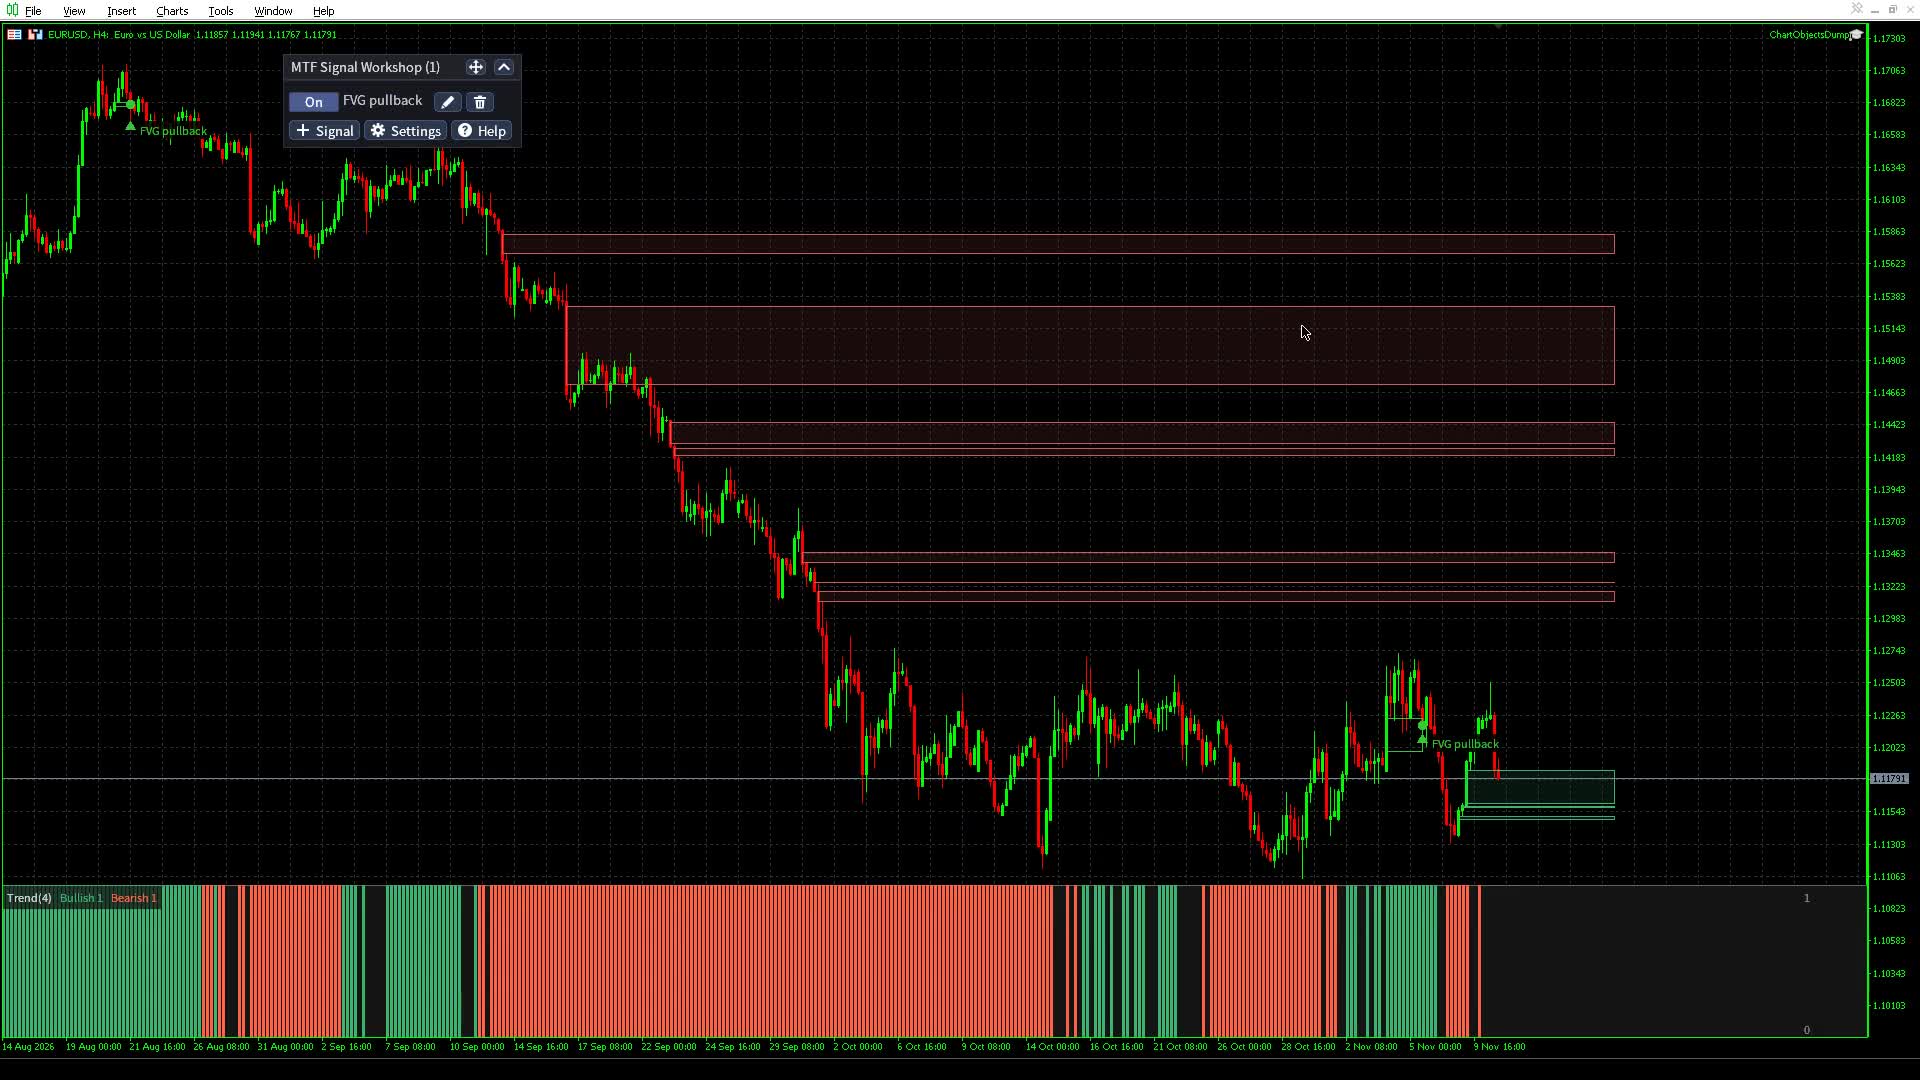
What the signal read is drawn with the firing. A cross of two lines over the candles is a dot where they crossed. A divergence is a line between the two price pivots, and another between the indicator's pivots in its dock. A zone a condition read, such as an order block, a fair value gap or a support zone, is drawn as the box it was. The indicators the signals name are drawn too: averages and bands over the candles, oscillators and the trend strip in docks under them. Each dock takes 15 percent of the chart's height, all of them together at most half. Nothing else needs to be installed.
3. The ready-made signals
The first time it runs on a computer, the indicator writes 36 ready-made signals as files you can use, change, copy or delete. Most come in bullish and bearish pairs:
| Group | Signals |
|---|---|
| Oscillators and bands | RSI dip in uptrend, DMI cross up and down with ADX over 25, Bollinger squeeze breakout, Quad stoch all oversold and all overbought |
| Trend | Higher low in bullish trend, Lower high in bearish trend, Strong bullish trend agreement and bearish, Supertrend flip up with structure and down, Squeeze breakout with bullish structure, Squeeze breakdown with bearish structure |
| Levels and zones | Support bounce with RSI low, Resistance rejection with RSI high, Broken resistance retested as support, Broken support retested as resistance, Strong demand with RSI oversold, Strong supply with RSI overbought, Demand zone with stochastic cross up, Supply zone with stochastic cross down, Demand zone on low volume, Supply zone on low volume |
| Fib | Golden pocket pullback in uptrend, Golden pocket rally in downtrend, Optimal trade entry after bullish break and after bearish break |
| Smart money concepts | Order block retest in uptrend and in downtrend, Fair value gap pullback in uptrend and in downtrend, Break of structure with bullish trend and with bearish trend, Change of character with bullish divergence and with bearish divergence |
"In uptrend" and "in downtrend" use the two trend filters most traders use. The smart money and level signals want the swing structure up, read on 15-bar swings with Chart.structure(15).is_up, and the close above the 200 EMA. The structure on the default 5-bar swings is internal structure: it turns on every small swing, so on its own it would call a falling market up after one minor lower high breaks. RSI dip in uptrend is Larry Connors' RSI(2) pullback: the 2-period RSI under 5 with the close above the 200 SMA (Connors and Alvarez, Short Term Trading Strategies That Work). The downtrend signals mirror the smart money and level ones.
Each signal follows a published setup, and the comment at the top of its file names the source. The DMI crosses are Wilder's directional movement system: +DI crosses -DI while ADX is over 25. The Quad stoch signals are stage 1 of John Kurisko's setup, all four stochastics under 20 or over 80. Order blocks, fair value gaps, breaks of structure, the golden pocket and the optimal trade entry are ICT's, and the squeeze is Bollinger's BandWidth low. The golden pocket and optimal trade entry signals also read the direction of the last leg (Chart.fib.end > Chart.fib.start for the bullish ones), so a bounce inside a down leg never fires a bullish signal. Support bounce and resistance rejection need the bar to reach the zone and the close to end back outside it. The supply and demand signals are Sam Seiden's: the stochastic crosses in oversold or overbought territory, and he looks for lower volume at a turn, so the volume signals fire on a bar under the 20-bar average. The strict order block retest in an uptrend is rare: on 4500 real H1 and H4 bars a bullish order block was touched 27 times, and only once in an uptrend. Signals named "with bullish trend" or "bearish trend", and the higher low, lower high and trend agreement signals, read the trend vote of section 6 and also want the close on the right side of the 200 EMA: the vote's fast methods (Supertrend, Parabolic SAR, Donchian, internal structure) turn on any bounce, so the vote alone calls a rally inside a downtrend bullish.
Each reads the chart's own timeframe, so it works on any chart. Each file opens with a comment that says what the signal looks for, and the rule under it is written in the language of section 9, so every ready-made signal is also an example to read and copy. To put one on the chart, click + Signal, open Load from file and pick it. Typing filters the list: "resist" leaves Broken resistance retested as support and Resistance rejection with RSI high. The chart in the video is falling, so I pick the rejection.
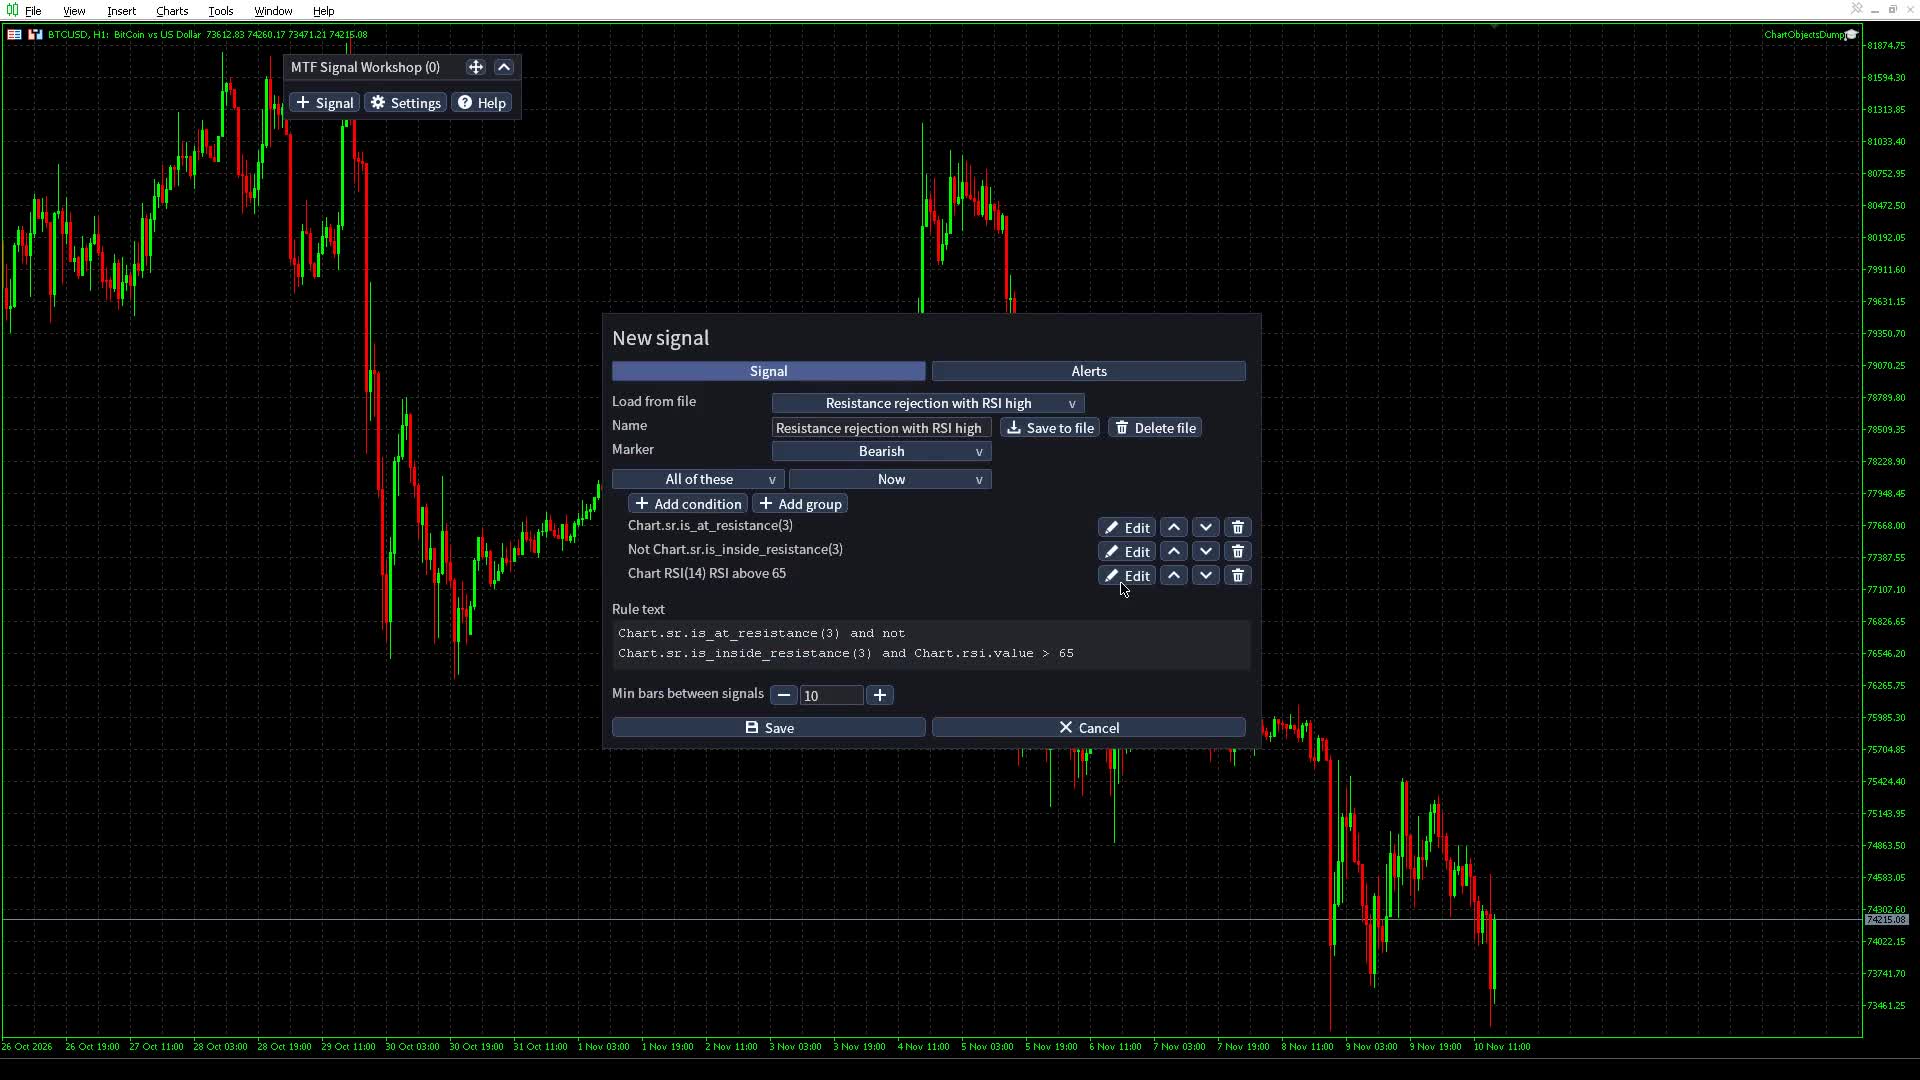
The name, the marker and the rule fill in. Save puts the signal on the chart and its firings appear.
A ready-made signal is written once. One you edit is never written over, one you delete stays deleted, and a signal a later version adds is written on its next start.
4. Build a signal
+ Signal opens New signal. Give it a name, pick its Marker (a bullish or a bearish arrow), and click + Add condition. The condition editor has:
- Timeframe: Chart, which follows the timeframe of the chart the signal runs on, or a fixed one from M1 to MN1.
- Indicator: grouped under Price, Moving averages, Bands and channels, Trend, Smart money concepts, Levels and zones, Oscillators, Volatility and Volume. Typing a name or a group's name filters the list.
- The indicator's settings: right under it, a field, choice or switch for each of its settings (an RSI's period, the Bollinger Bands' period and deviations), at their defaults to start. Change one and the condition reads that indicator: Reads says RSI(21), and the rule text writes Chart.rsi(21).
- What: one of the indicator's flags (Oversold, a cross, a divergence, Price above, inside a zone) with a field for each number it takes, or one of its lines. A line takes Is (Above, Below, At or above, At or below, Crosses above, Crosses below) and Than: a number or another line of the same indicator, times a factor.
- Must: be true or be false.
- When: Now, In the last N bars, N bars ago, or Between N and M bars ago.
Reads, at the bottom, says the condition in words. The first condition starts on RSI's Oversold; the next ones start on the indicator used last.
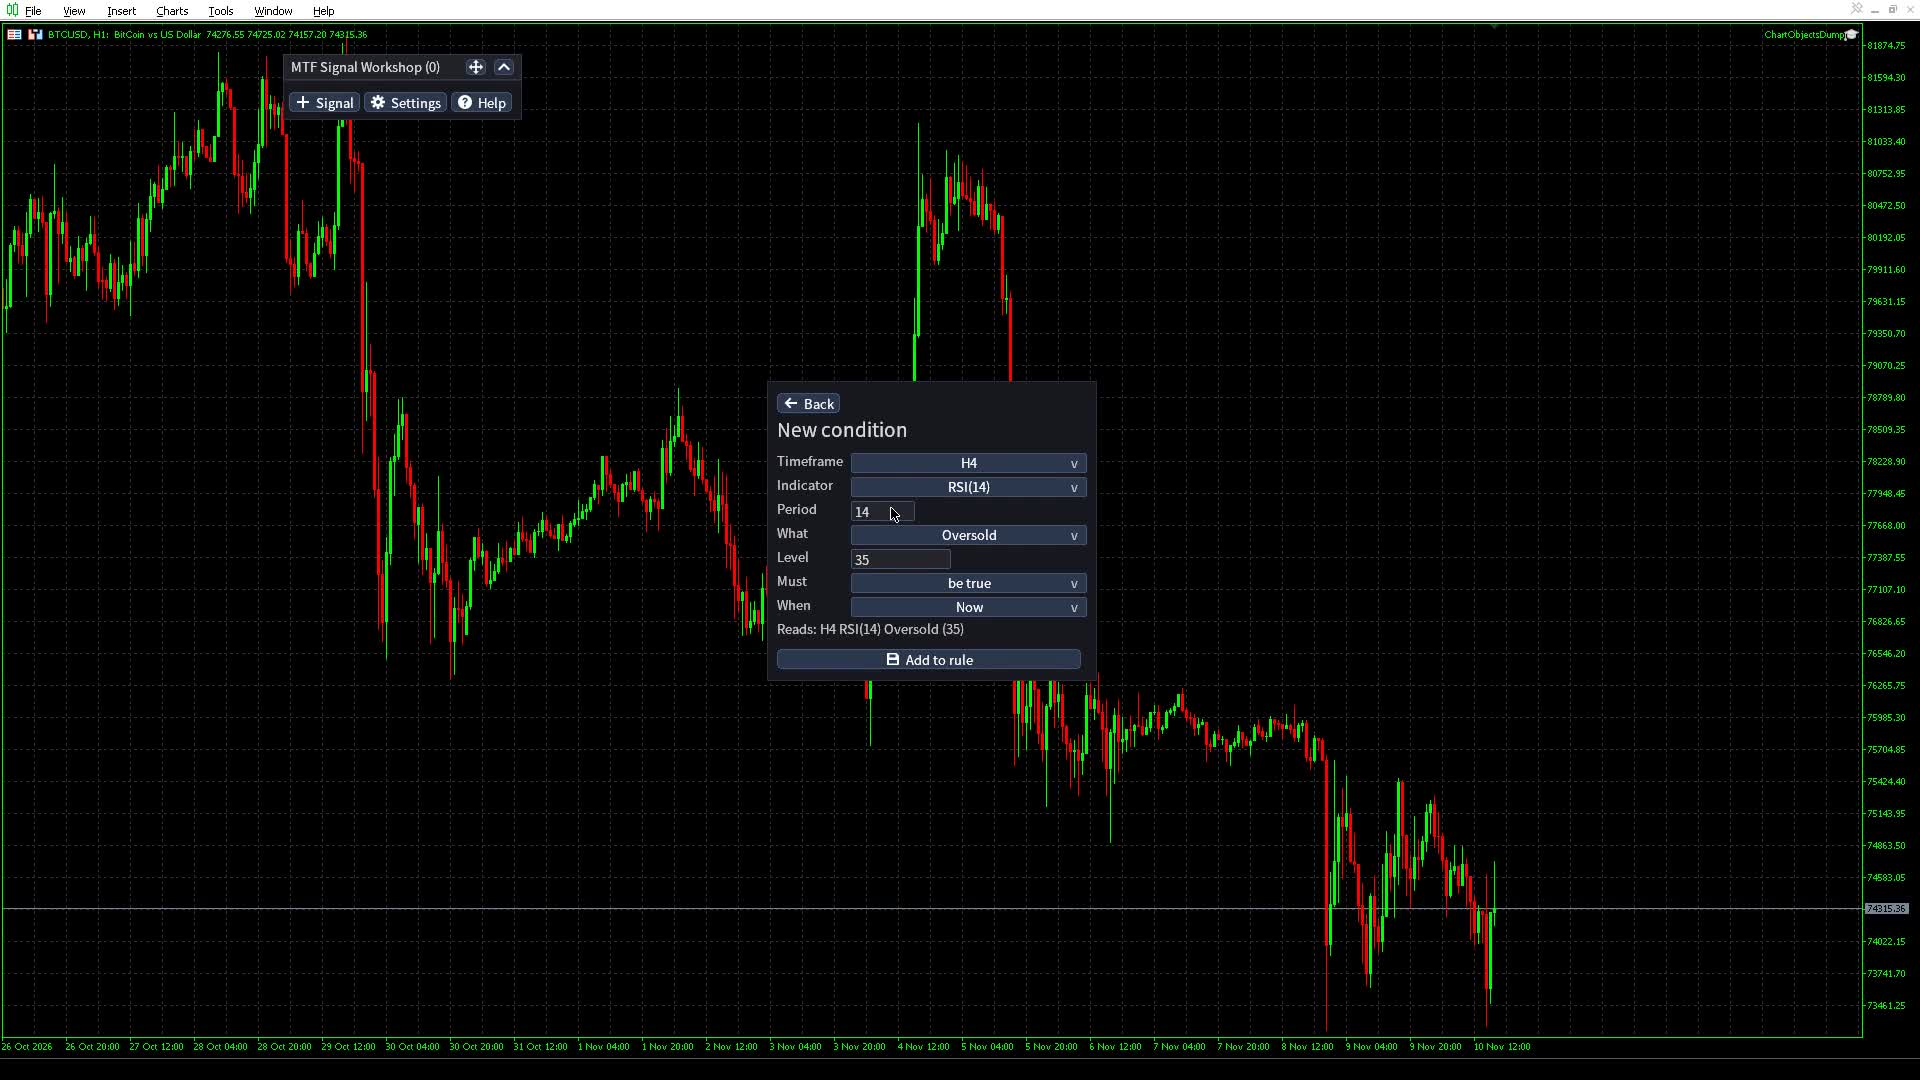
Add to rule puts the condition in the signal. Each condition then reads in words with Edit, Up, Down and Delete beside it, and the Rule text under the cards shows the rule as it is saved, in the language of section 9. Reading it is the quickest way to learn that language: every card you add shows up there as text.
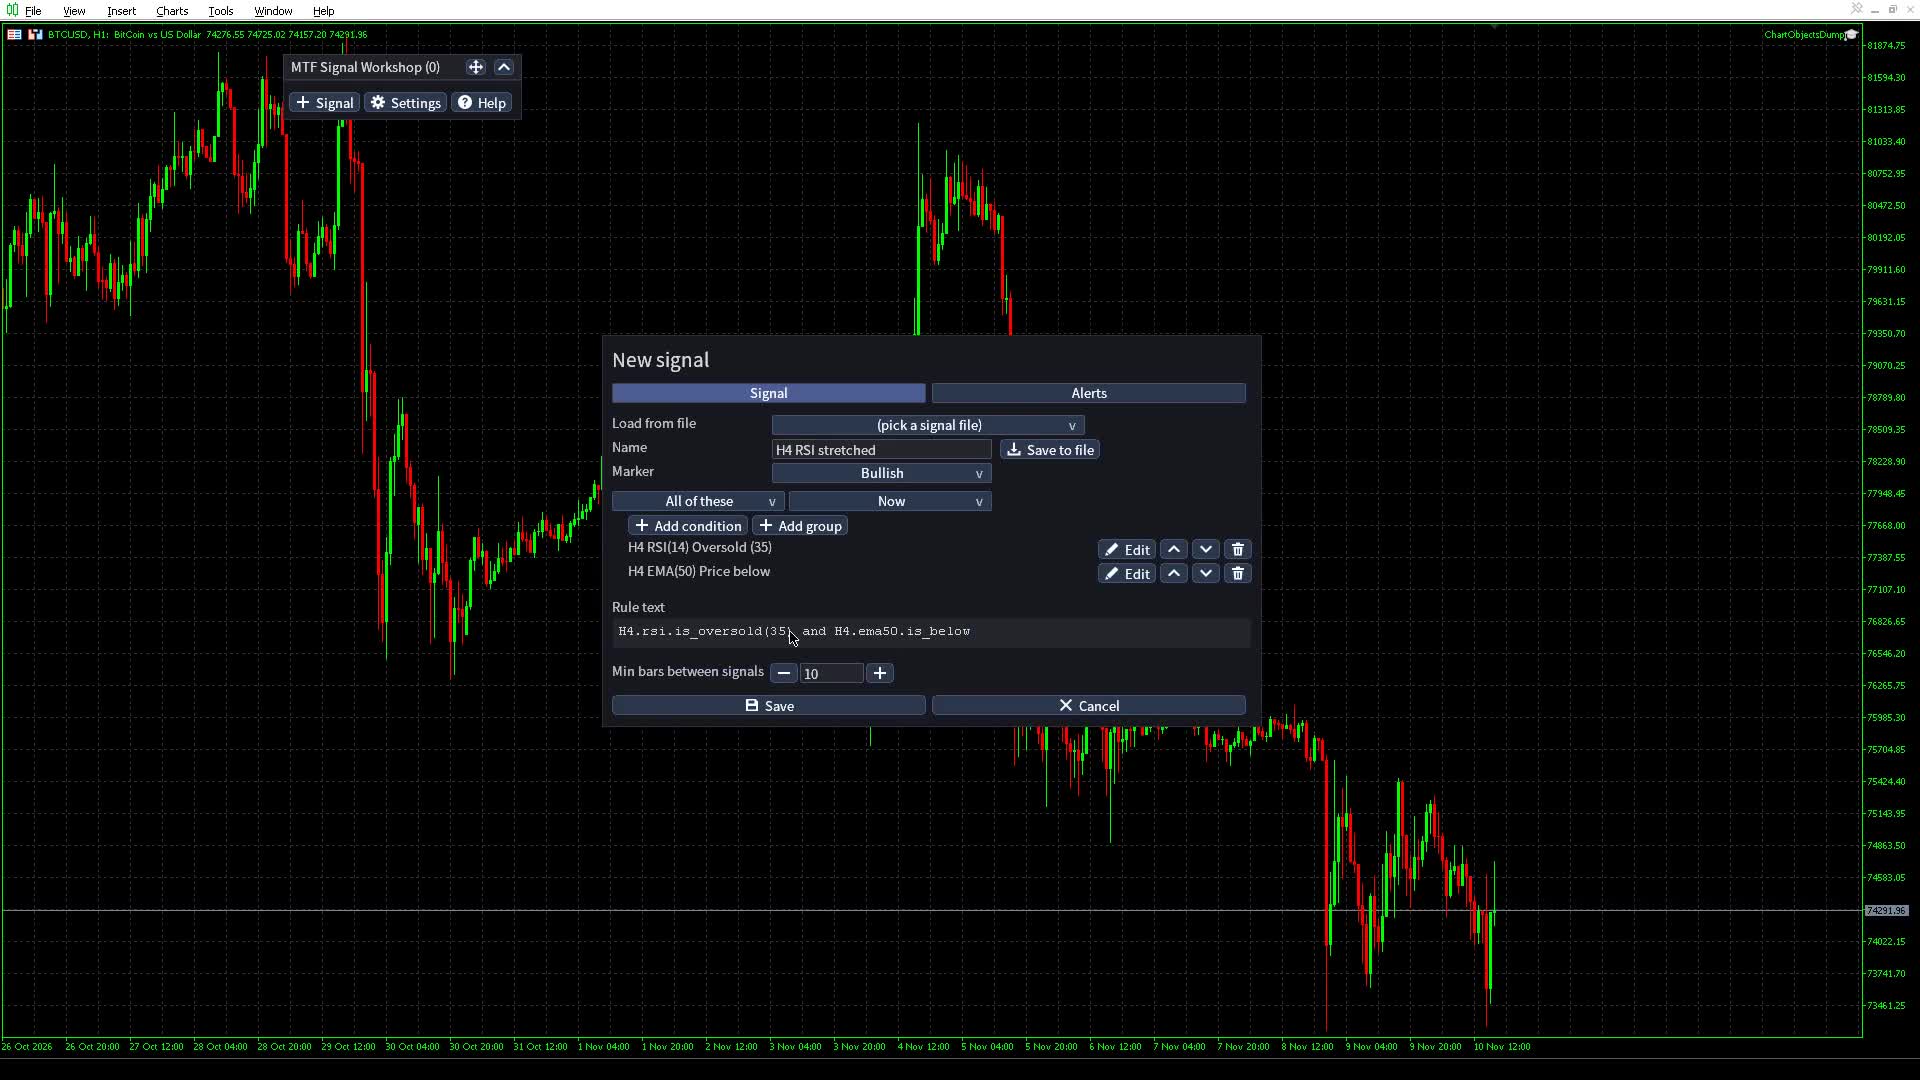
Min bars between signals, under the rule text, is how many bars a signal waits after a firing before it can fire again: 10 by default, up to 500. Save puts the signal on the chart.
5. Groups
Conditions join in groups. A group's header sets how it matches: All of these, Any of these, At least K of these with K beside it, or the same turned around (Not all of these, None of these, Fewer than K of these), and its own When. + Add group adds a group inside the one it belongs to; a group added to All of these starts as Any of these, and the other way round. Its own + Add condition and + Add group sit right under it, so any shape of rule is built by clicking the add buttons of the group each part goes in. Groups more than three levels deep fold into their card with Open.
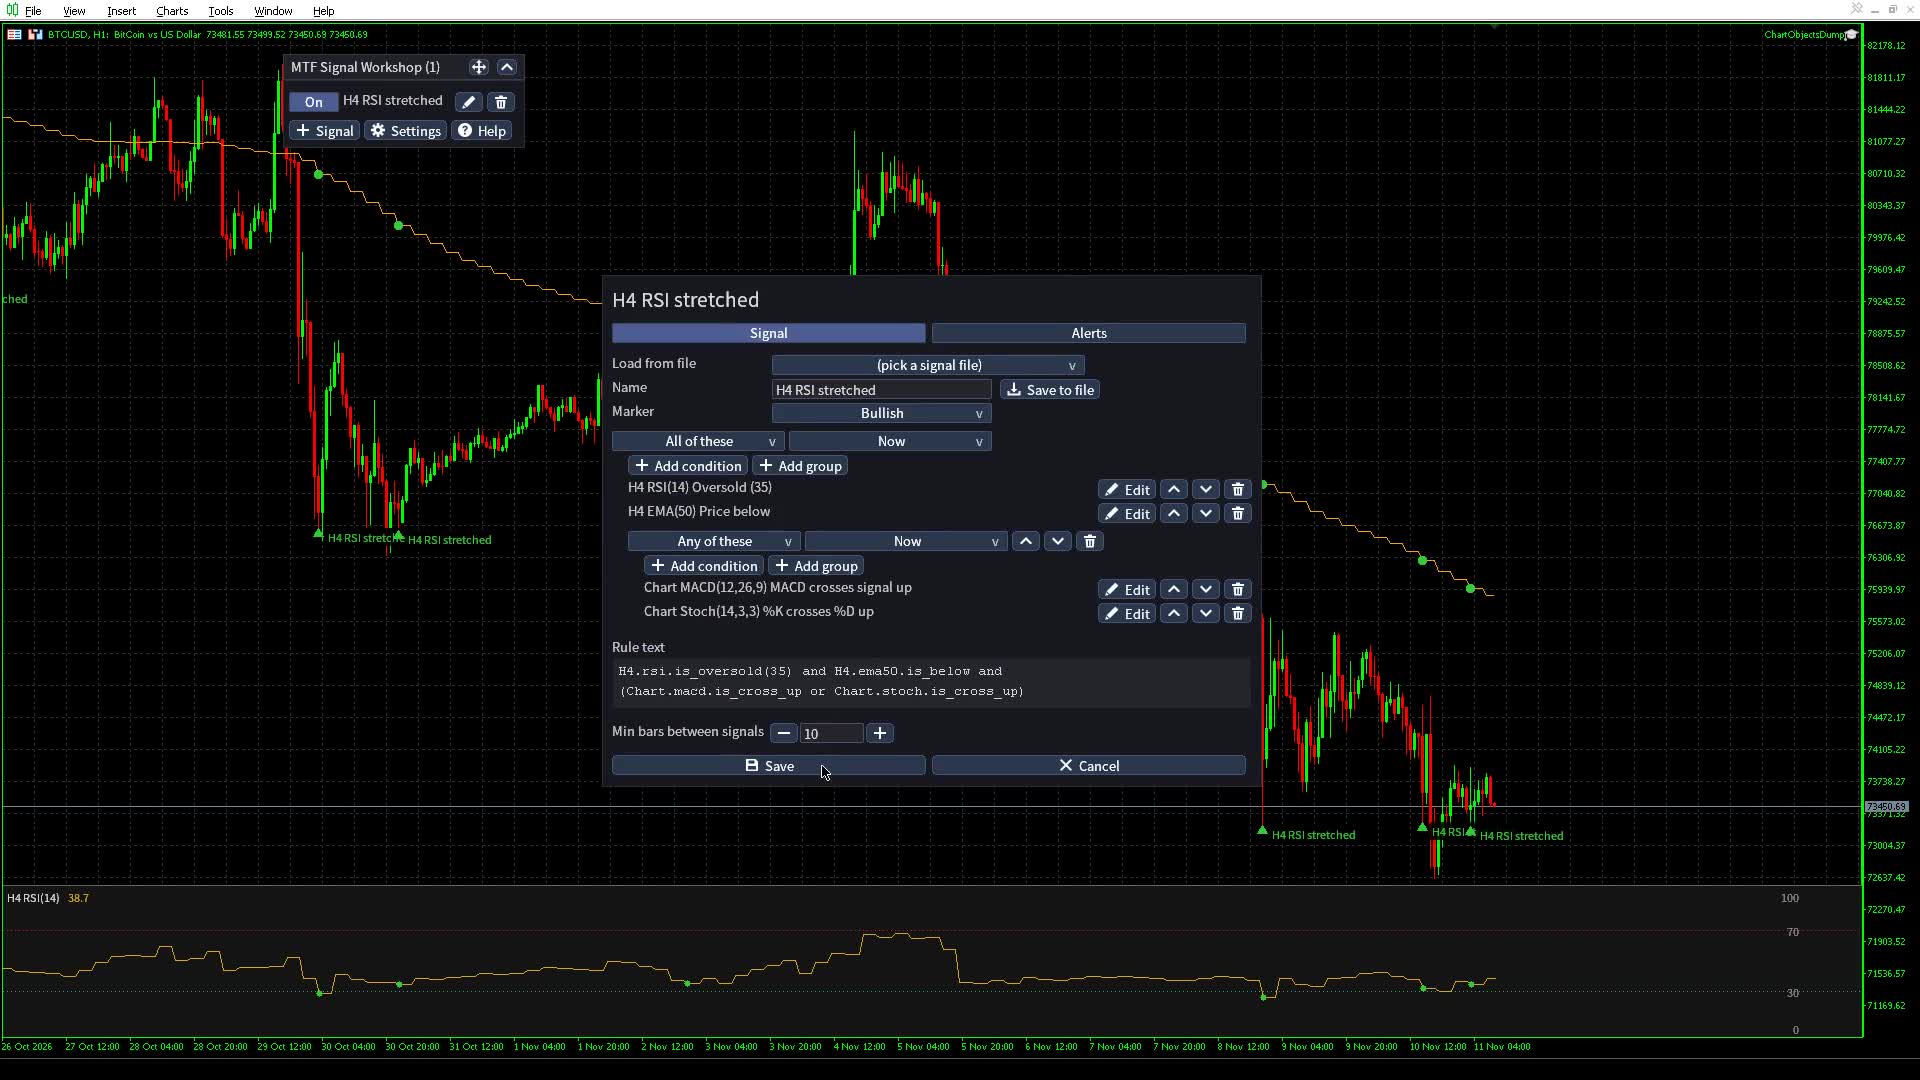
In the rule text, the headers are these words of section 9:
| Header | Rule text |
|---|---|
| All of these | a and b and c |
| Any of these | (a or b or c) |
| At least K of these | at_least_true(K, a, b, c) |
| Not all of these | not (a and b and c) |
| None of these | not (a or b or c) |
| Fewer than K of these | not at_least_true(K, a, b, c) |
| When: In the last N bars | within_bars(group, N) |
| When: N bars ago | bars_ago(group, N) |
| When: Between N and M bars ago | within_bars(group, N, M) |
6. Price structure
The price structure indicators work in conditions like any other. Typing "smart money" in the Indicator list shows Market structure, Order blocks and FVG; "levels" shows Swings, Fib, S/R and Supply/Demand.
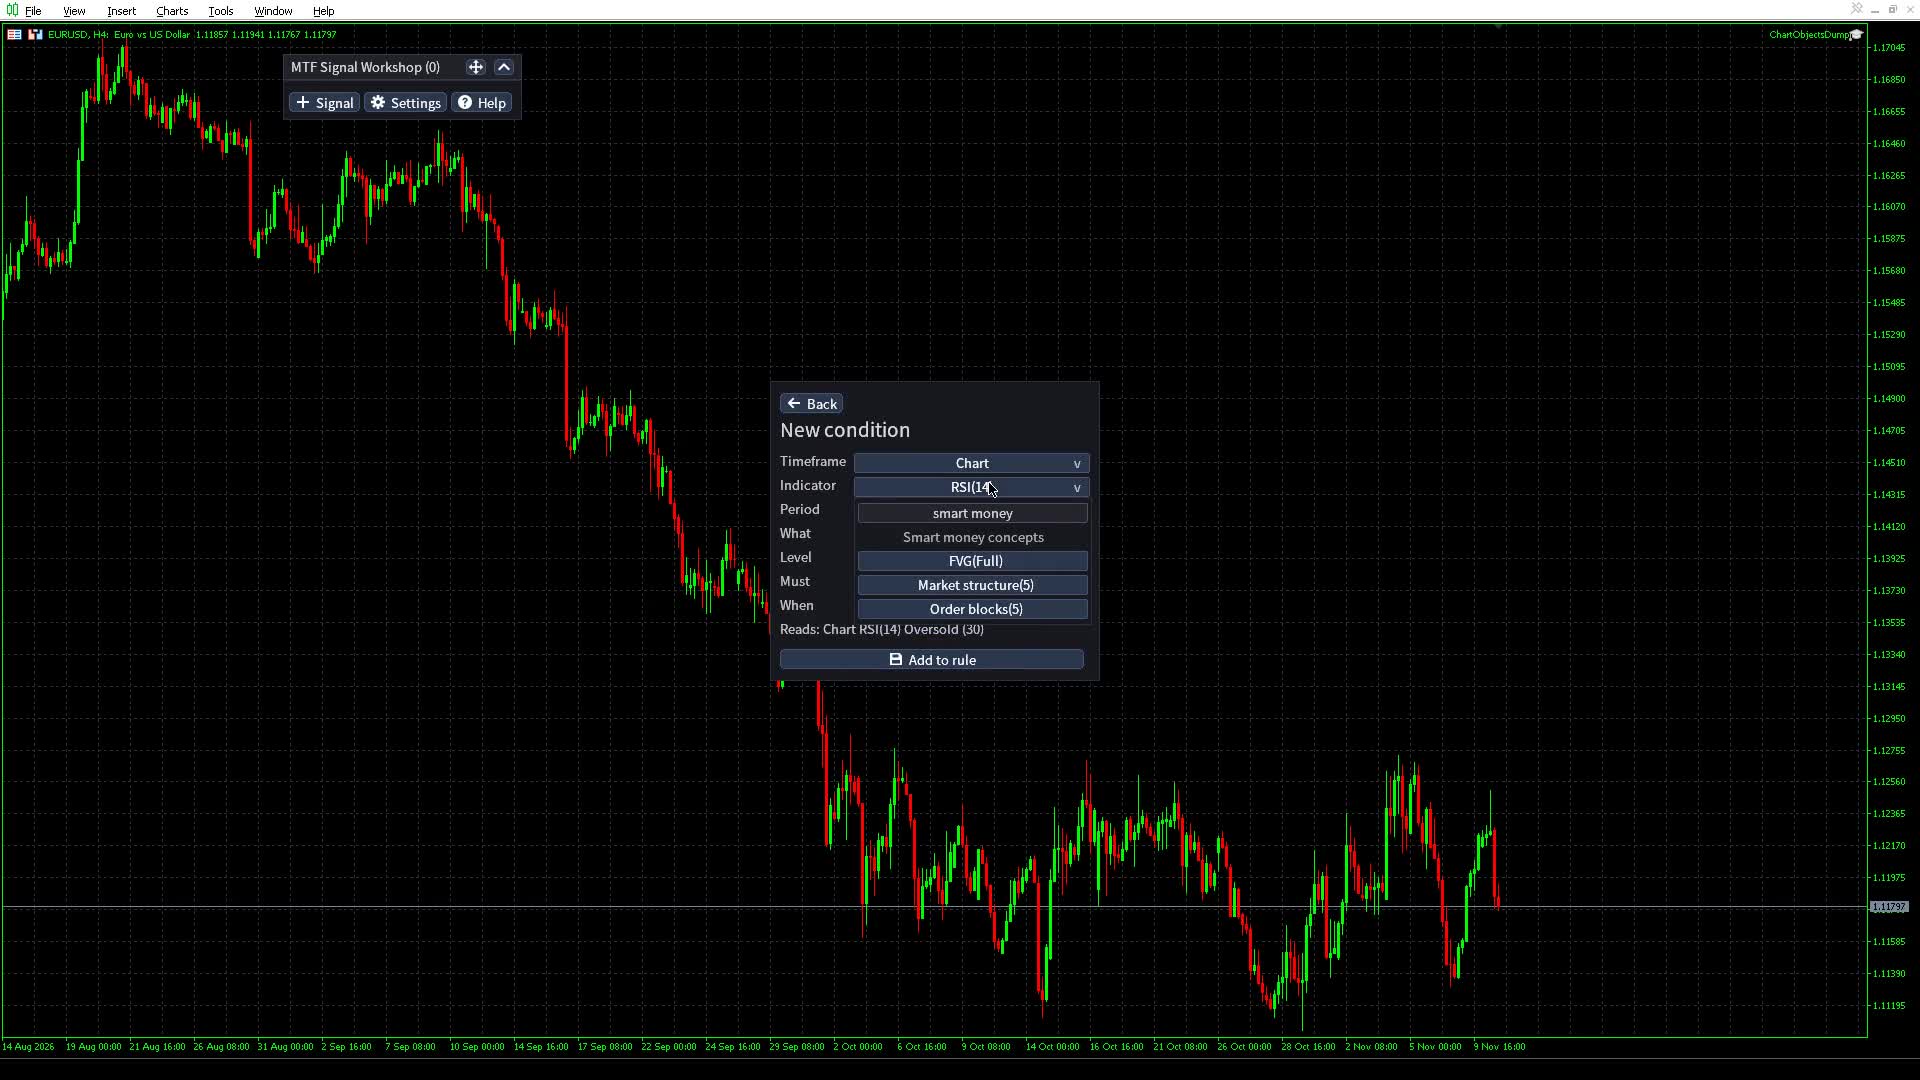
Every zone reads four ways: inside it, touched, near it (a distance in ATR you set) and broken. A fair value gap reads filled instead of broken. Supply and demand conditions take the strength a zone must have. Swings and Fib levels are zones too, a quarter ATR on each side, and Fib has the golden pocket (0.618 to 0.65) and the optimal trade entry (0.62 to 0.79). Market structure fires on breaks of structure and changes of character and holds while the structure is up or down. Because every distance is in ATR, a signal means the same on any symbol and timeframe. The price structure reference in the rule language post gives the exact definition of each.
The Trend indicator reads the trend eight ways: structure, MA stack, Donchian, ADX, Supertrend, Parabolic SAR, Ichimoku and VWAP. Bullish, Bearish and Sideways are the vote of all eight. Each method is also in the list on its own, as Bullish by MA stack, Bullish by ADX and so on, with its own numbers.
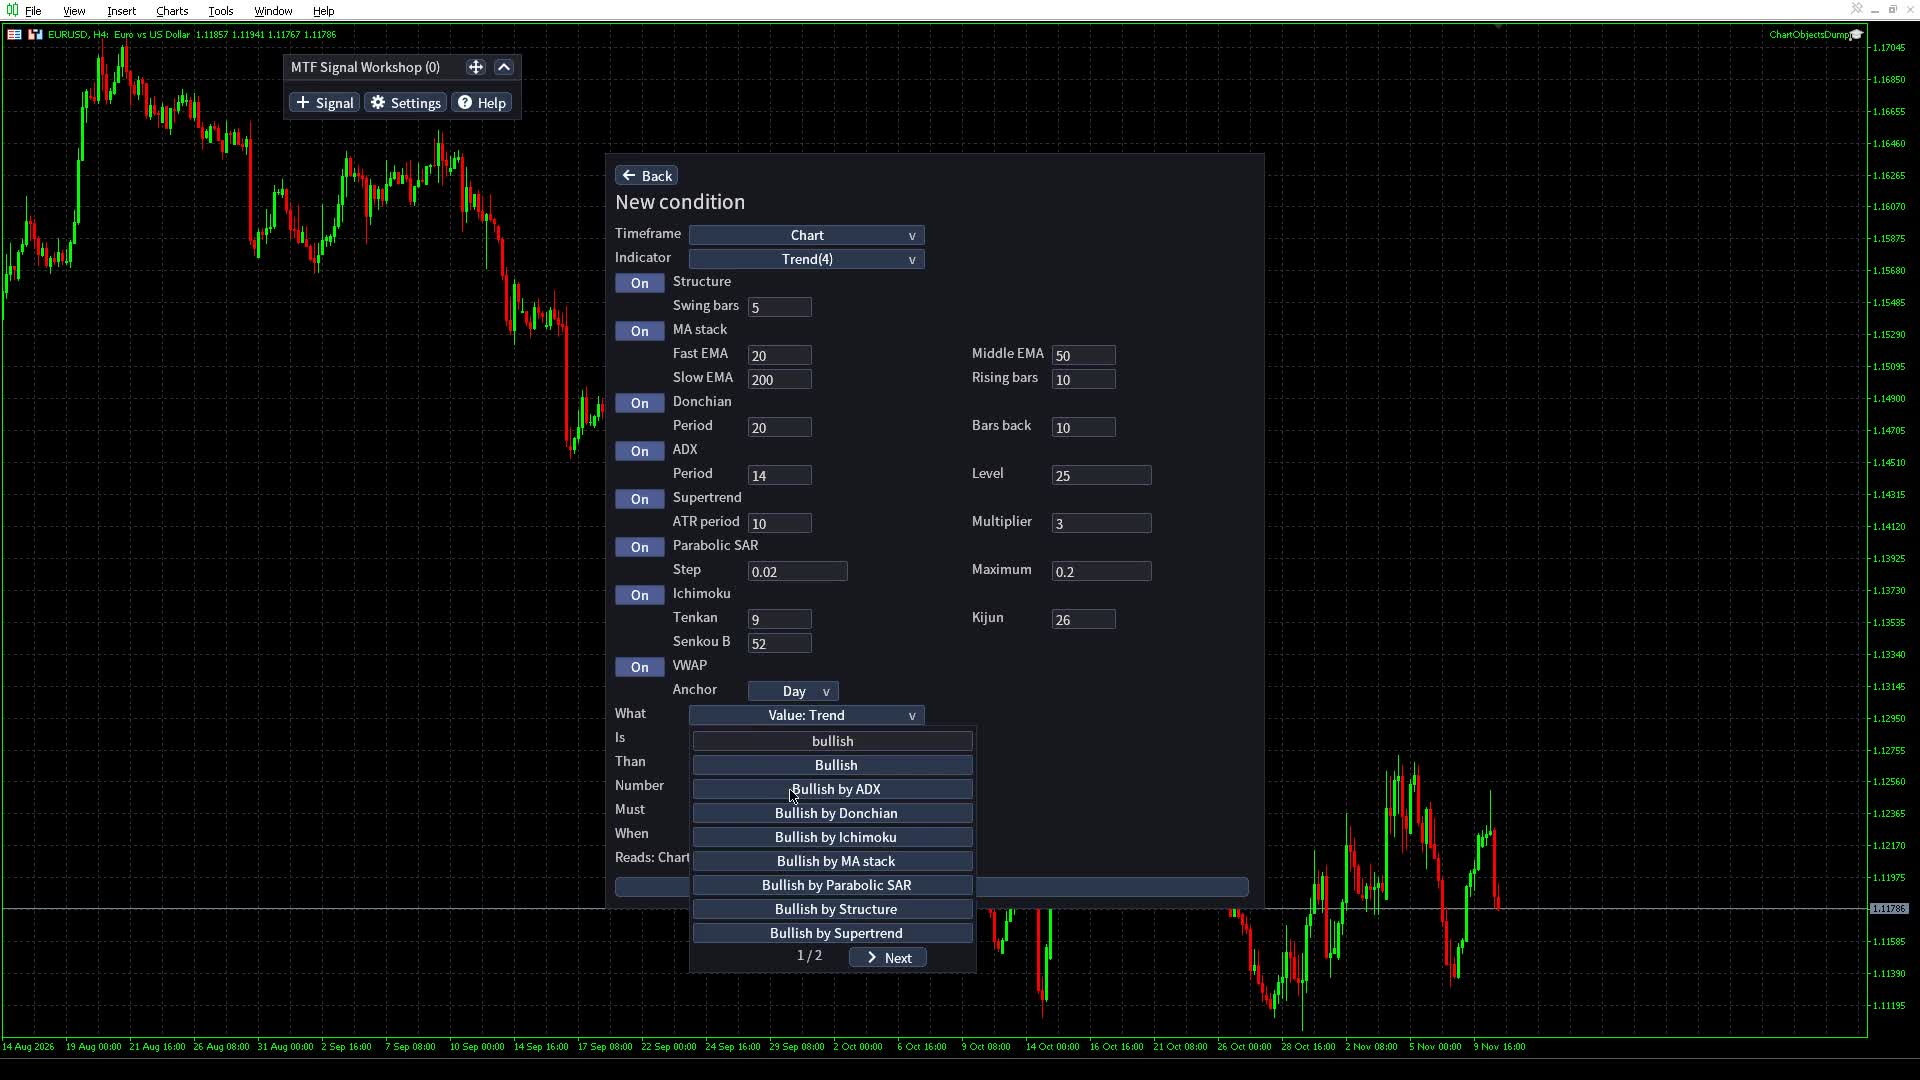
The Trend indicator's settings in the condition editor are a switch per method, where a method switched Off leaves the vote, and under each switch that is On, two per line, that method's own numbers (MA stack periods, ADX period and level, Donchian length, Supertrend ATR period and multiplier, and so on). Switching a method Off hides its numbers and keeps them. The vote reads them, and each method's flag starts from them when its brackets are empty. The rule text carries them in brackets after trend, in the order the rule language post lists them: H4.trend(0, 1, 0, 0, 0, 0, 0, 0, 5, 10, 21, 50, 5) votes with the MA stack alone, on EMA 10, 21 and 50 with the 50 rising over 5 bars. To vote with only the methods you trust, each with its own numbers, you can also put the flags in a group set to At least K of these:
at_least_true(2,
    H4.trend.is_bullish_ma_stack(20, 50, 200, 10),
    H4.trend.is_bullish_adx(14, 25),
    H4.trend.is_bullish_structure(5)
)
7. Alerts and settings
Settings sets how every signal alerts: the Alert window, a sound, a push notification and an email, each on its own switch. Push and email use the terminal's own setup (Tools, Options, Notifications and Email). Below them are the colors of the bullish and bearish markers and the theme, Dark or Light.
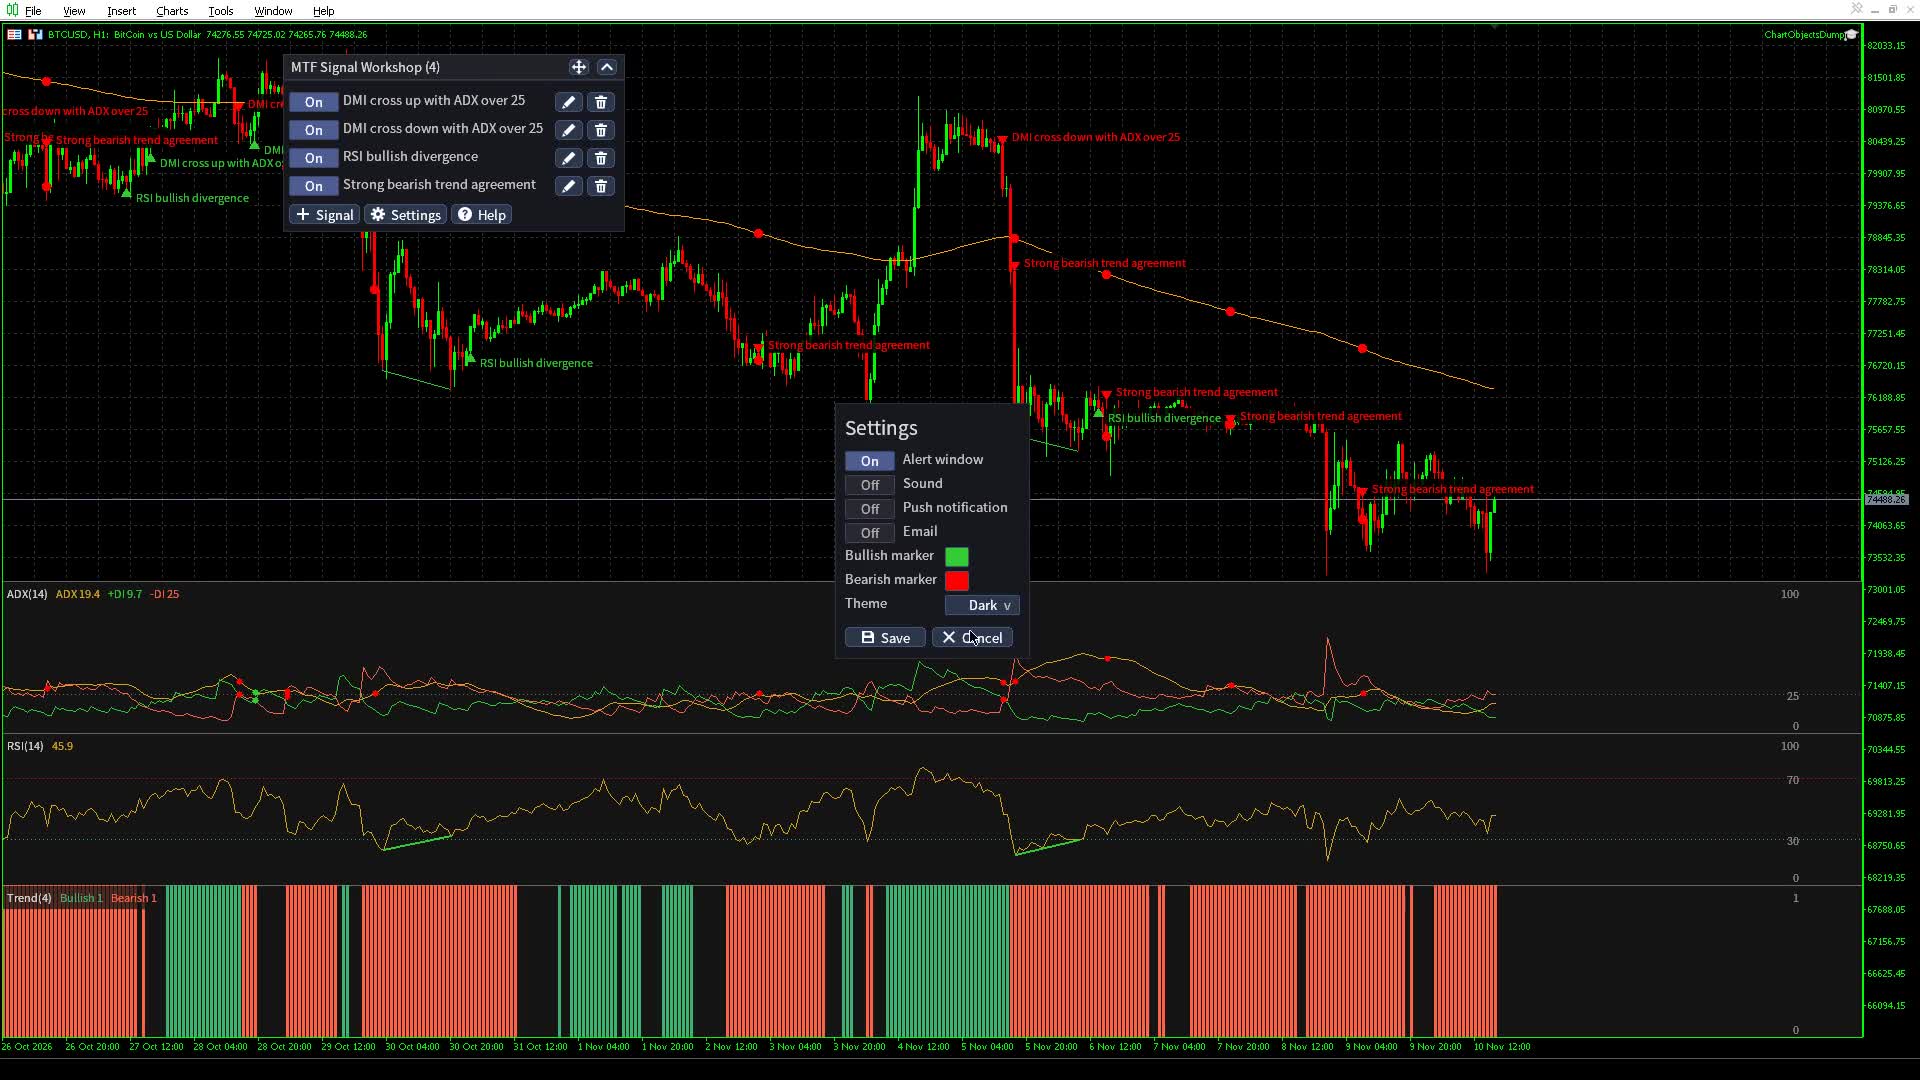
A signal can have its own alerts: the Alerts page of its editor starts with Own alerts. Off, it follows Settings; on, it has its own switches and marker colors, starting from Settings.
Only a firing on the bar that just closed alerts, once. The bar it alerted on is saved, so removing and adding the indicator again does not repeat the alert. Older firings found in the history are drawn without alerting. A divergence is known only a few bars after its second pivot, so its arrow sits on the bar where it became known.
8. Signal files: save, write, load and share
Help opens six pages: Start, Building, Rules, Files, Alerts and Chart. Files gives this terminal's signal directory in full.
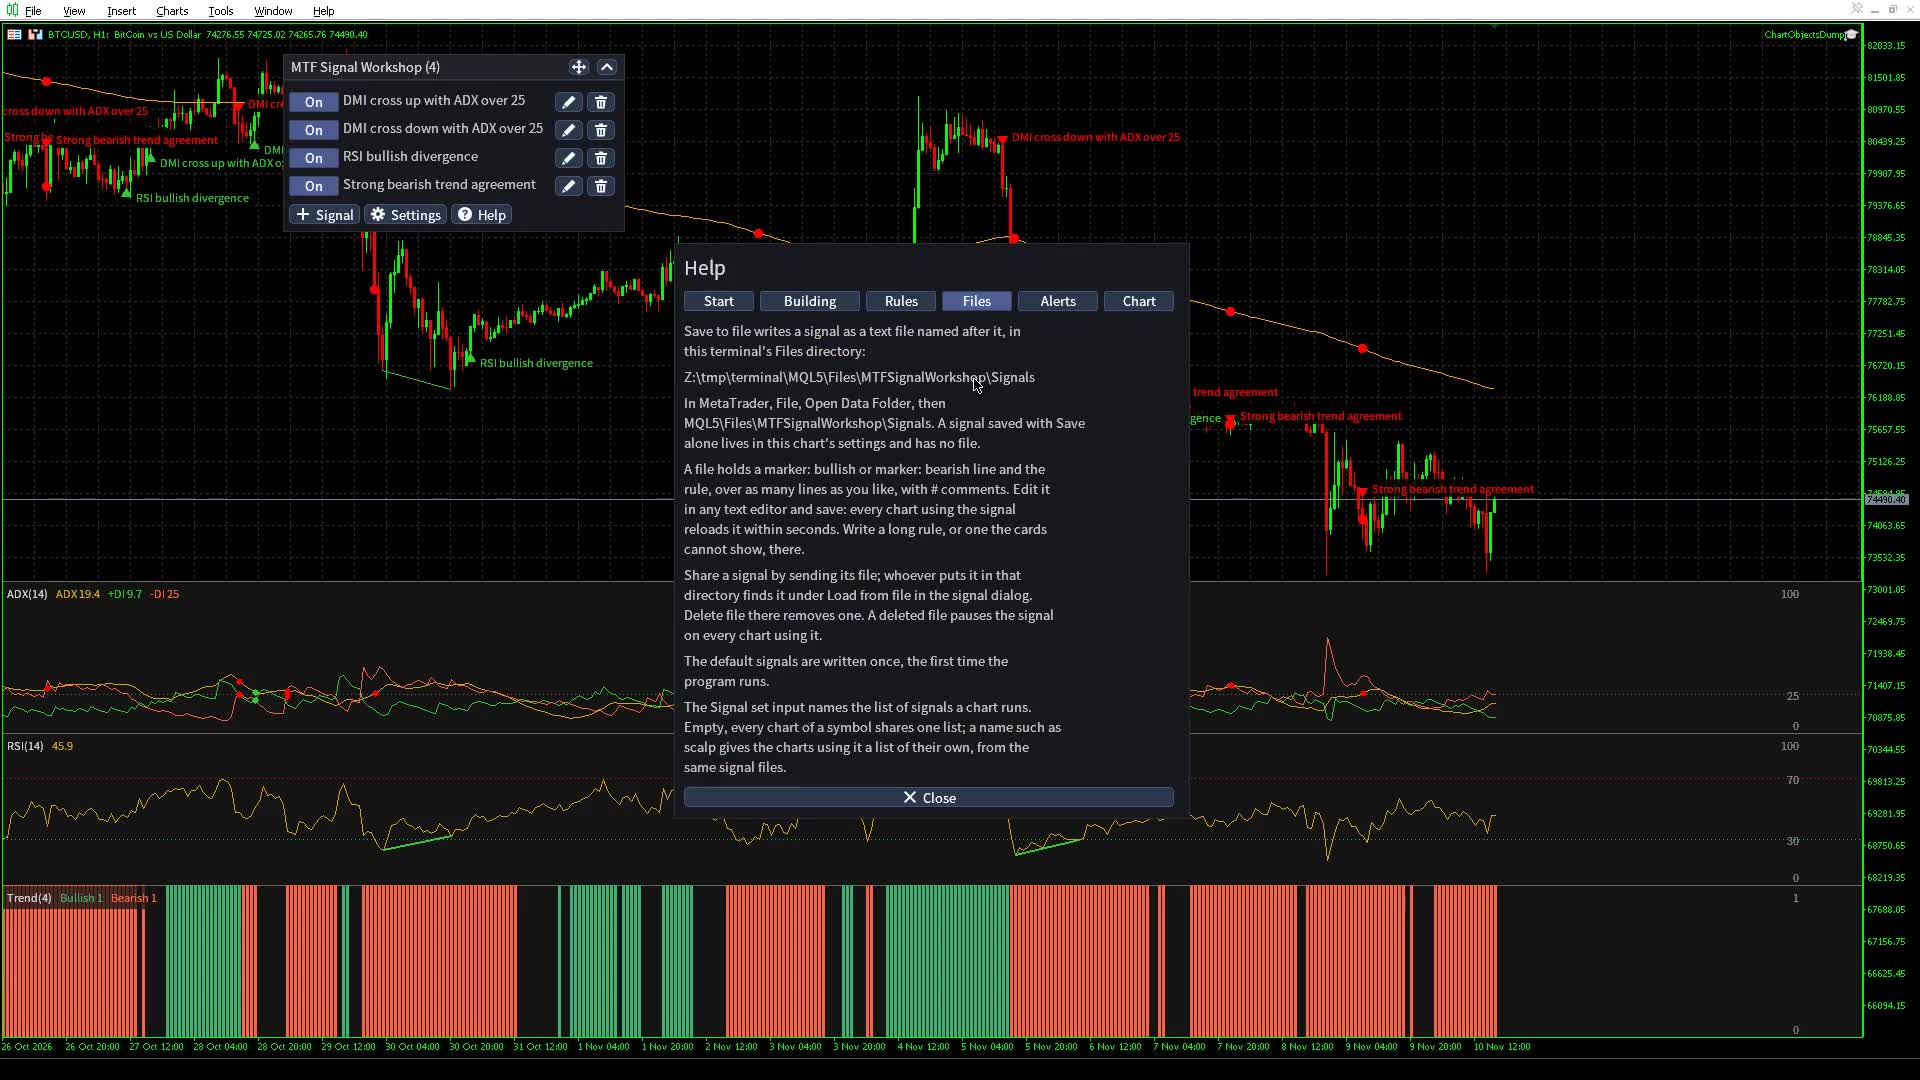
A signal can live in a plain text file. The files sit under the terminal's data directory (MetaTrader's File menu opens it), in MQL5\Files\MTFSignalWorkshop\Signals\ (MQL4\Files\MTFSignalWorkshop\Signals\ on MT4). Every chart of that terminal sees the same files; another terminal keeps its own, so copy a file across to use a signal there.
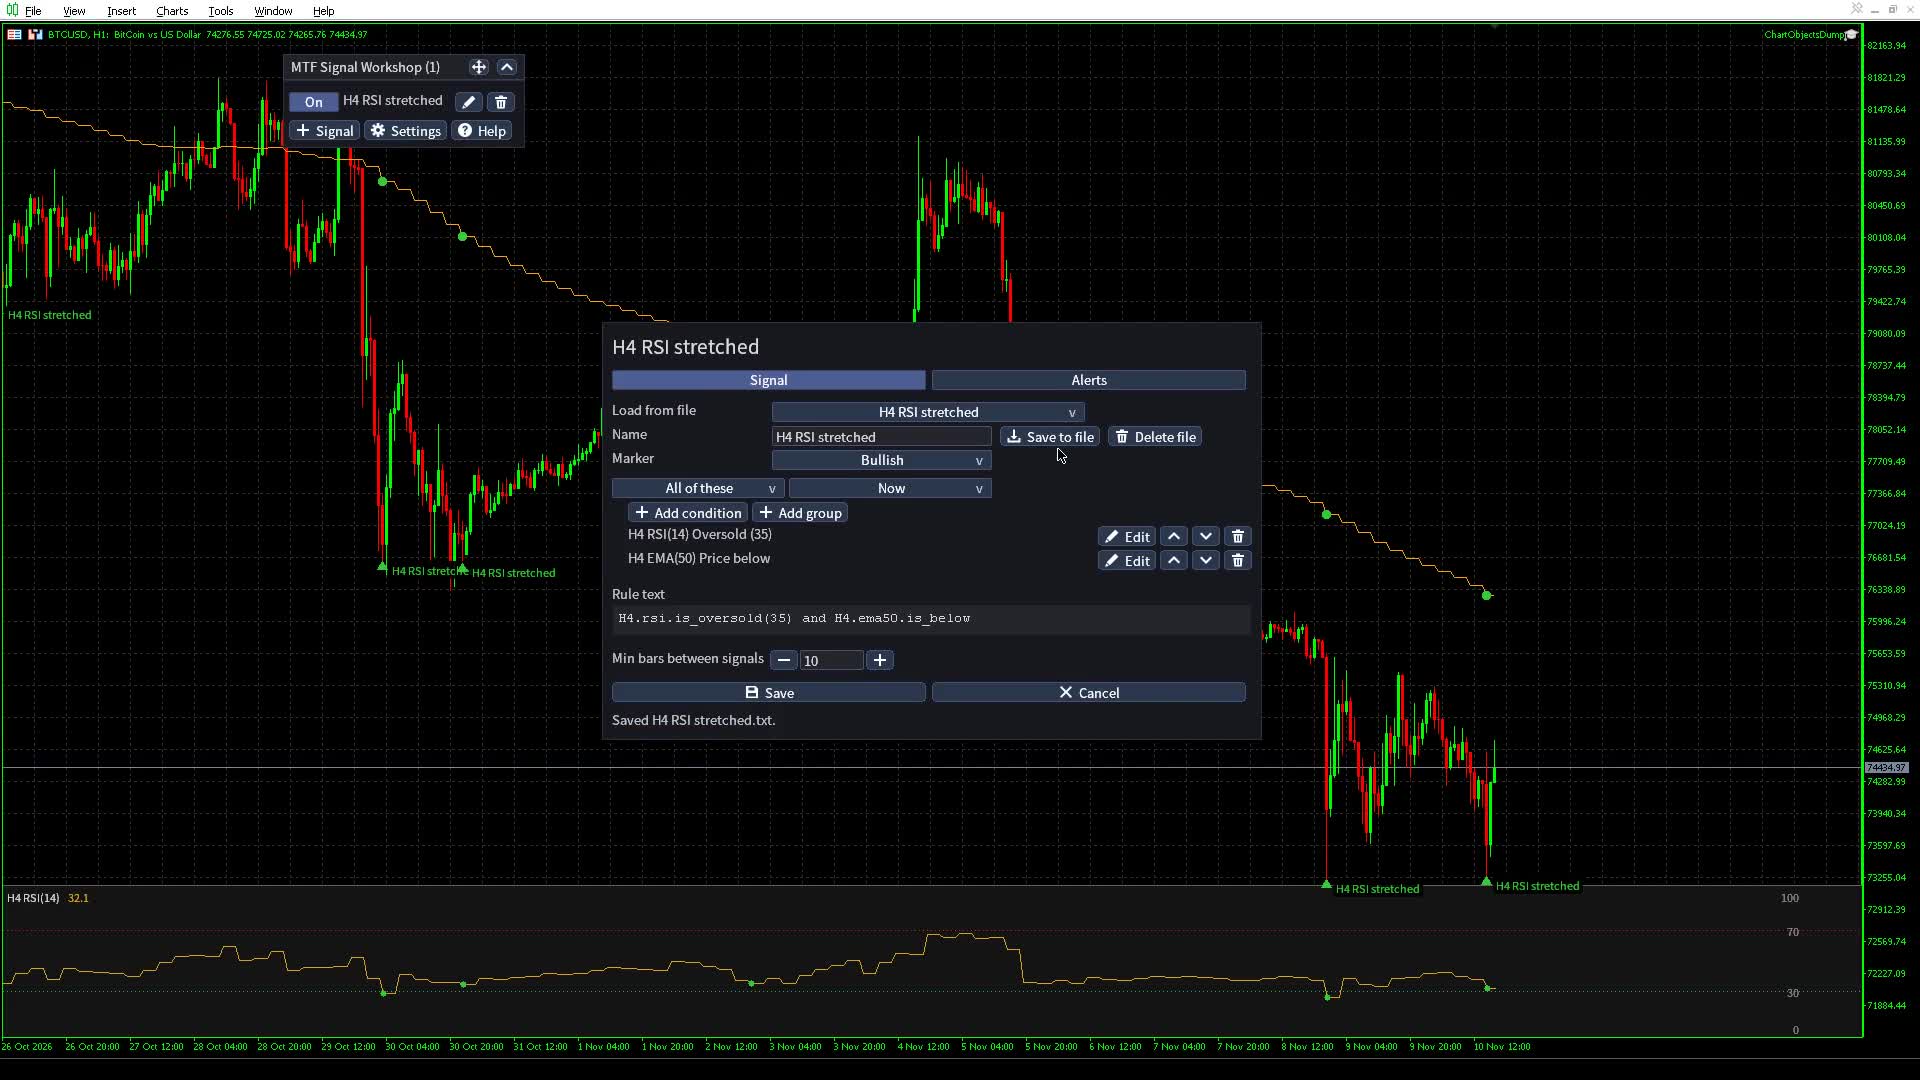
Save and Save to file
The signal dialog has two save buttons, and they do different things:
- Save, at the bottom, puts the signal on this chart, or changes it there. It writes no signal file. A signal saved only this way lives in the chart's settings (section 10), and no other chart can load it.
- Save to file, at the end of the Name row, writes the signal to the file of its name at once and says so under Load from file. A rule built with the cards is written laid out over lines; a rule a person wrote in the file stays as written. Saving under a new name writes a new file and leaves the old one, which is how you copy a signal.
So to keep a signal for other charts and symbols, or after you remove it from this chart, click Save to file, then Save. A chart that runs a signal from its file names the file, so editing the file changes the signal on every chart that runs it.
Load from file and Delete file
Load from file lists every file in the directory, in natural order (RSI 2 before RSI 10), and typing filters it. Picking one fills the name, the marker and the rule, to save as it is or change first.
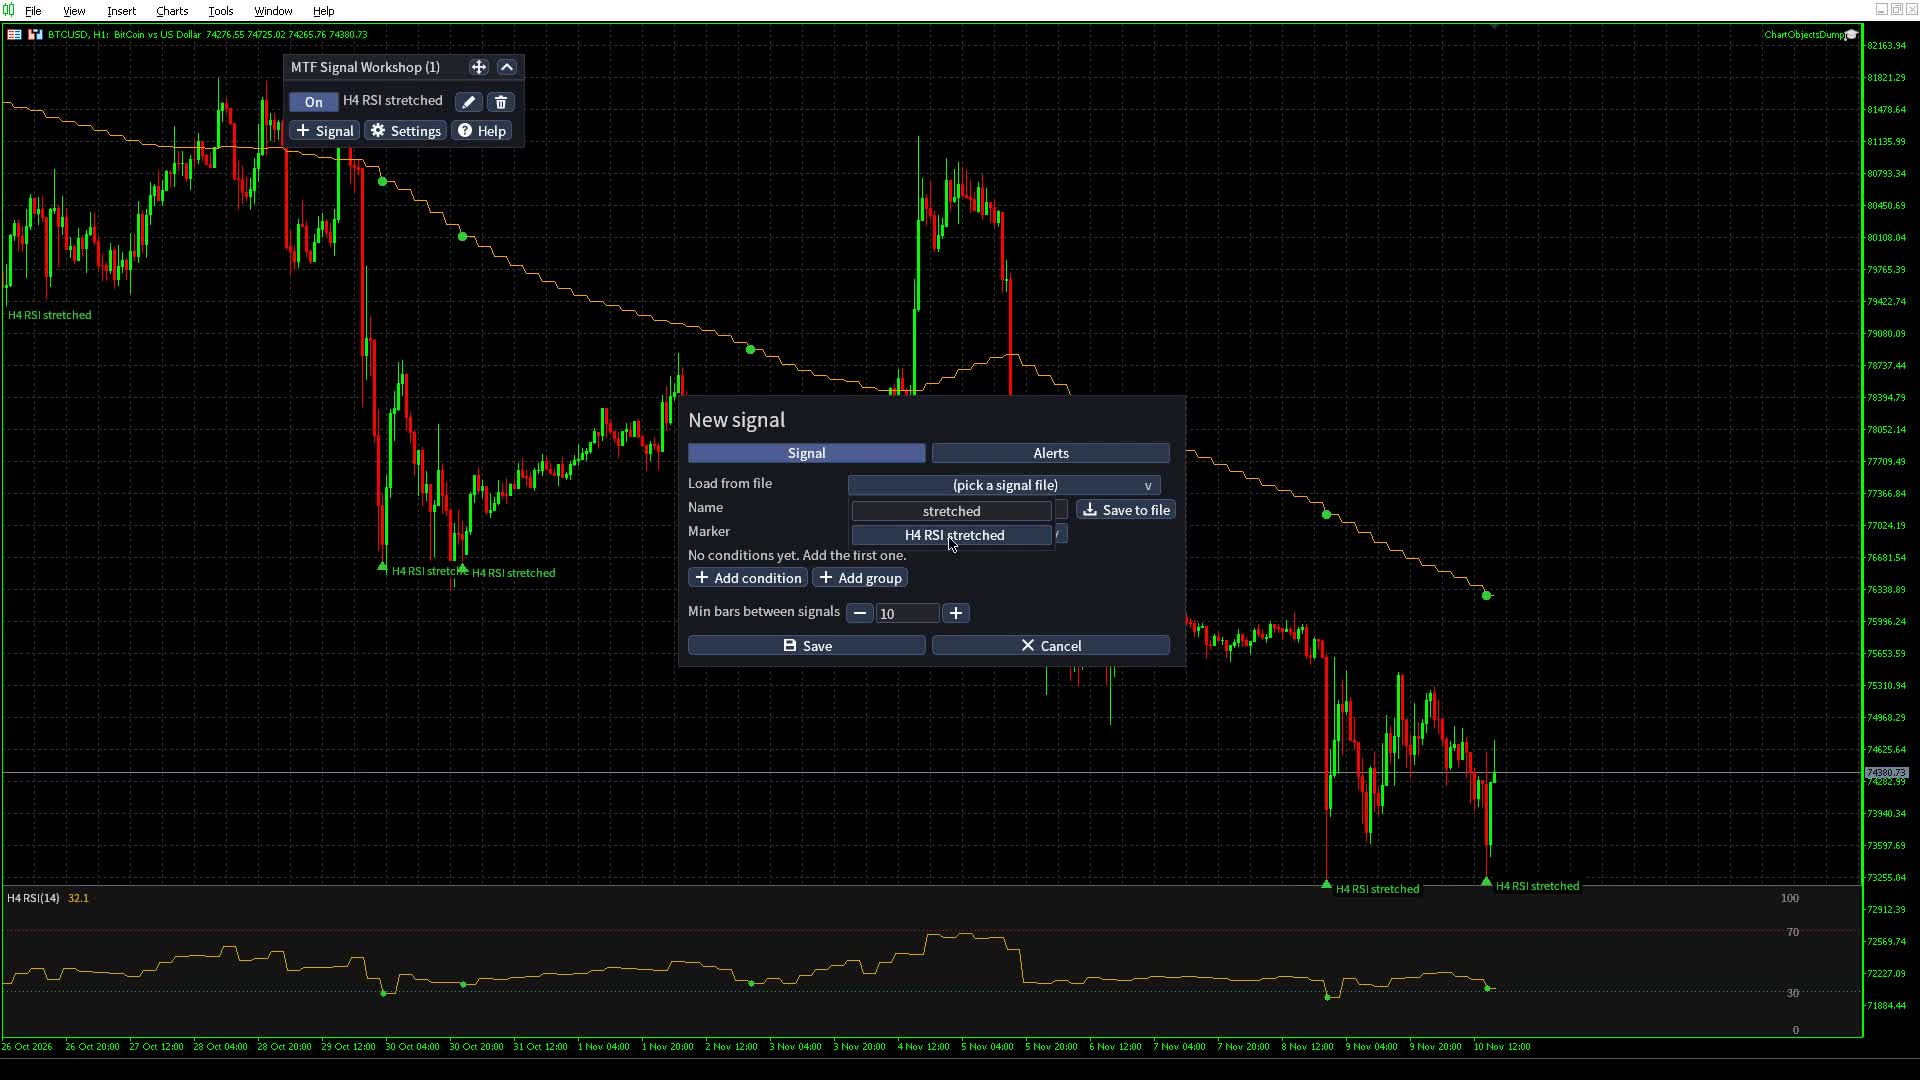
While the Name names a file, the Name row also shows Delete file: the first click says which file the next one deletes, and the second deletes it. Deleting a file pauses the signal on every chart that runs it, with a note that its file may be missing.
Write a signal by hand
Any text editor works, Notepad included. To get to the signal directory:
- In MetaTrader, open File, then Open Data Folder. The terminal's data directory opens in the file explorer.
- Open MQL5 (MQL4 on MT4), then Files, MTFSignalWorkshop and Signals. Every signal file is there, the ready-made ones included.
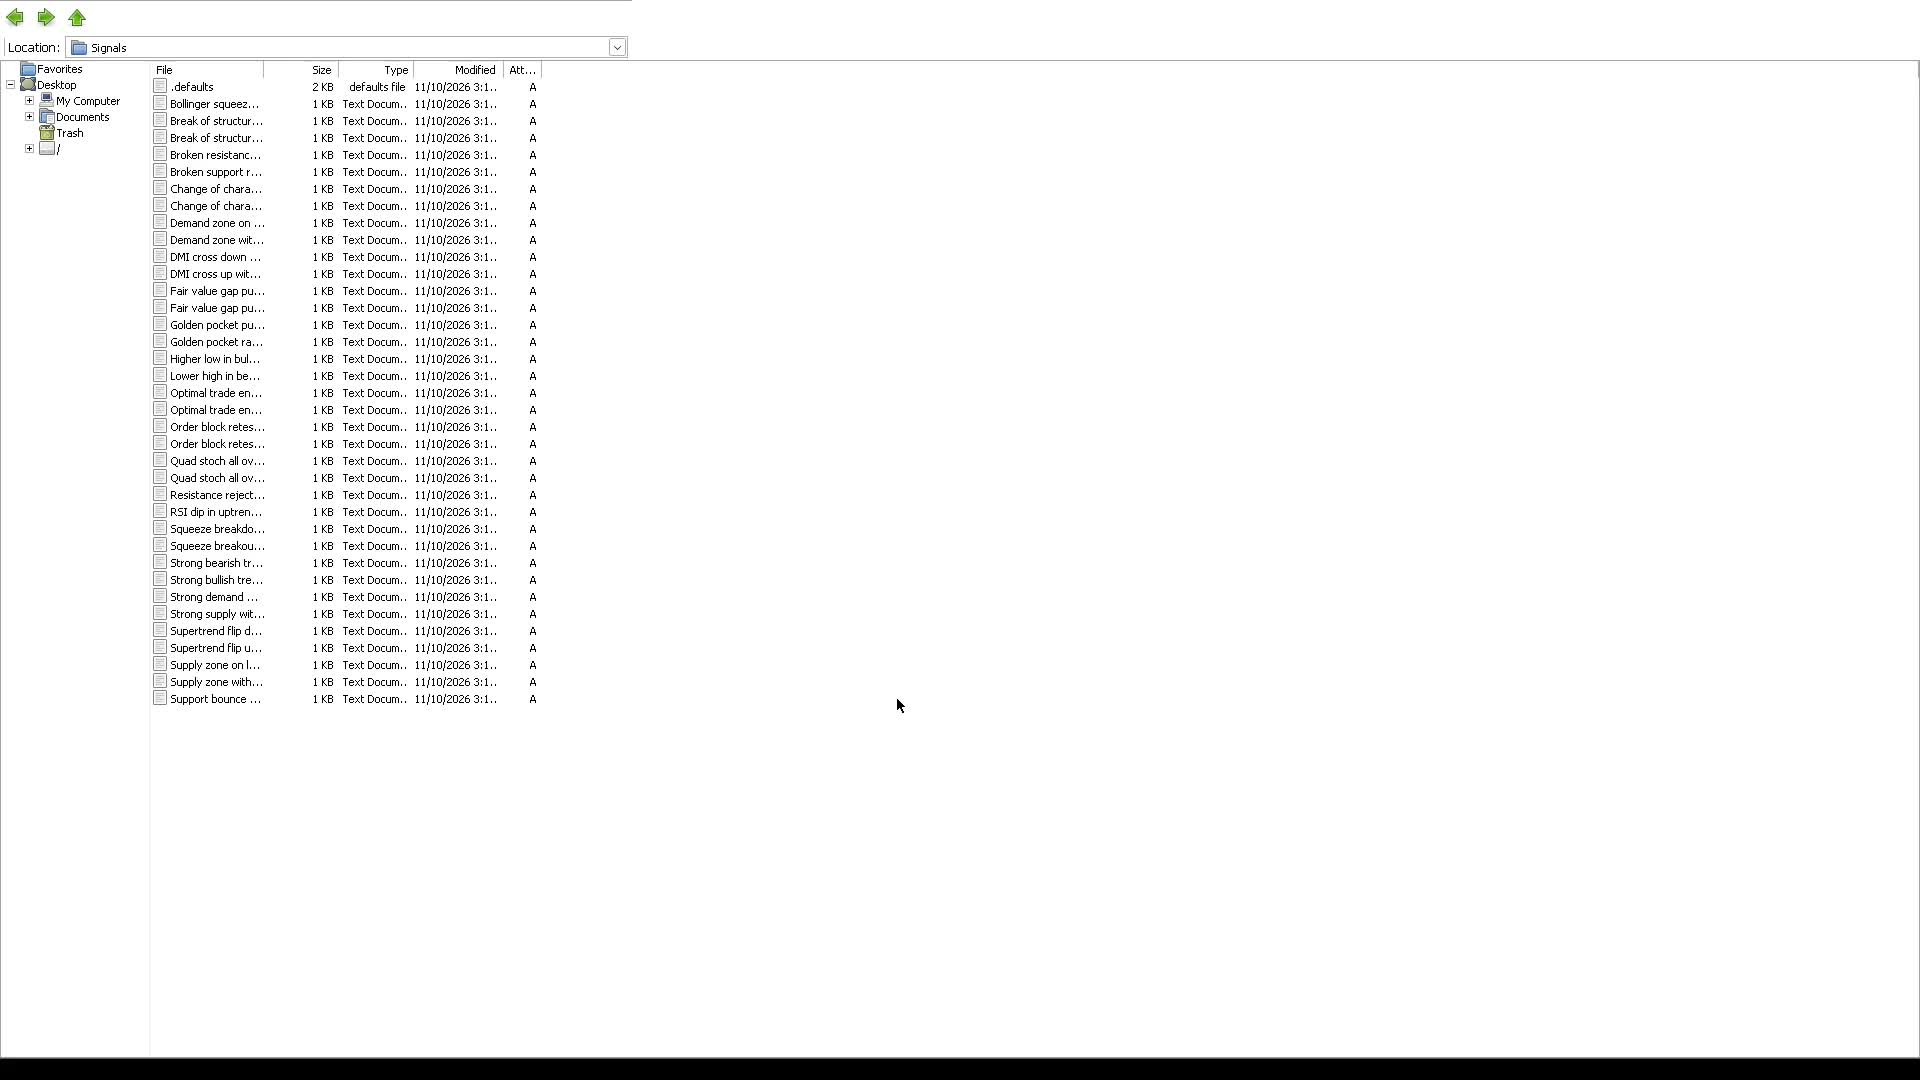
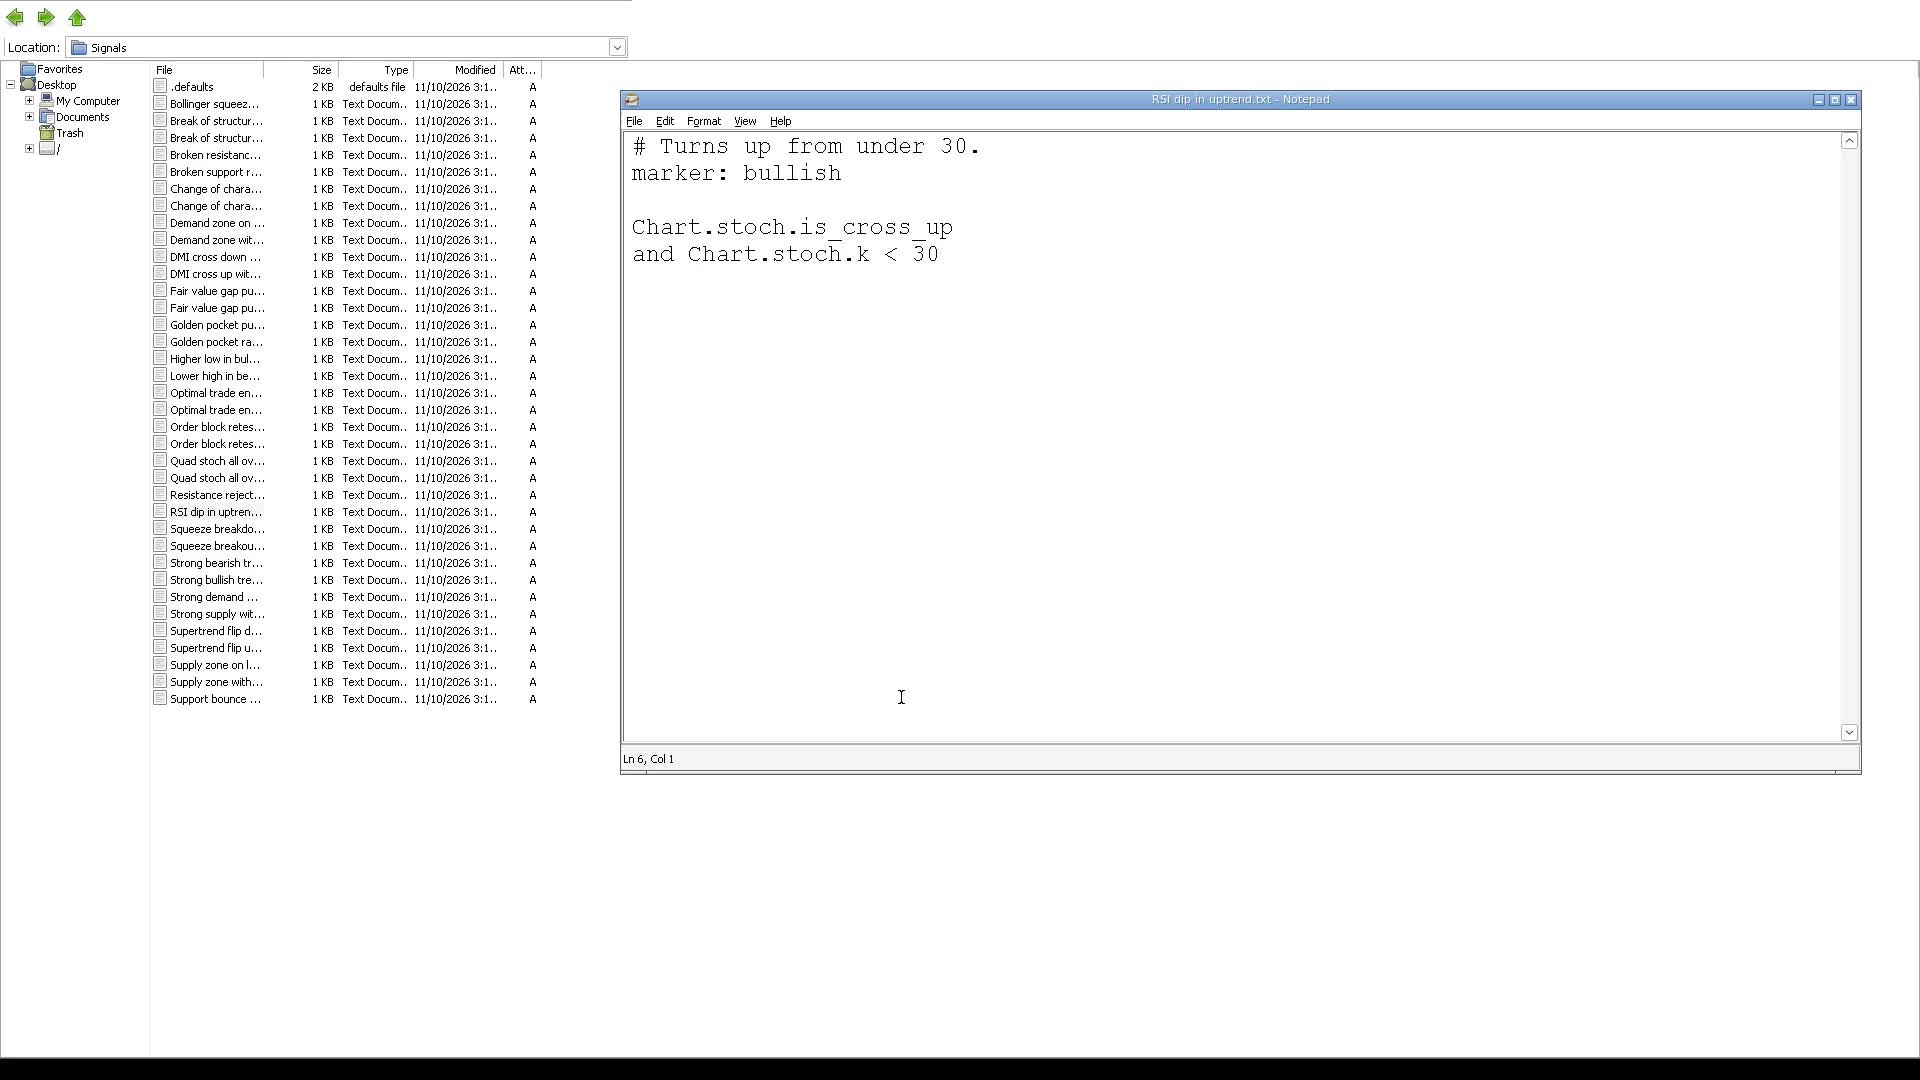
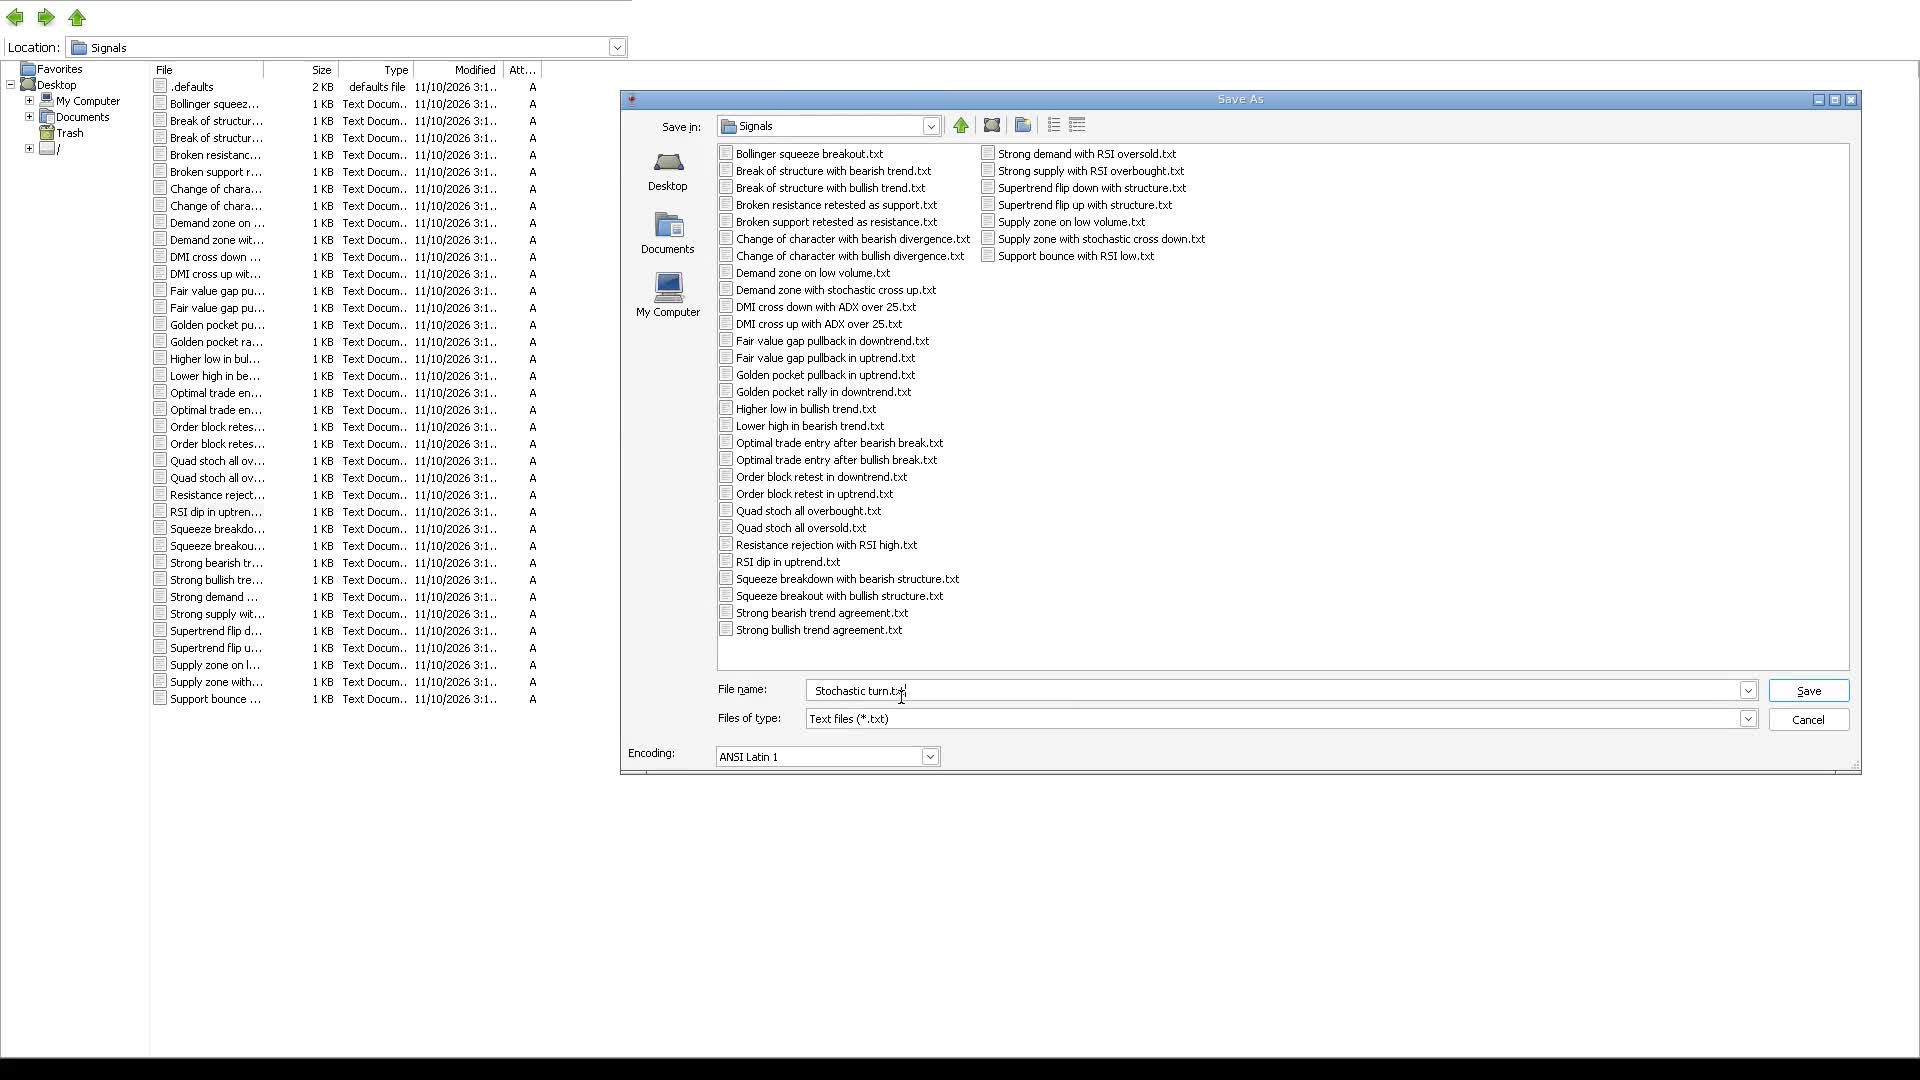
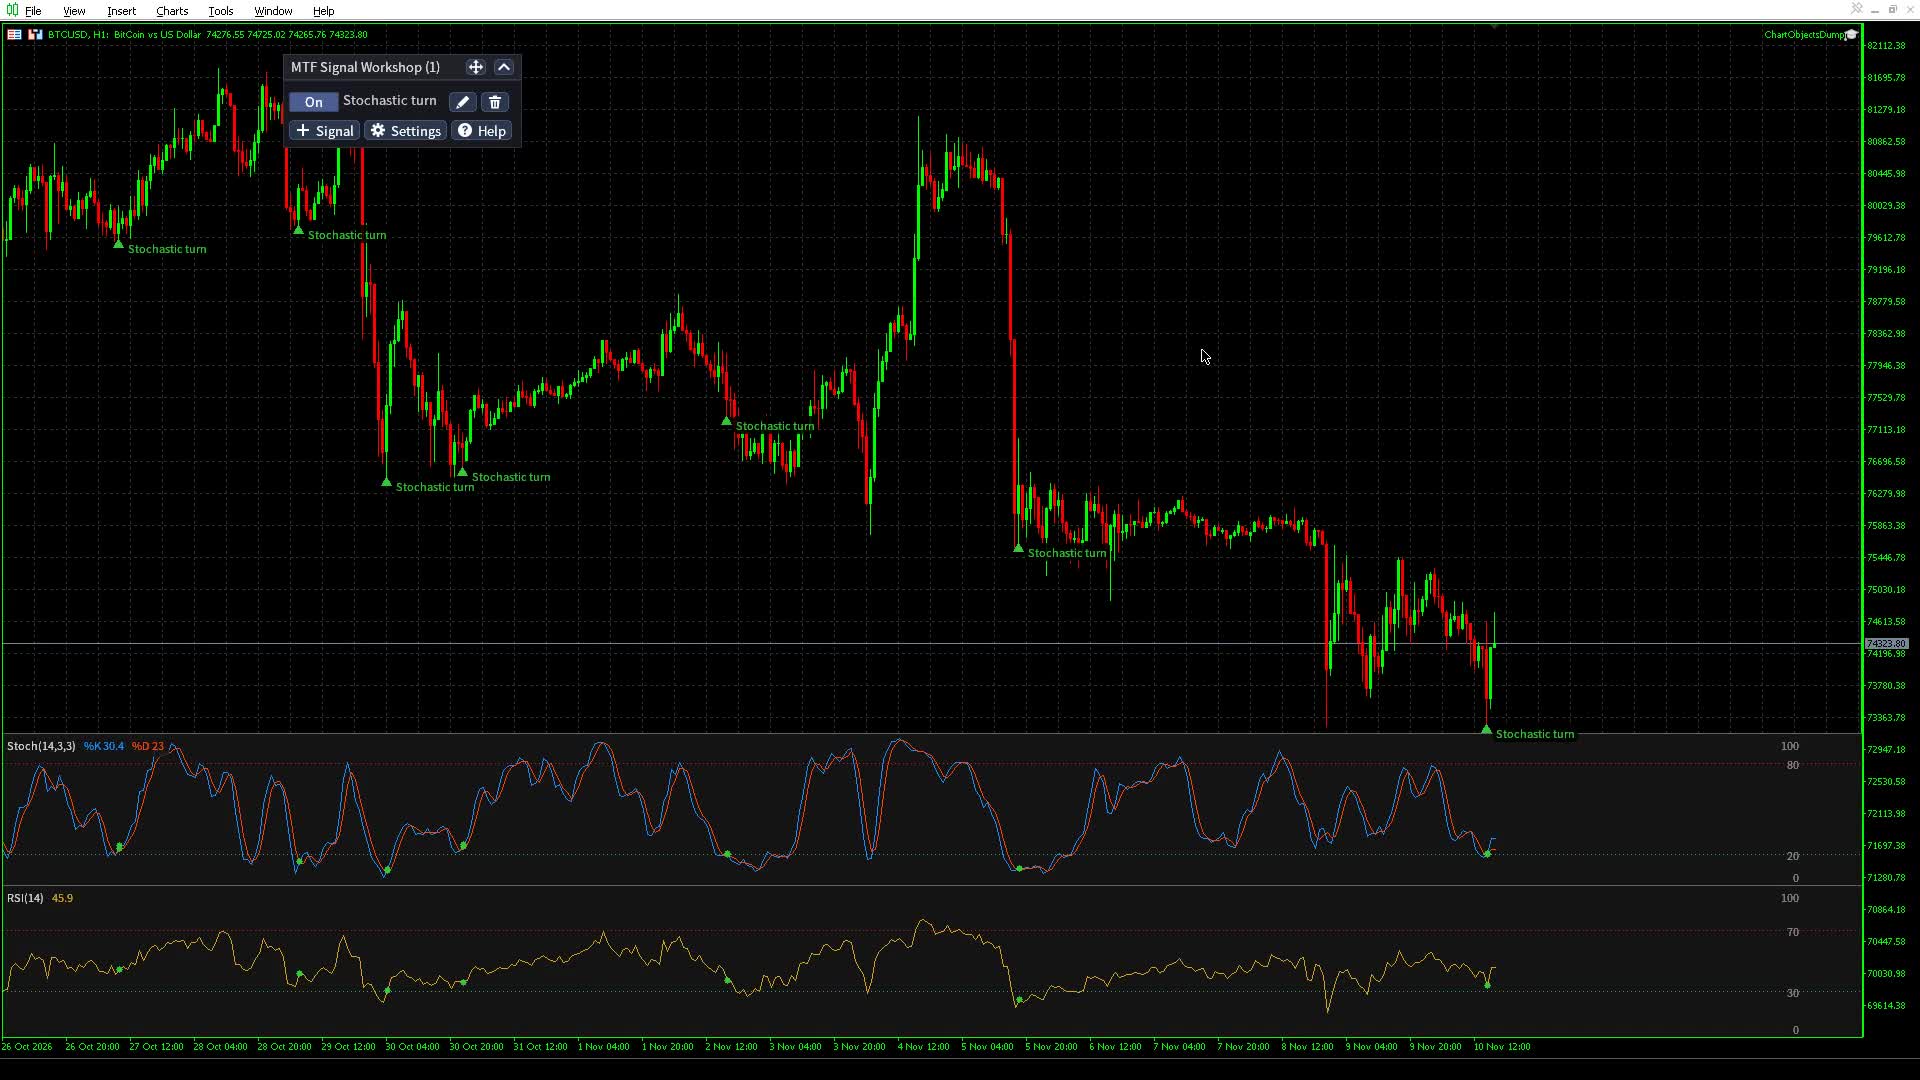
The quickest start is a ready-made file: open one in Notepad, write your own signal over it, and keep it under a new name with File, Save As, so the original stays as it was. A new empty file works too. The file's name without .txt is the signal's name. A name has up to 64 characters, none of \ / : * ? " < > |, and does not start with a dot. In the video I open RSI dip in uptrend.txt and write this over it:
# Turns up from under 30.
marker: bullish

Chart.stoch.is_cross_up
and Chart.stoch.k < 30
Then File, Save As, and the new name, Stochastic turn.txt:
- Lines starting with # are comments. A # anywhere else starts a comment that runs to the end of its line.
- marker: bullish or marker: bearish, in any case, before the rule, sets the arrow. Without it the signal is bullish. After the rule has started, a marker: line counts as rule text and the rule does not compile.
- Everything else is the rule, over as many lines as you like, with spaces and tabs for layout.
Save the file. It shows under Load from file at once; pick it and Save, and its firings appear.
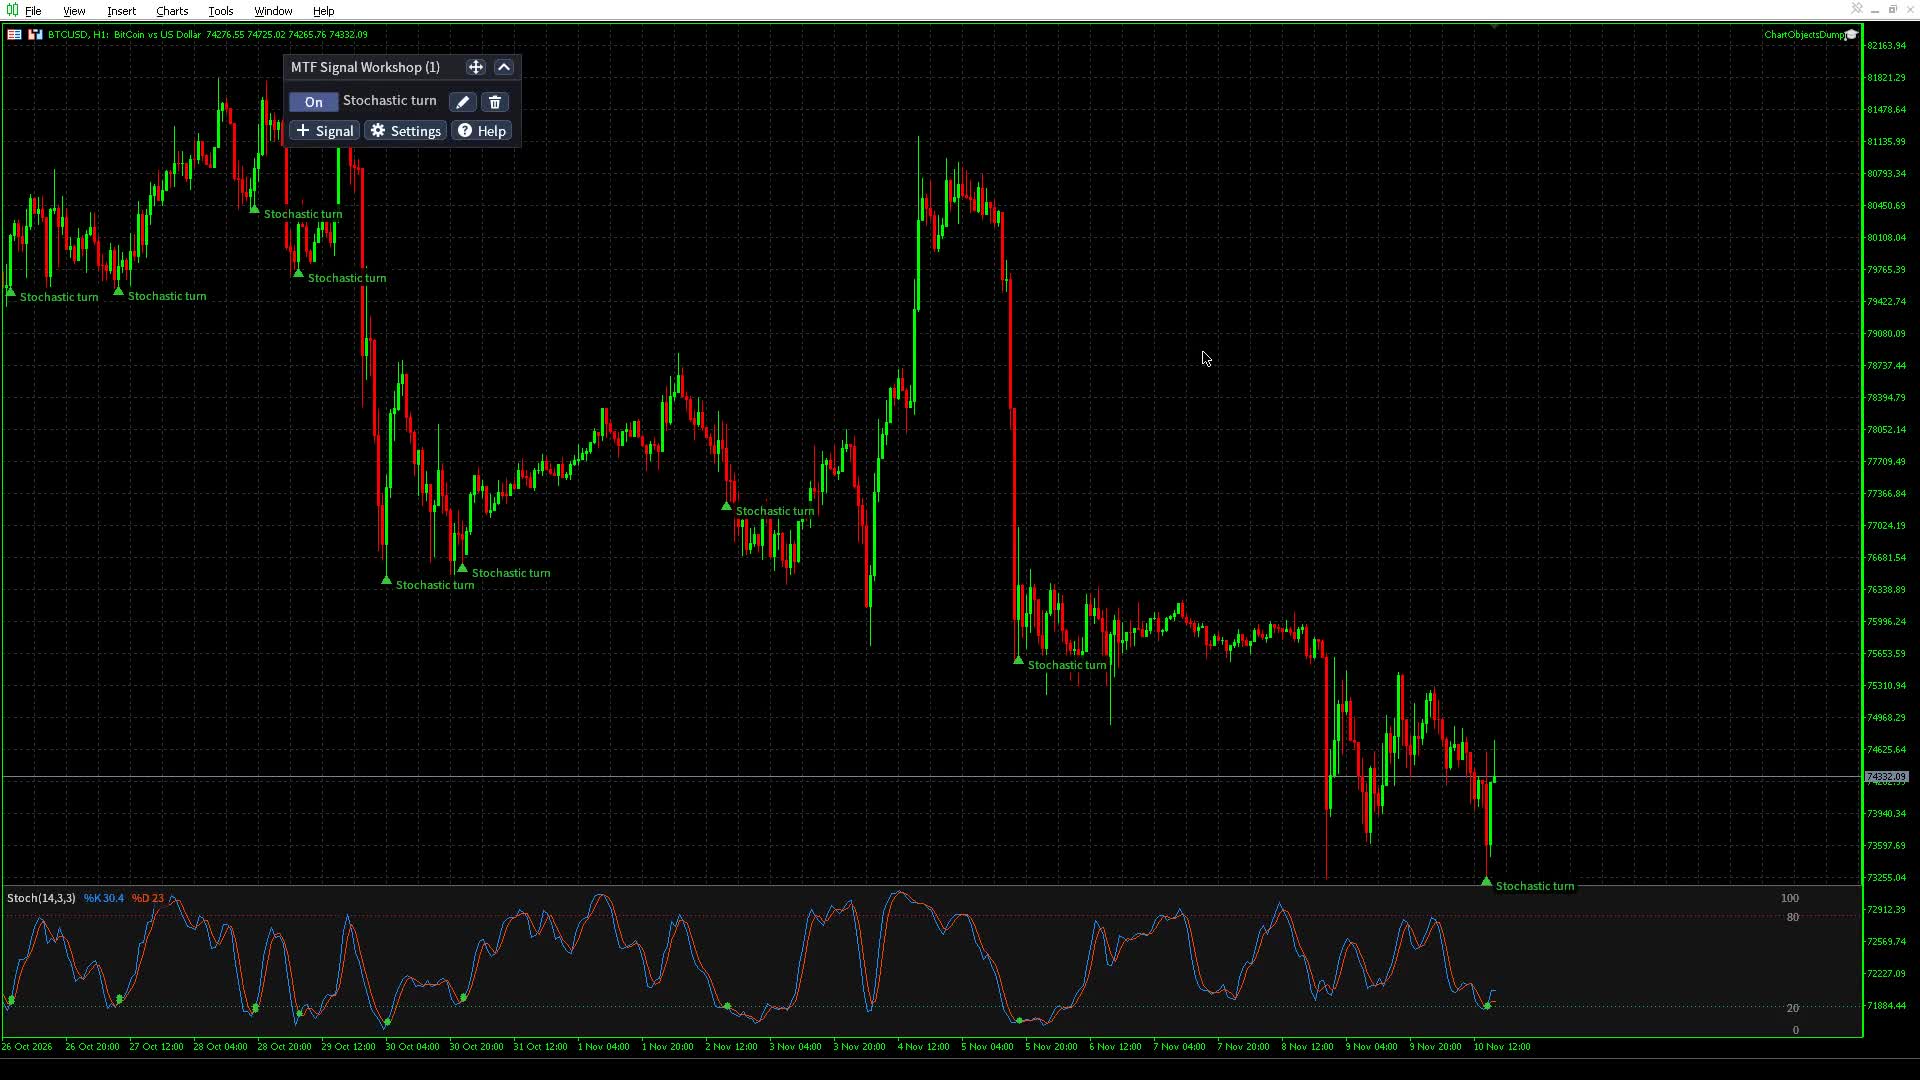
Change the file and save it again, and within a few seconds every chart running it reloads it and draws the new firings and the indicators the new rule reads, with no click in MetaTrader. In the video a third line, and Chart.rsi.value < 45, keeps only the turns where RSI is low too.
A rule that does not compile opens in the editor as text with the reason, and Save refuses it until the file is fixed.
Every rule that compiles opens in the editor as cards. A piece the condition editor cannot build by clicks, such as math between lines (abs(H4.price.value - H4.ema50.value) / H4.atr.value < 0.5), shows its text on its card and edits as text. A chart edit box holds only 63 characters and MetaTrader gives programs no clipboard, so change long pieces in the file.
Share a signal
Send the file by email, chat or anywhere. Whoever puts it in their signal directory finds it under Load from file.
9. The rule language
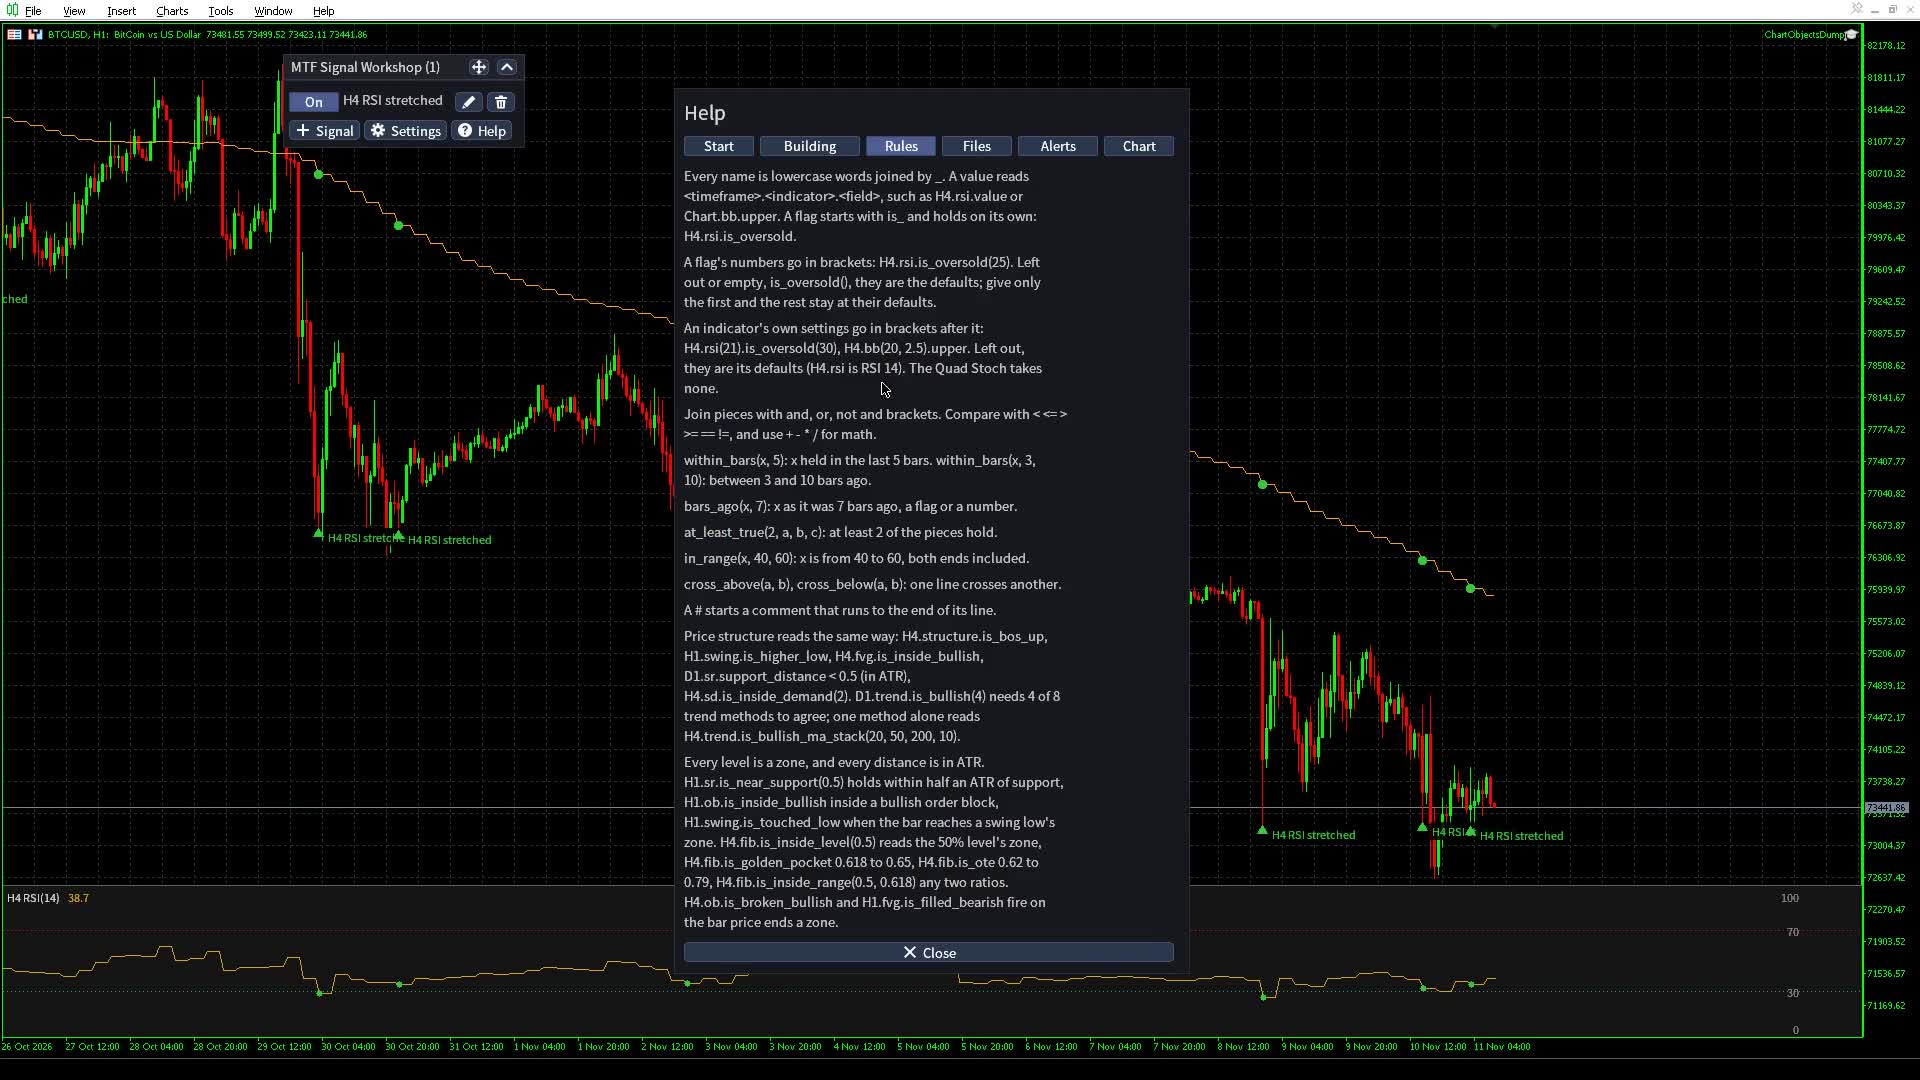
Every signal is a rule in a small text language, which the cards write for you and a signal file takes as you type it. A value is named <timeframe>.<indicator>.<field> (H4.rsi.value, D1.ema200.is_above), pieces join with and, or and not, and functions such as within_bars, bars_ago and at_least_true look back in time or count. The Help dialog's Rules page sums it up.
The whole language, with every indicator's lines and flags, the exact definition and source of each, the price structure rules and ready-to-paste examples, is in the second post: Multi Timeframe Signal Workshop: rule language and indicator reference.
10. The settings file
The list of signals a chart runs, and how each alerts, is one JSON file a person can edit by hand: MTFSignalWorkshop\<symbol>.json in the terminal's Files directory, one per symbol, or MTFSignalWorkshop\<set>\<symbol>.json with a Signal set input (section 11). It names each signal by its file and holds no rule text, which the signal files keep:
{
  "alerts": {"alert": true, "sound": false, "push": false, "email": false},
  "rules": [
    {"signal": "RSI dip in uptrend"},
    {"signal": "Quad stoch all overbought", "enabled": false},
    {"signal": "DMI cross up with ADX over 25", "minBars": 20, "alerts": {"alert": false}}
  ]
} - alerts at the top are the defaults Settings edits: alert, sound, push and email (true or false), upColor and downColor.
- rules lists the signals in panel order. {"signal": "<name>"} runs the signal file of that name.
- enabled is the panel's On/Off switch, minBars the signal's Min bars between signals. They are written only when they differ from On and 10.
- A signal written in place instead of in a file is {"name": "Top", "expression": "D1.rsi.is_bear_div", "direction": "bearish"}, with direction bullish (the default) or bearish. Save without Save to file writes this.
- A rule's own alerts override the keys they name; they are written while its Own alerts switch is on. A rule with every switch off only marks the chart.
- Keys left out take their defaults, so a file with only rules works.
The indicator checks the file every two seconds and reloads it when another chart or a text editor changed it; while one of its dialogs is open it waits, so an edit in progress is never replaced. A file that no longer reads is moved aside to <name>.unreadable-<time> with an alert that says why, and the signals stay as they were.
11. Inputs
| Input | Default | What it does |
|---|---|---|
| Bars of history searched for signals | 1000 | How many chart bars back firings are looked for and marked, at least 50. |
| Show | Markers and indicators | Markers and indicators draws every indicator the signals read; Markers only draws the arrows and what held over the candles. |
| Signal set (empty: the symbol's own signals) | empty | Like an expert's magic number: charts on the same set share one list of signals and follow each other's edits; another set keeps its own list and alert state. Up to 32 letters, digits, - and _. The signal files are the same for every set. |
| Rules file in Common\Files | empty | Strategy Tester only, see section 12. |
12. The Strategy Tester
The Strategy Tester runs the indicator in its own sandbox, which sees only the Files directory every terminal shares: Common\Files, two levels up from the terminal's data directory. With nothing there, the indicator shows six of the ready-made signals: DMI cross up and down with ADX over 25, Strong bullish and bearish trend agreement, and Break of structure with bullish and with bearish trend. An indicator gets no chart clicks in the tester, so the panel cannot add signals there.
To test your own signals, copy the chart's file MTFSignalWorkshop\<symbol>.json and the MTFSignalWorkshop\Signals\ directory from the terminal's Files to Common\Files, keeping the same paths. To test another set, put it there under any name and type that name in Rules file in Common\Files.
13. Limits and MT4 differences
There is no limit on the number of signals, their length or the indicators they read, and every signal is evaluated, fires and alerts. Drawing has a limit: 32 lines over the candles and 32 indicators per chart. Signals claim drawing in list order; one whose indicators no longer fit draws only its markers, and the panel says so under it. The price structure ids draw boxes and labels, not lines, so they do not count against the 32 lines.
MetaTrader 4 runs everything shown here, on its nine timeframes. It cannot fill areas, so the Ichimoku cloud and the Bollinger, Keltner and Donchian bands show their lines without a fill.
14. Troubleshooting
- A rule does not compile. The editor shows the reason and where it is. The usual causes: a name with two parts instead of three (H4.rsi for H4.rsi.value), an uppercase field or a lowercase timeframe (h4.RSI.value), a number alone as the whole rule, a comparison after not without brackets, or a marker: line after the rule has started.
- A signal is paused and says its file may be missing. Its file was deleted or renamed. Save it again from its editor with Save to file, or put the file back.
- A new file does not show under Load from file. It must end in .txt and sit in the signal directory itself, not in a directory under it.
- A signal draws only markers. The indicators it reads do not fit in the 32 lines. Switch off or remove a signal above it, or set Show to Markers only.
- No firings on a new chart. The signal may simply not have fired in the bars searched. Raise Bars of history searched for signals, or try another timeframe.
- A settings file does not read. A file edited by hand that is no longer valid JSON is moved aside to <name>.unreadable-<time> with an alert saying why, and the signals stay as they were.
For questions or problems, write in the Comments tab of the product page or send me a private message on MQL5.