How to Use Chart Drawing Tools in MT4 and MT5 with Multi Risk Manager Pro

Suppose you mark a support zone on an H1 chart. You want its boundaries to match two exact prices, its label to explain why you marked it, and its shading to disappear when you switch to M5. The next time you draw a similar zone, you want to reuse the same settings without rebuilding it from scratch.
The TOOLS toolbar in Multi Risk Manager Pro lets you do all of this directly on a MetaTrader chart. It includes 43 drawing tools in eight groups, with controls for anchor points, levels, labels, styles and timeframe visibility. This guide uses one support zone and one Fibonacci retracement to show how those controls work in practice.
Multi Risk Manager Pro for MT5 · Multi Risk Manager Pro for MT4 · MQLEXP public channel on MQL5
1. Open the Drawing Toolbar
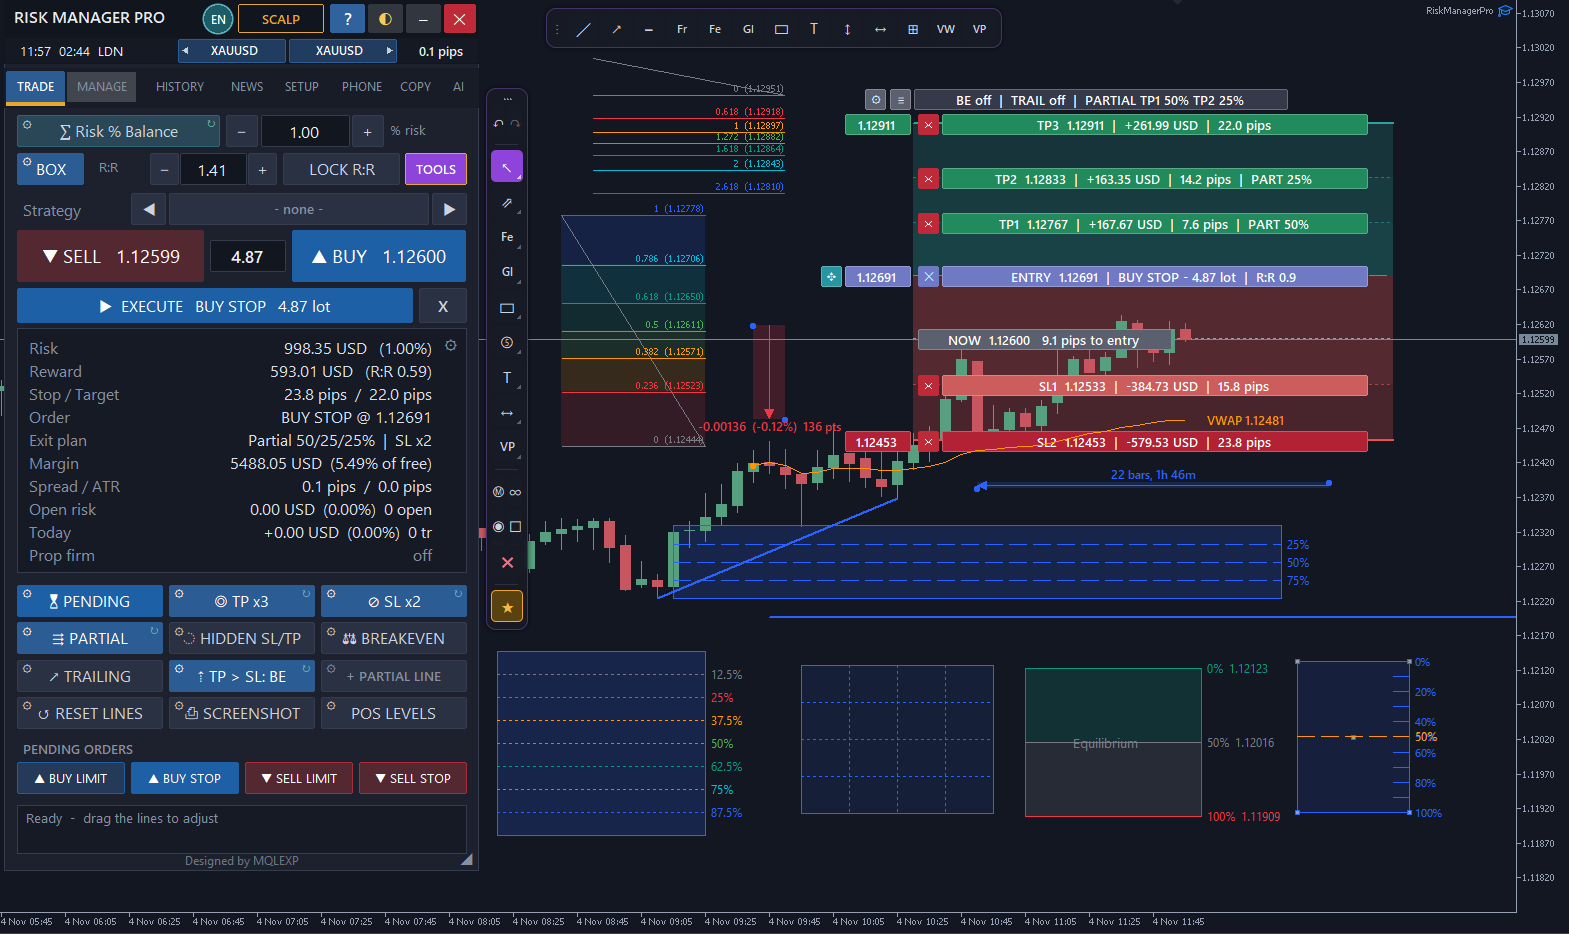
Open TRADE and click TOOLS at the right end of the R:R row. The button turns amber and a floating toolbar appears along the left edge of the chart. Drag it to a convenient position or dock it at either side. If the buttons are too small for your display, open SETUP → Panel → Drawing tools size %. The available range is 70% to 160%.
Click a group button to see its tools. After you choose one, the button displays the last tool you used from that group. The status bar shows how many points to place: one click for a horizontal line, two for a trend line and three for a triangle. For Brush and Highlighter, hold the mouse button while drawing.
2. Find the Right Tool for the Job
| Group | What you can do on the chart |
|---|---|
| Lines | Mark a price with a horizontal line or ray, connect swing points with a trend line, or mark a time with a vertical line. |
| Fibonacci | Draw retracements, expansions, channels, time zones, speed resistance fans and arcs. |
| Gann | Place a Gann line, fan or box using the anchor points you choose. |
| Shapes | Mark a zone with a rectangle, triangle or ellipse. Use Brush or Highlighter for freehand annotations. |
| Patterns | Label Elliott impulse and corrective waves, ABCD, XABCD or head-and-shoulders structures by placing their points manually. |
| Notes | Attach text, a price note, a callout or a directional marker to a specific part of the chart. |
| Measure | Measure a price range, a date range or both together. Use Measure for a temporary reading that clears on the next chart click. |
| Volume | Place an Anchored VWAP, a Fixed Range Volume Profile or an Anchored Volume Profile. |
3. Draw a Support Zone and Set Its Exact Boundaries
- On an H1 chart, open TOOLS → Shapes → Rectangle. Click the upper-left and lower-right corners of the area you want to mark.
- On the pinned bar, use the STYLE arrows to select Demand. Click the rectangle to open it for editing. Its handles show which points you can move.
- Open the drawing settings and select Points. Enter the time and price of each corner. For example, if your zone extends from 1.08400 to 1.08500, entering those values removes the small differences that can occur when placing points with a mouse.
- Under Text, add a label such as Previous H1 support. Under Style, reduce the fill opacity until you can read the candle bodies inside the zone.
- Open Show and clear Minutes. Leave the hour and higher timeframes you want selected, then click Done.
Switch from H1 to M5 and back. The zone should disappear on M5 and return on H1 with the same boundaries. To keep that appearance for future zones, open Style and save it under a recognizable name, such as H1 Support. A named style is especially useful when you want the same fill, border and labels across several symbols.
4. Customize a Fibonacci Retracement
Open Fibonacci → Retracement and place its two anchors on the swing you want to study. If an anchor should sit on a candle’s high or low, select Weak or Strong under Magnet. Magnet snaps drawing points to nearby bar open, high, low or close prices. For an exact time and price, use Points.
Open Levels to choose which percentages appear. You can enable or hide individual levels, change their colors, and add or remove values. For example, if your analysis uses only 38.2%, 50% and 61.8%, leave those three visible so they are easy to distinguish. The built-in Golden pocket style offers another starting point.
Click the star beside Retracement to pin it to the top bar. Next time you need it, you can select it directly. The Stay control keeps the tool active when you want to draw several retracements in succession. Press Esc when you finish.
5. Edit, Hide and Recover Drawings
Drawings are locked by default to help prevent accidental movement. Click a drawing, its fill, a level or its label to open it for editing. Drag the visible handles, then click Done or press Esc. To drag drawings directly, use the toolbar lock control.
| Shortcut | Action |
|---|---|
| Ctrl+Z | Undo the previous drawing action |
| Ctrl+Y | Redo an action |
| Ctrl+L | Lock or unlock drawings |
| Ctrl+H | Hide or show drawings |
| Esc | Stop drawing or close the current edit |
Closing the TOOLS toolbar leaves your drawings on the chart. If you want a temporarily clear view, use Hide. If you want to remove the drawings, use the toolbar’s delete control. Drawings are stored per symbol and use the prefix RMPDRAW_ in MetaTrader’s Objects List, which also makes them identifiable after the EA has been removed.
6. Use Drawings Alongside the R Box
Return to the H1 support zone from the example. The rectangle records the area you marked, while the Fibonacci levels show how the selected swing is divided. If you decide to prepare an order, open the R Box and set the proposed entry, Stop Loss and Take Profit there.
Each object has its own purpose. Dragging the rectangle’s lower edge revises your analysis. Moving the stop level in the R Box changes the proposed trade and can change its calculated volume. Before submitting an order, check the prices and volume in the trade panel. The TOOLS drawings themselves only annotate the chart.
MT4 display note: The workflow is shared across MT4 and MT5, with a few visual differences. MT4 draws Elliott waves as lines with point labels, places filled shapes in the background, and lists its supported timeframes from M1 to MN in Show. If a filled rectangle looks different between terminals, compare its boundary prices in Points and its fill settings in Style.