Regular divergence for reversals, with the overbought / oversold filter
9 November 2026, 11:13

0
12
Regular divergence is one of the oldest warnings in technical analysis: price makes a new extreme, momentum does not. Traders read it as a move running out of steam. Finding it by hand across dozens of charts is slow. The DuoFX Divergence Scanner scans 28 pairs and gold on up to 9 timeframes in one grid. Setup is in the user manual.
What regular divergence is
- Regular bearish: price makes a higher high, the oscillator makes a lower high. Momentum is fading as price pushes up.
- Regular bullish: price makes a lower low, the oscillator makes a higher low.
- It is a warning that a move may be tiring. It is not a guarantee of a turn. In a strong trend, divergence can appear again and again while price keeps going.
Why the overbought / oversold filter helps
- A lot of divergence appears in the middle of a range, where nothing is stretched. Many traders treat those as weaker signals.
- The filter keeps regular divergence only when the oscillator was stretched: a bearish one needs a swing high in overbought, a bullish one a swing low in oversold.
- In the scanner it is on by default. Levels: RSI 70/30, Stochastic 80/20, CCI +100/-100. MACD, OsMA and Momentum use an adaptive zone: the top or bottom 20% of the last 200 closed bars.
- You can ask for one swing point in the zone (default) or both.
- Fewer signals, in exchange for more selective ones. It is a filter, not a promise of quality.
Step 1: set up the scan
- Oscillator: RSI is the default and the easiest to read. Try MACD or Stochastic if you prefer.
- Timeframes: pick the ones you trade. Defaults are M5, M15, M30, H1, H4, D1, W1.
- Leave the overbought / oversold filter on. By default it applies to regular divergence only.
- Click the filter button until it shows Regular. The filter shows one view at a time (All, Regular, Hidden, Bullish, Bearish): Bullish and Bearish include hidden cells too, so for one side of regular divergence stay on Regular and read the colour and arrow.
Step 2: read the grid
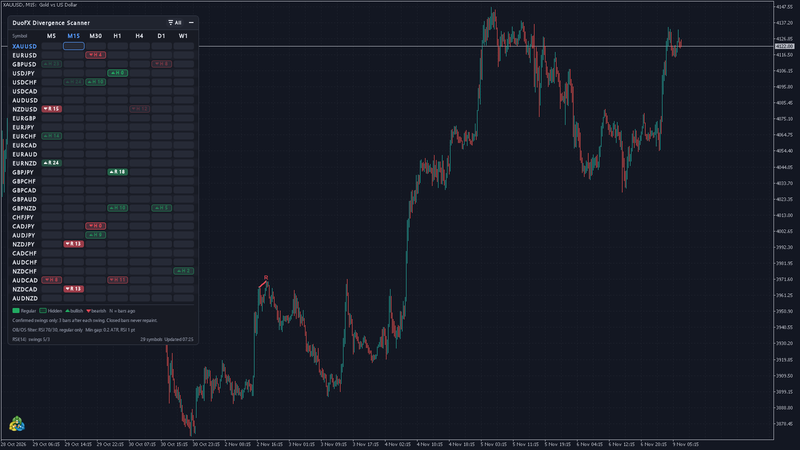
- Solid green cell: regular bullish. Solid red cell: regular bearish.
- The number is how many bars ago it was confirmed. Fresh ones are bright. They fade and drop off with age.
- Look for the same symbol with signals on two timeframes, for example M15 and H1.
Step 3: click through and judge the chart
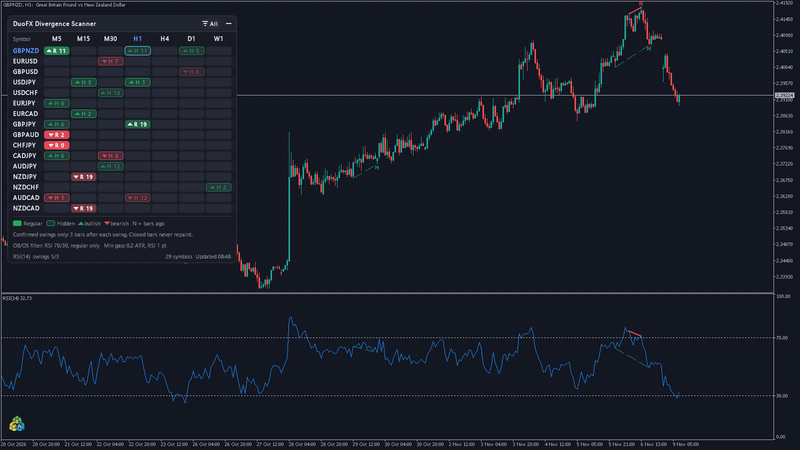
- Click a cell. Your chart switches to that symbol and timeframe, with the oscillator pane and the divergence drawn on price and in the oscillator.
- Ask:
- Is price at a level that matters, such as a previous high or low, or a round number?
- Is the trend strong? In a strong trend a reversal signal is riskier.
- Is there room to move before the next obstacle?
Step 4: wait for confirmation and plan the trade
- The scanner confirms a swing only after the bars you set have closed (3 by default). That is how it avoids repainting, and it means the signal comes a little after the turn. Price may already have moved.
- Many traders wait for their own confirmation: a break of the last swing, or a close back inside a range.
- Put the stop beyond the swing that made the divergence. If that stop is too wide for your risk, skip the trade.
- Alerts: popup, push, email and sound are available, and each signal alerts once.
Common mistakes
- Taking every divergence. Without a level or context it is noise.
- Fading a strong trend on the first signal.
- Using only one timeframe.
- Ignoring news. A major release can override any divergence.
- Turning the filter off to see more signals, then trading all of them.
Risk note
Divergence is a warning, not a forecast. It fails often, especially in trends. The scanner flags setups and never trades. This article is education, not financial advice, and promises no result. Test on a demo account, and size every trade so a stop-out is acceptable.