Momentum Confluence for MT4 and MT5: How to Read the Score, Signals and Trade Levels of Supreme Momentum Confluence

1. Introduction
Momentum is easy to look at and hard to weigh. One oscillator says a move has room, another says it is stretched, a third has not turned yet, and six separate windows leave you to settle the argument by eye, a little differently every time. Do the readings agree? Is momentum turning, or only pausing? When is a cross worth your attention?
Supreme Momentum Confluence answers those questions by fixed rules and draws the answers. It puts six momentum and money-flow readings on one scale and blends them into a single score from -100 to +100. Instead of six separate windows, you read one line, its signal line, and how many of the six agree with the move. A signal needs the score to cross its signal line with enough agreement behind it. Each signal maps an ATR stop and three targets, the candles take the score's colour, and a dashboard shows the state of every component and filter.
This guide explains the rule behind every part of the picture, shows how to read it, and ends with a read of any chart in about ten seconds. The two diagrams (Figures 2 and 4) and the checklist (Figure 8) illustrate a rule; Figures 1, 3, 5, 6 and 7 are real MetaTrader charts.
2. What It Draws
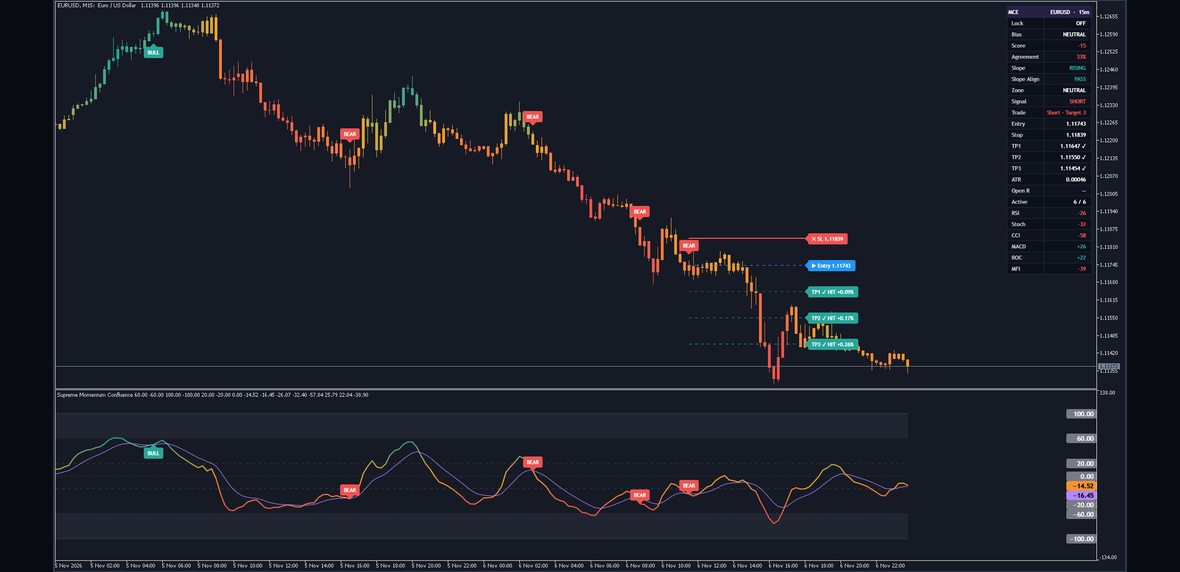
Figure 1. The indicator on a MetaTrader chart: the score and its signal line in the indicator's own window, and on the price chart the coloured candles, the markers, the current trade's levels and the dashboard.
The indicator has its own window below the chart, and it also draws on the price chart.
In its own window:
- The Momentum Score, coloured by a gradient: green toward +60, amber around zero, red toward -60.
- The signal line, in violet, a 9-bar EMA of the score.
- The zones, shaded from +60 up to +100 and from -60 down to -100, with dotted lines at their inner edges.
- The threshold lines, dashed at +20 and -20, with a dotted line at zero and solid lines at +100 and -100.
- BULL and BEAR markers on accepted signals.
- A value tag for every level, the score and the signal line. The value tags stand at the indicator window's right edge, because an object cannot sit on MetaTrader's price scale. A tag that would touch the one above it moves down, so it can sit a little away from its value.
- Six component lines, one per reading, off by default (Components).
On the price chart:
- Candles coloured with the same gradient as the score.
- BULL and BEAR markers, BULL below the signal bar and BEAR above it.
- The current trade: stop, entry and three target lines, each with a label that prints its price. Only the current trade is drawn.
- A dashboard with the state of every component and filter. It can move to any corner or into the indicator's own window.
Both windows are painted with real transparency and exact colours, and the painting follows every scroll, zoom and price-scale change.
One rule about time runs through the whole guide. Signals are decided on the closed bar and do not change afterwards. On the forming bar the score and the dashboard move with every tick, and a target can be touched; markers, the stop and a new trade wait for the closed bar, and what a bar shows is final when it closes.
3. How to Read the Score
The six readings. Each one is rescaled to a score from -100 to +100, so that all six speak the same language.
- RSI over 14 bars (RSI Len): the RSI minus 50, times 2.
- Stochastic over 14 bars (Stoch Len), smoothed by a 3-bar average (Stoch Sm): minus 50, times 2.
- CCI over 20 bars (CCI Len): divided by 200 (CCI Sat) and multiplied by 100, held at 100 either way.
- MACD histogram with lengths 12, 26 and 9 (MACD Fast, MACD Slow, MACD Sig): a z-score over 100 bars (Norm Len), which reaches 100 at a z-score of 2.5 (Z Sat).
- Rate of change over 14 bars (ROC Len): a z-score, the same way.
- MFI over 14 bars (MFI Len): minus 50, times 2. MFI reads the bar's high-low-close average and your broker's tick volume, a count of price changes. The other five read Source, the close by default.
The blend. The components that count are averaged by their weights (RSI W, Stoch W, CCI W, MACD W, ROC W and MFI W), 1.0 each by default and anywhere from 0 to 10. A component counts only while it is switched on and has a reading; otherwise it leaves the blend with its weight. MACD and ROC need their own lengths plus Norm Len bars before they read anything, so the first stretch of a calculation runs on fewer than six. The dashboard's Active row shows how many count.
The score and the signal line. The blend passes through the optional Smoothing (None by default; SMA, EMA, RMA, WMA or HMA over Smoothing Length) and then a 3-bar EMA (Smooth). The result is the Momentum Score. A 9-bar EMA of the score (Signal Len) is the signal line.
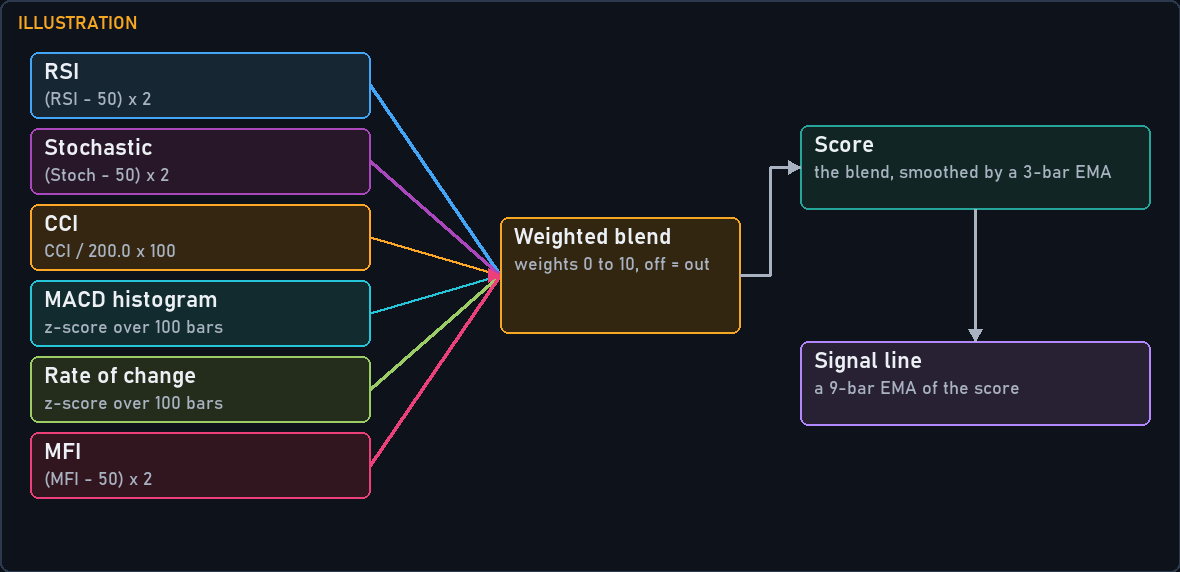
Figure 2. Illustration of the rule: six readings on one scale, averaged by weight, smoothed into the score and followed by the signal line.
Now read the window from the outside in.
Position against zero. Zero is the middle of the scale. Above it the weighted readings lean up, below it they lean down, and the farther from zero, the harder they lean.
The thresholds and Bias. Bias reads BULL at a score of +20 or more and BEAR at -20 or less (Bull Thr, Bear Thr), and NEUTRAL between them. It reads only the level of the score, so a BULL marker can appear while Bias still reads NEUTRAL or even BEAR: momentum has begun to turn but has not left the weak side yet. Whether you want that early turn is your decision; the two are shown apart so that you can make it.
The zones. Zone reads OVERBOUGHT at +60 or more and OVERSOLD at -60 or less (OB Lvl, OS Lvl). These are conditions of stretched momentum, not instructions to act. In a strong move the score can stay in a zone for a long time, and a signal can come from inside one: a BEAR marker inside OVERBOUGHT is a turn from a stretched state, a BULL marker there a fresh cross in a move already stretched.
The signal line. With the score above its line the signal side is bull, below it bear. The gap between the two shows how fast the score is moving away from its own recent average, and a narrowing gap is momentum slowing before any cross happens.
Agreement. The share of the total component weight pointing the same way as the signal side. A component points up when its own score is above zero and down when it is below zero. With all six on at equal weight, each is worth a sixth, so the default of 60 percent takes four of the six. Agreement measures where the components are, not where they are heading, so a cross up that starts deep below zero shows little Agreement.
Slope. The change of the score over 3 bars (Slope Len), shown as RISING, FALLING or FLAT. One bar's move is enough to make a cross. Slope asks whether the move holds over a few bars: a one-bar dip through the line, in a score still higher than it was 3 bars ago, is a cross down with a RISING slope.
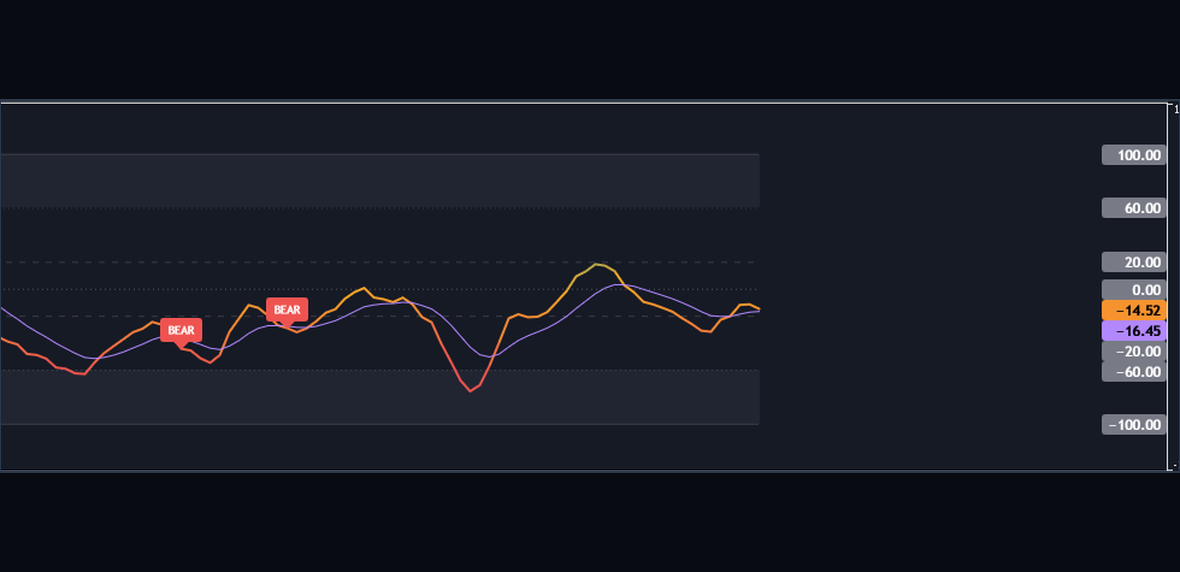
Figure 3. The indicator's window on a real chart: the score in its gradient, the violet signal line, the shaded zones, the threshold lines and the value tags at the window's right edge.
4. How a Signal Is Accepted
A cross of the score over its signal line is only a candidate. A cross up means the score closes above its line after being at or below it on the bar before; a cross down is the mirror image. The candidate becomes a BULL or BEAR marker only if every active test below passes on the closed bar.
- Agreement. At least 60 percent of the component weight points the same way (Min Agree %, 60).
- Slope Align (on). A BULL needs the score rising and a BEAR needs it falling over the last 3 bars (Slope Len). A flat slope blocks both.
- Higher TF Confirm (off). On Higher TF, D1 by default, Bias must read BULL for a BULL and BEAR for a BEAR; NEUTRAL blocks both. The state comes from the last closed bar of that timeframe, worked out with the same settings, so it never looks ahead. The chart's own timeframe reads the chart's own Bias. A lower one is skipped, every signal passes and the dashboard row reads SKIPPED. Until that timeframe has a Bias at all, the filter blocks signals.
- Strength Filter (off). The ADX over 14 bars (ADX Length) must be at or above 20 (ADX Threshold).
- A valid stop. The ATR must have a value and the stop distance must be more than one tick. Without that there is no marker and no trade.
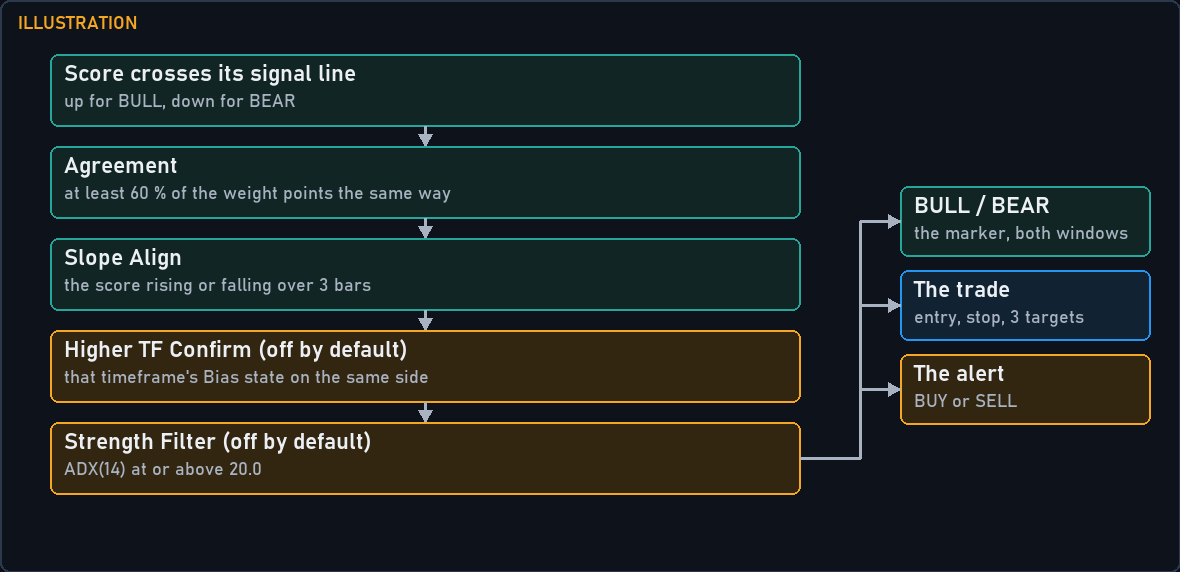
Figure 4. Illustration of the rule: the cross is a candidate, and every active test must pass on the closed bar before the marker, the trade and the alert appear.
When a candidate passes, three things happen together on that closed bar: BULL or BEAR is drawn in both windows, the trade levels are armed, and the BUY Signal or SELL Signal alert fires. When it fails, nothing is drawn and nothing fires.
The forming bar. The score moves with every tick, so a cross can appear on screen and go away again before the bar closes. Only the close counts, and MetaTrader reports it with the next bar's first tick. The marker therefore sits on the bar that closed, and it appears as the next bar opens.
Reading a missing marker. Agreement, Slope Align, Higher TF and Trend Strength each have a dashboard row, so on the newest bar a refused cross explains itself. For an older bar, the Data Window (Ctrl+D) lists the score, the signal line and each component's score.
What the filters trade. A lower Min Agree % or Slope Align off lets more crosses through; Higher TF Confirm, Strength Filter or a Smoothing method let fewer through. A filter says nothing about what comes after the crosses it keeps, so judge any setting on your own market, on a demo account.
Lock Signal (off). It blocks new signals on the live chart while you manage a trade; targets and the stop go on being tracked. It works only on bars that close while the indicator runs: if the indicator calculates again, for example after you change a setting, any signal it finds in the bars behind the newest one is drawn.
5. Candle Colours
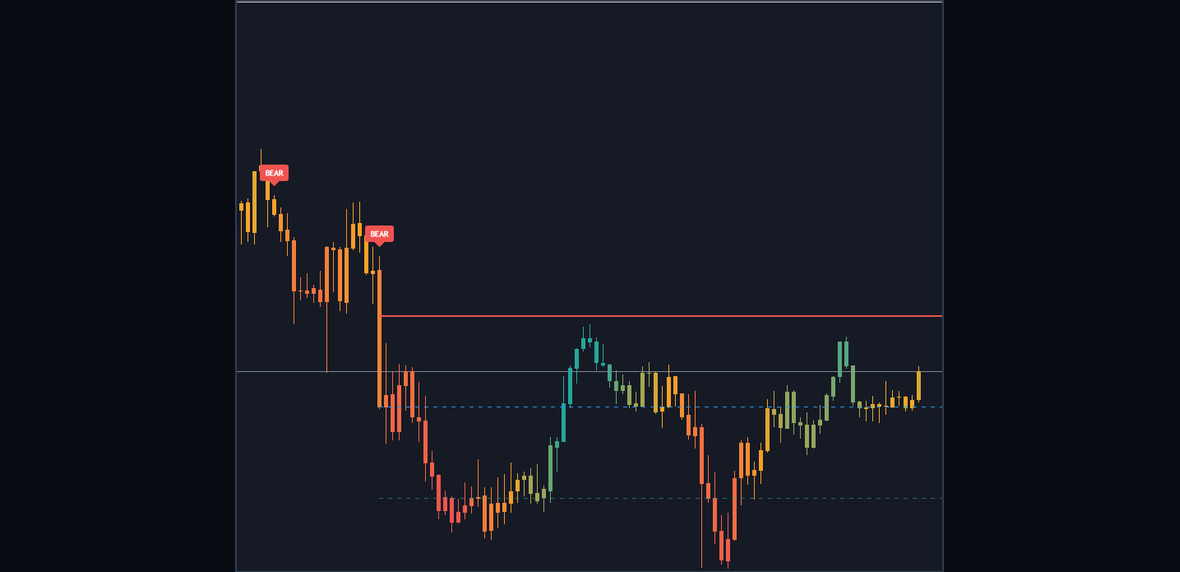
Figure 5. The price chart with its candles in the score's colour, and BULL and BEAR markers on the signal bars.
With Candle Color on, every candle takes the colour of the score on its bar: body, border and wick. The gradient is the one in the window: Neutral (amber) at zero, toward Bull (green) at OB Lvl (+60), toward Bear (red) at OS Lvl (-60), and the full colour beyond those levels. The newest candle moves with the score until the bar closes.
The colour says where the score is, not which way the bar went. A falling candle can be green while the score stays high, and a rising one red while the score stays low, so you can read momentum on the price chart without looking down at the window.
Three things to look for:
- Amber candles. The score is near zero and momentum has no side.
- A fade. Candles going from full green toward amber mean the score is coming back toward zero, whatever the candles' direction.
- The colour of a signal bar. A BULL can sit on an amber or even a red candle, because the score can still be below zero when it crosses.
Switch the colouring off with Candle Color and your chart keeps its own candles.
6. Trade Levels: Reference Levels From the ATR
An accepted signal arms a trade. That is a set of lines and labels that the indicator tracks, not an order: it does not place trades, and these are reference levels, not a forecast.
- Entry: the close of the signal bar.
- Stop: 1.5 times (SL ATR x) the ATR over 14 bars (ATR Length), from the entry.
- Targets: 1.0, 2.0 and 3.0 times that stop distance beyond the entry (TP1 R, TP2 R, TP3 R). Targets set out of order are sorted nearest to farthest, and the dashboard says so.
Because every distance comes from the ATR, the same settings fit a quiet forex pair and a fast index.
A worked calculation, with round illustration values rather than prices read from a chart: a BULL signal bar closes at 1.1000 with the ATR at 20 pips. At the default SL ATR x of 1.5 the stop distance is 30 pips. The trade is Entry at 1.1000, SL at 1.0970, TP1 at 1.1030, TP2 at 1.1060 and TP3 at 1.1090: a 30 pip stop against 30, 60 and 90 pips to the targets. A BEAR signal mirrors it, with the stop above the entry and the targets below.
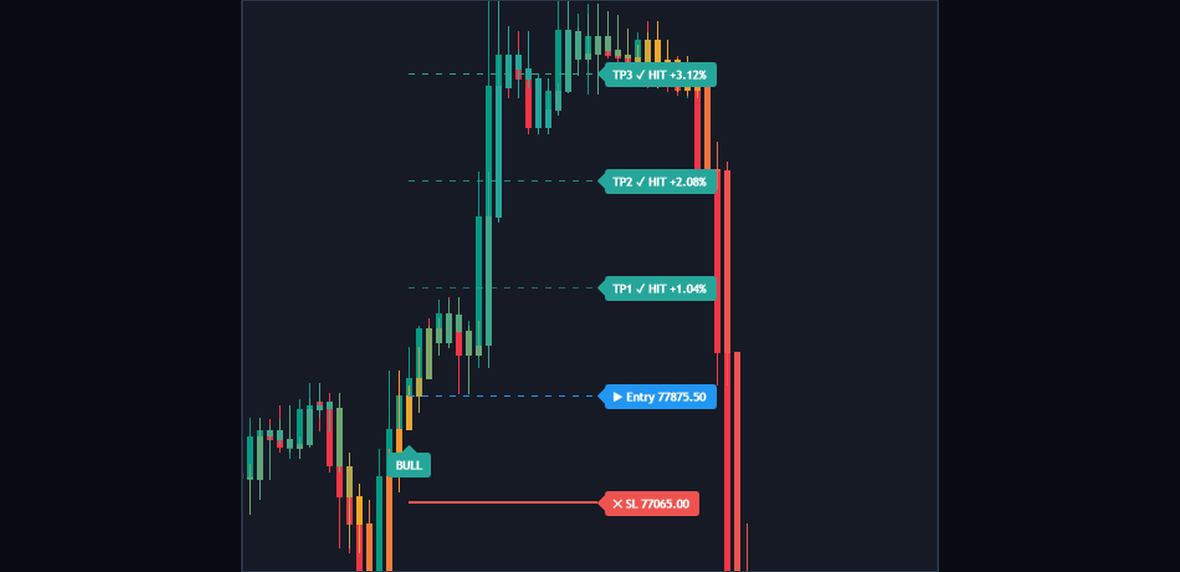
Figure 6. A trade on the price chart: the stop, the entry and the three targets drawn from the signal bar on, each with its label.
How they are drawn. From the signal bar on, the stop is solid and 2 px wide, the entry and the targets dashed. Each label prints its price. Targets that would print the same price share one label, such as TP1 / TP2.
How they are tracked.
- A target counts on the touch. The high or the low only has to reach it, on any tick of a bar after the signal bar. Its label changes to a check mark with the word HIT and the distance from the entry in percent. TP1 and TP2 leave the trade open. TP3 closes it.
- The stop counts only on a close beyond it. A wick through the stop does not end the trade. When a close beyond it does, the stop label changes in the same way, with that close's distance from the entry.
- Targets are checked first. A bar that touches TP3 and closes beyond the stop counts as TP3.
- A new signal replaces the trade that is open, with its lines and labels.
- A signal on the same side as a trade that closed on that very bar is not taken: no marker, no new trade, no alert. A signal on the other side is.
Where the labels sit. A trade's labels sit ten bars past the last bar, so give the chart some room on the right with the chart shift, or switch on Pin Labels Inside Chart (off by default) to pull them in. A closed trade's labels sit ten bars past its closing bar. The dashboard lists the same levels.
Three ways to use them.
- Measure from your own fill. You can only act after the signal bar's close, at another price and with a spread. Say your fill is 1.1006. From there the stop is 36 pips away and TP1 only 24, so work out your own distances before you decide anything.
- Use the targets as checkpoints. Decide before entering what you do at TP1: take part off, move your own stop, or hold for TP2 and TP3. The decision and the order are yours.
- Know what the stop line means. It counts on a close, and a stop order at your broker fills on the touch. If you place one at the same price, a wick the indicator ignores can still close your position.
The levels take no account of spread, slippage, commission or position size. Size the position from the stop; the stop distance changes with the ATR, so it differs from one signal to the next.
7. The Dashboard, Row by Row
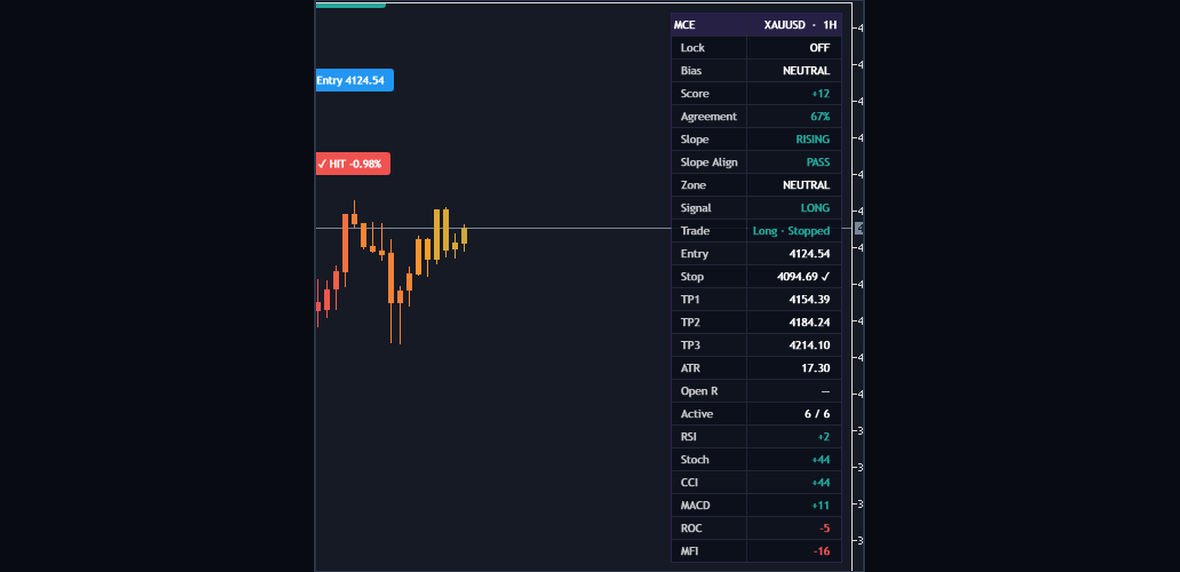
Figure 7. The dashboard on the price chart: the state of the score, the current trade and each component's score.
Show Dash switches it, Position chooses the corner and Show on Price Chart puts it on the price chart or in the indicator's own window. Hover a row and a tooltip says what it means. Rows for optional filters show only while those filters are on, and every row reads the newest bar, so on the forming bar it can still change.
| Row | What it says |
|---|---|
| Header | MCE, the symbol and the timeframe. |
| Lock | ACTIVE or OFF, the state of Lock Signal. |
| Bias | BULL, BEAR or NEUTRAL, from the score's level. |
| Score | The score as a whole number with its sign. |
| Agreement | The share of the weight on the signal side; bull colour when it meets Min Agree %, bear colour when not. |
| Slope | RISING, FALLING or FLAT over Slope Len bars. |
| Slope Align | PASS or BLOCK, while Slope Align is on. PASS means above the line and rising, or below it and falling. |
| Higher TF | PASS, BLOCK or SKIPPED, while Higher TF Confirm is on. |
| Trend Strength | The ADX, while Strength Filter is on; bull colour at or above ADX Threshold, bear colour below. |
| Smoothing | The method and its length, when Smoothing is not None. |
| Zone | OVERBOUGHT (in the bear colour), OVERSOLD (in the bull colour) or NEUTRAL. |
| Signal | LONG, SHORT or NONE, the side of the last accepted signal. |
| Trade | Long or Short, then Open, Target 1 to 3 or Stopped; Flat until the first signal. |
| Entry | The close of the signal bar. |
| Stop | The stop level, with a check mark once a close has gone beyond it. |
| TP1, TP2, TP3 | The targets, each with a check mark once touched. |
| ATR | The ATR on the newest bar, the value the next stop would use. |
| Open R | The open trade's result in multiples of the stop distance, at the current close; a dash once the trade is closed. |
| Active | How many of the six components count right now. |
| RSI, Stoch, CCI, MACD, ROC, MFI | Each component's score, bull colour above zero and bear colour below; a dash until it has a reading, OFF when switched off. |
| MACD Lengths | An amber warning when MACD Fast is above MACD Slow: the two are used swapped. |
| Targets | An amber warning when the target multiples were out of order and were sorted. |
Read it in three blocks. Bias to Zone is the state of the score. Signal to Open R is the current trade: Signal keeps the side of the last accepted signal after that trade has ended, while Trade tells you what became of it. Active and the six component rows show what the score is made of right now. With Show Dash off, only the warning rows remain.
8. The Settings Worth Changing
Install the indicator from its Market page (MetaTrader 5: {{MT5_URL}}, MetaTrader 4: {{MT4_URL}}) and attach it with the defaults. All 112 inputs are described in the user manual ({{MANUAL_URL}}); these are the ones that change what you read.
| Input | Default | What changing it does |
|---|---|---|
| Smooth | 3 | Higher slows the score and gives fewer crosses; lower does the opposite. |
| Signal Len | 9 | Higher slows the signal line; lower keeps it closer to the score. |
| Min Agree % | 60 | Lower lets more crosses through; higher asks more of the six to agree. |
| Slope Align | true | Off stops asking for the score to be moving with the cross. |
| Higher TF Confirm | false | On asks a higher timeframe's Bias to be on the same side. |
| Strength Filter | false | On asks for a minimum ADX on the signal bar. |
| Smoothing | None | A method here slows the blend before Smooth, and gives fewer crosses. |
| Bull Thr | 20 | Where Bias starts reading BULL. |
| Bear Thr | -20 | Where Bias starts reading BEAR. |
| OB Lvl | 60 | Where the upper zone starts and the gradient reaches the Bull colour. |
| OS Lvl | -60 | Where the lower zone starts and the gradient reaches the Bear colour. |
| SL ATR x | 1.5 | The stop distance, in ATR. Every target moves with it. |
| TP1 R | 1.0 | The first target, in stop distances from the entry. TP2 R and TP3 R work the same way. |
| Pin Labels Inside Chart | false | On pulls a trade's labels inside the chart. |
| Bars To Calculate (0 = all) | 20,000 | How much history is worked through. A different setting can change the earliest signals. |
Any component can also be switched off or weighted from 0 to 10. Start with the defaults on the timeframe you trade, and change one setting at a time.
9. Worked Examples in Words
These use round illustration values, not prices or readings from a real chart.
Example 1: a BULL that passes
On an H1 chart the score has been under its signal line and turns up. On the closed bar it finishes above the line for the first time. Four of the six components are above zero, so Agreement reads 67 percent, in the bull colour. The score is higher than it was 3 bars ago, so Slope Align reads PASS. With the two optional filters off, that is every test: BULL appears in both windows, the trade is armed and the BUY Signal alert fires.
Now read the rest. The score is still below +20, so Bias and Zone read NEUTRAL: a turn with most components behind it and a score that has not left the weak area. What you do with it is your own plan.
Example 2: a cross that is refused
Later the score closes under its signal line, a candidate on the bear side. Only three of the six components are below zero, so Agreement reads 50 percent, in the bear colour. No BEAR is drawn, no trade changes and no alert fires.
A second case: the score has been climbing and dips for one bar, just under its signal line. That makes a cross down, but the score is still higher than it was 3 bars ago, so Slope Align reads BLOCK. Five components sit above zero, so Agreement on the bear side reads low as well.
Example 3: a trade from signal to stop line
Take the trade from section 6, a BULL at 1.1000 with the stop at 1.0970. On a later bar the high reaches 1.1030 while the bar is still forming. The TP1 label changes, the Trade row reads Long and Target 1, and the TP1 Hit alert fires if you switched it on. The trade stays open.
A later bar's low goes through 1.0970 and the bar closes above it. Nothing changes: the stop counts only on a close beyond it. If a later bar closes below 1.0970, the stop label changes to a check mark with its distance, the Trade row reads Stopped, Open R shows a dash, and the lines end ten bars past that bar.
Example 4: a trade replaced by a new signal
With that long still open, a BEAR is accepted on a closed bar. The old lines and labels go, the new short's levels are drawn from the BEAR bar, and the Close Long Signal and SELL Signal alerts fire if their switches are on.
10. The Ten-Second Read
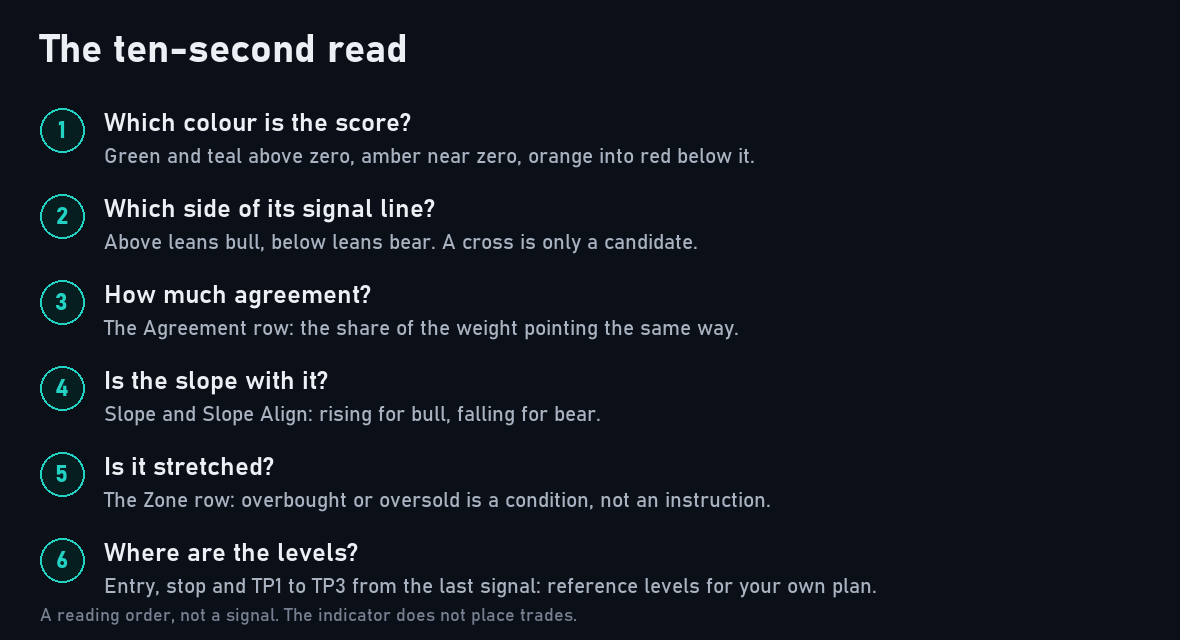
Figure 8. The ten-second read as a checklist.
When a marker prints, or an alert arrives, read the chart in the same order every time.
- Where is the score? Its colour and its place against zero, the thresholds and the zones.
- What does Bias say? BULL, BEAR or NEUTRAL, and whether it sits with the marker or against it.
- Which side of its signal line is the score on? And is the gap opening or narrowing?
- How many agree? Agreement, then the component rows if it is close.
- Is the slope with it? Slope, Slope Align, and the optional filters if you use them.
- What is the trade? The Trade row, and how far price already is from the entry.
The read is yours; the indicator only lays out the evidence.
11. Common Mistakes
- Treating a cross as a signal. A cross is a candidate until the tests pass on the closed bar.
- Reading the forming bar as final. The score, the newest candle's colour and the dashboard all move until the bar closes. A row that reads PASS now can read BLOCK at the close.
- Treating a zone as an instruction. OVERBOUGHT says momentum is stretched, not that it has to turn.
- Treating the levels as an order or a forecast. The entry is a close you cannot trade at, and the targets are multiples of the stop distance. Measure your own distances from your own price.
- Changing several settings at once. Then you cannot tell which one changed what.
12. Alerts
There are ten conditions, each with its own switch: BUY Signal, SELL Signal, Close Long Signal, Close Short Signal, Partial Close Long, Partial Close Short, SL Hit, TP1 Hit, TP2 Hit and TP3 Hit. BUY Signal and SELL Signal are on by default. An eleventh switch, Any alert() function call, sends the indicator's own JSON trade messages, with six action words you choose.
Four channels deliver them: a popup window (on by default), a sound with a file of your choice, a push notification to the MetaTrader app on your phone, and e-mail. Push and e-mail use the terminal's own settings. Test Alerts on Start checks your settings without waiting for a signal.
Targets alert on the touch. Entries, the stop and a replaced trade alert on the closed bar. Each fires once for its bar, and nothing fires for history or in the Strategy Tester. A message is the indicator's name and the condition's words, with the chart's symbol and timeframe after the vertical bar; the user manual lists all ten:
Supreme Momentum Confluence - BUY Signal Fired | EURUSD H1 Supreme Momentum Confluence - TP1 Hit | EURUSD H1
An entry's JSON message carries your action word, the levels, the score, Agreement and the number of active components; the user manual shows all three kinds:
{"action":"long","ticker":"Your Broker:EURUSD","tf":"60","direction":"long","entry":"1.10000","sl":"1.09700","tp1":"1.10300","tp2":"1.10600","tp3":"1.10900","time":"1767225600000","score":"8.40","agreement":"66.7","components":"6"}
An alert is the moment to run the ten-second read, not an instruction. The drawing switches change what you see, not what fires: with Markers off, a signal still alerts.
13. What It Does Not Do
- It does not place trades. It draws and alerts; you place and manage every order.
- It does not promise a result. A score, a cross or a target says where momentum and price have been, not where they will go. The stop and the targets are reference levels, not a forecast.
- It does not see the future. On the forming bar the score and the dashboard move with every tick and a target can be touched; markers, the stop and a new trade wait for the closed bar, and what a bar shows is final when it closes.
- It does not read anything but your chart. MFI reads your broker's tick volume and every component reads your broker's candles, so another feed can give a slightly different score. It needs no DLL, no internet access and no files.
14. Conclusion
Six oscillators in six windows leave the weighing to you, a little differently every time. Supreme Momentum Confluence does that weighing by fixed rules, keeps the reason for every signal in view and maps the levels you need for a plan, and the decision stays yours. Test it on a demo account first, keep a journal of the signals you take, and change one setting at a time.
Risk Disclaimer
Trading leveraged products carries a high level of risk and may not be suitable for all investors. Supreme Momentum Confluence is an analysis tool, not financial advice. Test it on a demo account first.