
0
10
Regular divergence warns of a reversal. Hidden divergence points the other way: it is read as a sign that the trend may continue after a pullback. The DuoFX Divergence Scanner finds it across 28 pairs and gold on up to 9 timeframes. Setup is in the user manual.
What hidden divergence is
- Hidden bullish: price makes a higher low, the oscillator makes a lower low. In an uptrend, the pullback was shallow in price while momentum reset further.
- Hidden bearish: price makes a lower high, the oscillator makes a higher high. In a downtrend, the bounce was weak in price while momentum rebuilt.
- Traders read it as the trend still being in charge. It is a clue, not a guarantee.
Regular vs hidden, side by side
- Regular: price and oscillator disagree at a new extreme. Used for reversals.
- Hidden: price holds a higher low (or lower high) while the oscillator disagrees. Used for continuation.
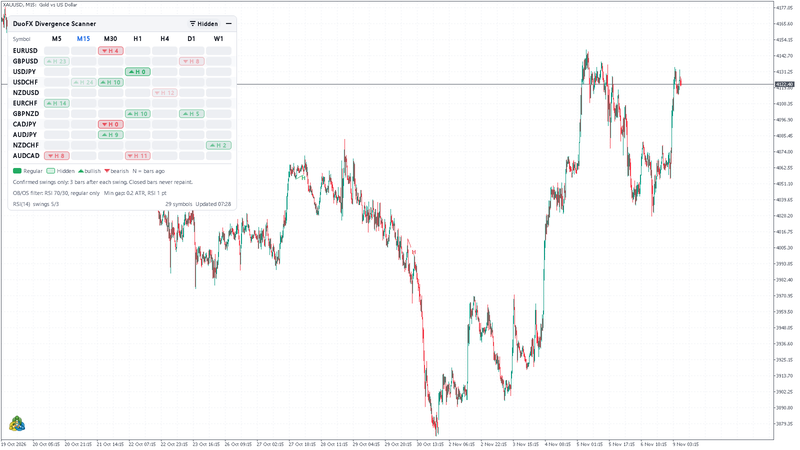
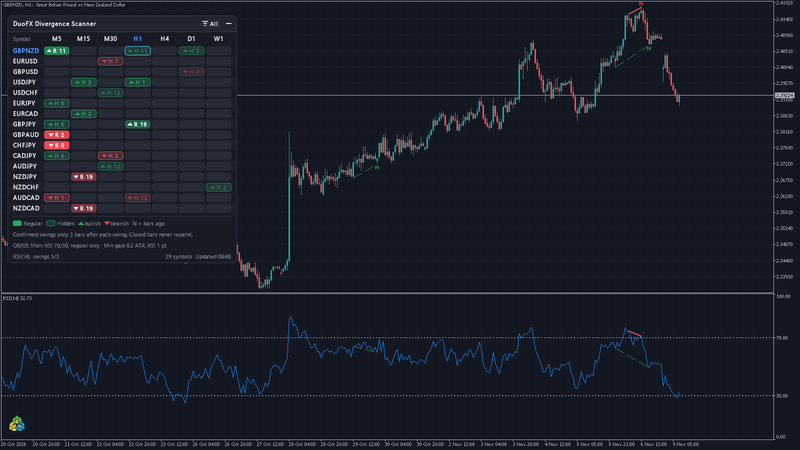
- In the scanner: solid cells are regular, outlined cells are hidden. On the chart, hidden lines are dashed.
Why the overbought / oversold filter is off for hidden
- Hidden divergence forms on pullbacks, where the oscillator sits in the middle of its range.
- So by default the filter does not apply to hidden. A filter that needs an extreme would remove most of the setups.
- You can switch "Apply the filter to hidden divergences too" on if you want hidden signals only from the zones.
Step 1: set up the scan
- Click the filter button until it shows Hidden. The filter shows one view at a time (All, Regular, Hidden, Bullish, Bearish): Bullish and Bearish include regular cells too, so for one side of hidden divergence stay on Hidden and read the colour and arrow.
- Choose the timeframes you trade. A common setup is the trend on a higher timeframe and the pullback on a lower one.
- Keep "Clean lines only" on, so only tidy divergences show.
Step 2: confirm there is a trend first
- Hidden divergence needs a trend to continue. In a range it is noise.
- Check the higher timeframe: higher highs and higher lows for bullish, the reverse for bearish.
- Use a simple tool of your own: a moving average, structure, or the currency strength meter to see if the currency is backing the move.
Step 3: find the pullback signal
- In the grid, look for an outlined cell in the direction of the trend.
- Click it. The chart switches and shows the oscillator pane and the dashed divergence lines on both.
- Ask: did the pullback hold a level, such as a prior swing or a moving average? Is the signal fresh, with a small "bars ago" number?
Step 4: plan the trade
- The signal arrives only after the confirmation bars have closed, so it is a little late by design. It is non-repainting.
- Entry is yours: a break of the pullback high (for a buy), a candle pattern, or a retest.
- Stop under the swing low that made the divergence (for a buy), and mirror for sells.
- If the stop is too far for your risk, skip it. The target is also yours: the previous high, or a trailing method.
Common mistakes
- Trading hidden divergence against the higher timeframe trend.
- Treating every dashed line as an entry.
- Ignoring that the signal can also show up at the end of a trend, when a pullback becomes a reversal.
- Trading it into news.
Risk note
Hidden divergence fails often, and trends can turn without warning. The scanner flags setups. It never trades and it does not tell you when to enter. This article is education only, not financial advice, and promises no result. Practise on a demo account and size every trade so a stop-out is acceptable.