
Technical Guide: Maximizing Stock MT5 Mobile Indicators for a Rules-Based Trading SOP

Technical Guide: Maximizing Stock MT5 Mobile Indicators for a Rules-Based Trading SOP
A common consensus within the MQL5 mobile terminal discussion boards is that the smartphone application is heavily restricted. Many retail traders feel paralyzed by the lack of custom MQL5 scripting capability on handheld devices, leading to emotional, undisciplined market executions directly from their screens.
However, professional execution is not determined by the number of monitors on a desk, but by the mechanical rigidity of the operational framework.
This guide outlines a strict, rule-based trading system designed specifically for the standard MetaTrader 5 mobile environment. By stacking out-of-the-box indicators structurally, we can establish an objective multi-timeframe checklist that eliminates discretionary execution. This approach requires a maximum of three minutes to calibrate on any default mobile terminal.
Technical Setup: Inter-Timeframe Integration
To maintain maximum chart space and visibility on small mobile screens, the indicator streams are separated into the main chart and a specialized momentum sub-window.
1. Momentum Sub-Window Configuration
Relative Strength Index (RSI): Period 14 • Apply to Close • Levels: 30, 50, 70.
Bollinger Bands (BB): Period 20 • Deviation 1.000 • Shift 0.
⚠️ Critical Parameter Setup: The Bollinger Bands must be set to Apply to Previous Indicator's Data.
Verification: The Bollinger Bands must overlay directly onto the RSI line inside the indicator sub-window, not on the primary price chart. This configuration maps momentum velocity and volatility expansions rather than price envelopes.

Figure 1: MT5 Mobile Indicator List and Window Breakdown

Figure 2: RSI Parameter Settings

Figure 3: Bollinger Bands Parameter Settings
2. Main Price Chart Configuration
Apply three standard Exponential Moving Averages (EMA) to filter the directional trend:
EMA 9 (Exponential • Apply to Close • Color: White)
EMA 21 (Exponential • Apply to Close • Color: Magenta)
EMA 200 (Exponential • Apply to Close • Color: Yellow) — Used strictly as a long-term macro filter.

Figure 4: EMA 9 Parameter Settings

Figure 5: EMA 21 Parameter Settings
The Mechanical 5-Gate Workflow
Every trade setup must clear five sequential logical gates before execution. If a single gate returns a false state, the protocol enforces an immediate WAIT order. In systematic trading, keeping the account flat is a highly active and valid decision.
[ Gate 1: Context ] ➔ [ Gate 2: Reaction ] ➔ [ Gate 3: RSBB Trigger ] ➔ [ Gate 4: EMA Cross ] ➔ [ Gate 5: Execution ]
Gate 1: Market Context (H4 Timeframe)
Plot major Support and Resistance (SNR) zones on the H4 chart using the default rectangle object tool. Zones must be mapped as structural boxes, never as thin lines. Portrait screen alignments can vary by several pixels on a phone, creating a massive margin of error on volatile instruments.
- Bullish Bias (HH + HL structure): Prioritize long scenarios.
- Bearish Bias (LH + LL structure): Prioritize short scenarios.
- Ranging/Unclear Structure: Trade protocol suspended. Close the app.
Gate 2: Structural Zone Reaction (H4 Timeframe)
Observe price behavior upon entering the H4 box. Execution pathways require a completed candle close validating either a Rejection (testing the zone and reversing away) or a clean Breakout (closing completely outside the zone boundaries). Intrabar spikes and candle wicks do not satisfy breakout criteria.
Gate 3: Momentum Trigger (Drop to M15 or M30 Timeframe)
Once the H4 structural bias is locked, drop to the M15 or M30 timeframe to isolate execution velocity. Wait for a completed candle close in the RSI sub-window:
- Long Trigger: RSI crosses above the upper Bollinger Band while remaining above the 50 median level.
- Short Trigger: RSI crosses below the lower Bollinger Band while remaining below the 50 median level.
Gate 4: Trend Confirmation (Main Chart)
The EMA 9 must cross the EMA 21 in the direction of the momentum trigger.
- The 5-Candle Lifespan Rule: The EMA crossover must occur within a maximum window of 5 candles after the initial RSI band breakout. If the crossover occurs on candle 6 or later, momentum decay has begun; the setup is void.
- Instant Cancellation Rule: If the RSI line curls back inside the Bollinger Bands before the order gets filled, the structural momentum is compromised—cancel the setup immediately.
Gate 5: Order Placement & Capital Protection Math
Because this system relies heavily on confirmation, market orders will result in poor risk-to-reward ratios due to execution lag. Never chase an active momentum spike.
- Entry Protocol: Place a pending Limit Order at the pullback cluster near the EMA 9/21 intersection or the retest level of the broken structure. If the market continues to expand without hitting the limit order, delete the order.
- Position Sizing: Lot sizes must be calculated dynamically based on account equity and exact stop loss distance, never based on personal confidence.
Empirical Trade Logs: Comparative Analysis
To evaluate the mathematical validity of these parameters, we examine actual mobile execution data, contrasting system compliance against rule violations.
Case A: Systematic Short Execution (SELL Limit on XAUUSD M1)
A bearish H4 bias pushed the M1 RSI below the lower band. A pending SELL LIMIT was structured at 4,021.62 with a strict Stop Loss at 4,016.208 and a Take Profit at 3,991.801. The position was filled cleanly, absorbed a minor structural retest up to 4,016.208 without violating the invalidation logic, and drop-extended aggressively down to hit the TP target at 3,991.801. Executed with 0.01 lot size, securing a net profit of +$29.82 and lifting account balance to $5,740.51.


Figure 6: XAUUSD M1 Setup and Trade Progress


Figure 7: XAUUSD Account Deal History Log (+$29.82)
Case B: Systematic Long Execution (BUY Limit on BTCUSD M15)
Under a verified bullish market context, the RSI broke above the upper band and closed at a high velocity level of 67.97. A pending BUY LIMIT order was structured at 80,361.92 with a strict Stop Loss at 80,084.84. The price pulled back smoothly, filled the position at 12:14 server time, and fully achieved the Take Profit target at 80,795.27 by 17:21, securing a clean net profit of +$433.35 with a volume of 1.00 lot.
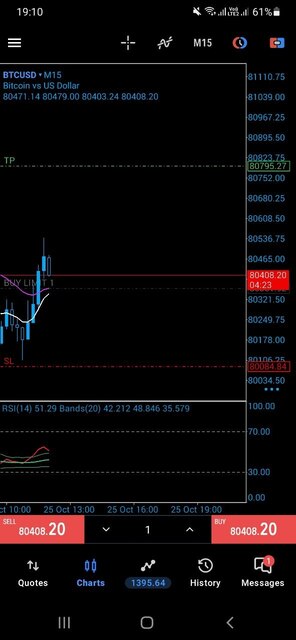
Figure 8: BTCUSD M15 Breakout and Entry Setup
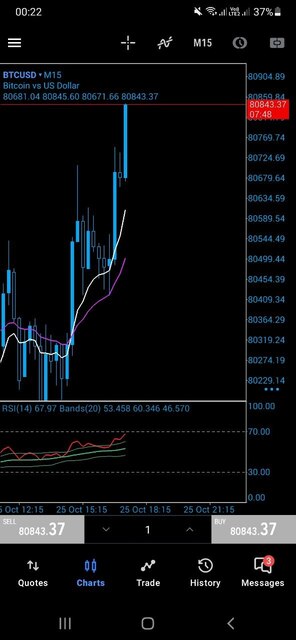

Figure 9: BTCUSD Position Deal History Log (+$433.35)
Case C & D: Protocol Violations (Failed Market Orders)
Case C (Chasing Price Extremes on BTCUSD M5): A manual market BUY was forced at 80,888.57 directly after an aggressive spike candle left a long upper wick. The entry occurred directly beneath a declining macro EMA 200, resulting in an instant reversal and a net loss of -$172.43.
C
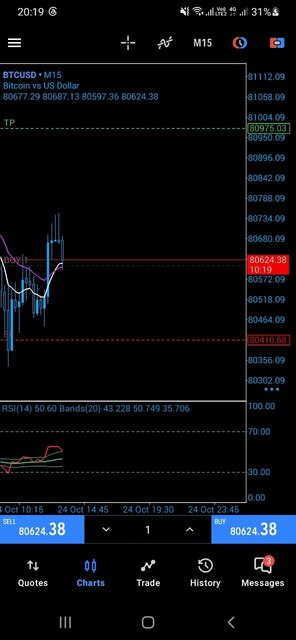
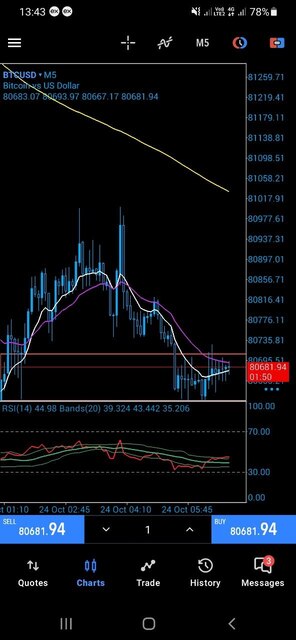
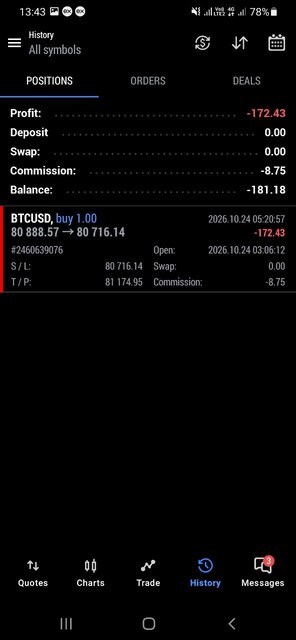
Figure 10: Case C Rule Violation Charts
Eradicating Common Smartphone Pitfalls
1. Misinterpreting RSI Extremes as Reversal Signals: Retail traders consistently short an asset simply because the mobile RSI screen registers above 70. In high-velocity trends, momentum locks outside the bands for prolonged extensions. Execution requires absolute H4 zone validation first.
2. Trading Volatility Squeezes During High-Impact News Blocks: Band narrowing indicates an impending volatility spike, which frequently prints false intrabar indicator crosses. Do not guess the direction during data releases; wait for the candle close confirmation.
3. Impulsive Break-Even (BE+) Modifications: Adjusting stop losses to entry too early out of anxiety will strangle a position during its mandatory structural retest phase. The parameters must be given room to breathe.
Disclaimer: This documentation is shared strictly for educational and community knowledge-sharing purposes. It does not constitute investment recommendations or financial advice. Always test trading parameters thoroughly on a demo terminal.