
What it does
- Scans 28 major and cross pairs plus gold (XAUUSD), or your own list of up to 40 symbols, on up to 9 timeframes, for regular and hidden divergence on RSI, MACD, OsMA, Stochastic, CCI or Momentum.
- Shows the result on one grid. Click a cell and your chart switches to that symbol and timeframe, with the oscillator pane and the divergence lines drawn.
- Confirmed swings only, closed bars only. It is a scanner, not a signal service, and it never trades.
Install from the Market and attach
MT5
- Press Ctrl+T, open the Market tab, then Purchased. Click Install on "DuoFX Divergence Scanner MT5".
- Open Navigator (Ctrl+N), Indicators, Market. Drag it onto one chart. Click OK.
- No AutoTrading permission is needed. It is an indicator.
MT4
- Press Ctrl+T, Market tab, Purchased. Install "DuoFX Divergence Scanner MT4".
- Open Navigator (Ctrl+N), Indicators, Market, and drag it onto one chart. Click OK.
- In the Common tab, "Allow DLL imports" is not needed. It uses no DLLs.
- On MT4 the oscillator pane is added by reloading the clicked chart's template once. Charts running an Expert Advisor are never reloaded (see the FAQ).
For alerts, run the scanner on one chart only. Each chart with the scanner alerts on its own.
Your first 5 minutes
- Attach it. Give it a few minutes on the first start: the terminal downloads history for every symbol and timeframe. The footer reads "Scanning N/M" while it works.
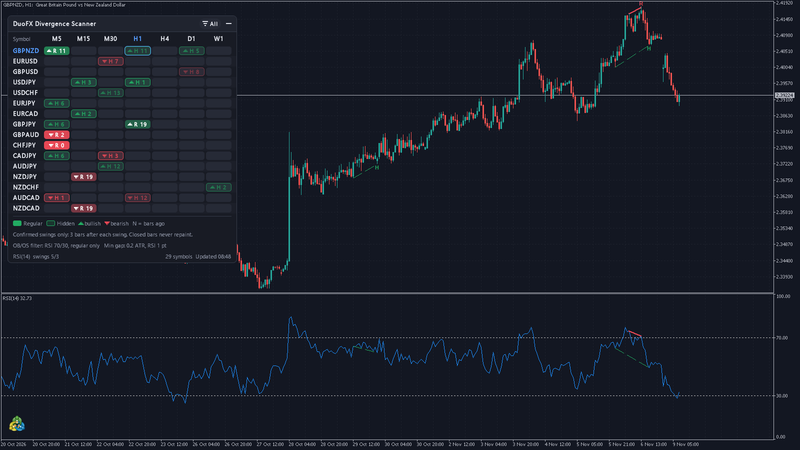
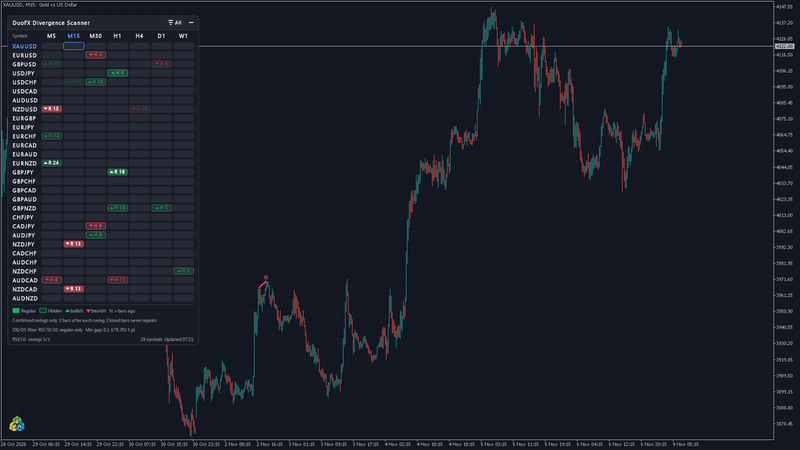
- Read the grid. Rows are symbols, columns are timeframes (default M5, M15, M30, H1, H4, D1, W1).
- Solid green or red cells are regular divergence. Outlined cells are hidden divergence. Each signal cell shows an arrow for the direction, R (regular) or H (hidden), and how many bars ago it was confirmed. Older signals fade, then drop off.
- Click the filter button to step through All, Regular, Hidden, Bullish and Bearish.
- Click a cell. Your chart switches to that symbol and timeframe, adds the oscillator in its own pane (unless the chart already shows it), and draws the divergence on the candles and in the pane.
- Click a symbol name to switch symbol only, or a timeframe header to switch timeframe only.
- Drag the panel by its header. Collapse it into a bar that counts bullish and bearish signals.
Inputs, in plain words
Divergence
- Oscillator: RSI (default), MACD, OsMA, Stochastic, CCI or Momentum. One per instance.
- Period (14): RSI, CCI, Momentum and Stochastic %K.
- MACD / OsMA fast, slow, signal (12, 26, 9). Stochastic %D and slowing (3, 3).
- Swings on: highs and lows (default) or closes.
- Bars before a swing (5) and Bars after a swing (3). The bars after are the confirmation. Nothing counts until they have closed.
- Min and max bars between the two swings (5 and 60).
- Clean lines only (on): no bar in between may break the line, in price or in the oscillator.
- Show signals up to N bars old, by timeframe: M1 to M30 24, H1 to H3 24, H4 to H12 12, D1 10, W1 and MN1 4.
- Types shown at start: All (default), Regular, Hidden, Bullish or Bearish.
Minimum gaps (no double tops or bottoms)
- Min price gap between the swings, in ATR (0.2, 0 = off) and ATR period (14).
- Min oscillator gap: RSI 1 point, Stochastic 2, CCI 10. MACD, OsMA and Momentum use 2% of their range over the last N bars. 0 switches a gap off.
Overbought / oversold filter
- Only divergences from overbought / oversold (on). Applies to regular divergence.
- Zone points required: at least one swing point (default) or both.
- Apply the filter to hidden divergences too (off).
- Levels: RSI 70/30, Stochastic main line 80/20, CCI +100/-100.
- MACD, OsMA, Momentum: the zone is adaptive. Top and bottom 20% of values over the last 200 closed bars.
Grid
- Symbols: blank means 28 majors and crosses plus XAUUSD. Or type up to 40 of your own (indices, metals, crypto).
- Timeframes: comma separated, up to 9 (default M5,M15,M30,H1,H4,D1,W1). MT4 offers M1 to MN1. MT5 adds M2 to H12.
- Add the chart symbol if not in the list (on). Hide rows with no signal (off).
- Symbol prefix / suffix: blank for automatic detection.
- Click on a cell: switch this chart (default), open a new chart, or do nothing.
- Add the oscillator to the chart (on a click) (on).
- Max cells computed per refresh (24). Lower is lighter on the terminal.
Alerts
- Popup (on), Push (off), Email (off), Sound (off), Sound file (alert.wav). Push and email use the settings in Tools > Options.
Chart lines
- Draw divergences on this chart (on), Bars to search (500), Max divergences drawn (30), Regular line width (2, hidden is dashed).
Dashboard
- Corner (top left), offsets (12 / 28 px), Theme (Auto, Dark, Light), Font (Segoe UI), Font size (9), Start minimised (off).
The panel explained
- Header: product name, the filter button (it shows the current filter) and the minimise button. Minimised, the bar shows the bullish and bearish counts.
- Grid cells: solid green (regular bullish) or red (regular bearish). Outlined cells are hidden. The arrow shows direction, R or H the type, and the number is bars since confirmation. "n/a" means not enough history on that timeframe.
- Your chart's symbol and timeframe are highlighted.
- Footer (lines drop off on short charts so the grid stays visible):
- legend: Regular, Hidden, bullish, bearish, "N = bars ago";
- the repaint note: "Confirmed swings only: 3 bars after each swing. Closed bars never repaint.";
- the overbought / oversold filter line;
- the oscillator and swing settings, and the status ("29 symbols Updated HH:MM", or "Scanning N/M").
- The panel steps its font size down to fit a small chart.
FAQ and troubleshooting
Cells show n/a.
- Not enough history on that timeframe, or history is still arriving after the first start. It fills in by itself. The adaptive zone for MACD, OsMA and Momentum needs about 200 extra bars.
Cells are empty, or the grid says "No signals for this filter".
- No divergence passes your settings yet. The filter button or the overbought / oversold filter may be hiding them: set the filter button to All, or switch the zone filter off to compare. "No signals for this filter" appears when "Hide rows with no signal" is on and no row has a signal.
It says "No symbols found".
- Your broker's names differ. Fill in the prefix and suffix, or type your own symbol list.
The first scan is slow.
- Normal. The terminal downloads history for every symbol and timeframe in the background while the rest keeps working.
Does it repaint?
- A swing counts only after the bars you set have closed after it. A signal stays as it appeared until it ages out. It works on closed bars.
I get alerts twice.
- Each chart with the scanner alerts on its own. Keep one instance for alerts. With "Click on a cell" set to "Open a new chart" and the oscillator option on, the new chart gets a copy of the scanner with alerts off.
Will it remove my indicators?
- No. It never adds a second copy of an oscillator already on the chart. When you change the scanner's oscillator, only the pane it added is replaced.
MT4: my chart restarted its indicators once.
- MT4 cannot add an indicator from code, so the scanner reloads that chart's own template with the oscillator in it. Your indicators and drawings are kept. A chart running an EA is never reloaded: the scanner tells you once to add the oscillator by hand, or set "Click on a cell" to open a new chart.
Can I test it in the Strategy Tester?
- The tester runs one symbol, so only the tested symbol is scanned, and clicks and alerts are off. The full grid works in the live terminal.
Does it slow the terminal?
- It runs on a timer, recalculates a cell only when a new bar closes there, and spreads work in small slices.
Update did not appear.
- In the Market tab, Purchased, press Update. Remove the indicator from the chart and drag it on again.
Version history
- 1.2 (2026-11-09): two scanners on one chart work side by side. Oscillator panes are checked by name so a click never stacks a copy. MT4 never reloads a chart running an EA. A pane is added only after a click. The panel steps through every font size on small charts.
- 1.1 (2026-11-09): a click brings the scanner's oscillator, with the same periods, in its own pane. Divergence lines are drawn in that pane too. No duplicate panes. The panel fits narrow charts.
- 1.00 (2026-11-09), MT5 and MT4: first publish.
Learn more
- Regular divergence for reversals, with the overbought / oversold filter
- Hidden divergence for trend continuation on pullbacks
Links
- MT5: https://www.mql5.com/en/market/product/207144
- MT4: https://www.mql5.com/en/market/product/207148
- Website: https://duofxlabs.com/divergence-scanner/
Trading forex and CFDs is high risk. This indicator is a market analysis tool for educational and informational purposes only. It is not financial advice and does not guarantee results.