Multi-timeframe analysis on gold (XAUUSD): draw once on H4, trade on M15

Most gold traders read the story on H4 and H1, then time the entry on M15 or M5. The slow part is carrying the map down: every zone, swing level and Fibonacci drawn again on each lower chart, then fixed again when price moves. Chart Sync carries it for you. You draw on H4 and the same objects show up on your M15 and M5 charts. Here is a practical multi timeframe workflow for XAUUSD that also suits prop firm challenges, where one consistent chart saves time and mistakes.
The layout
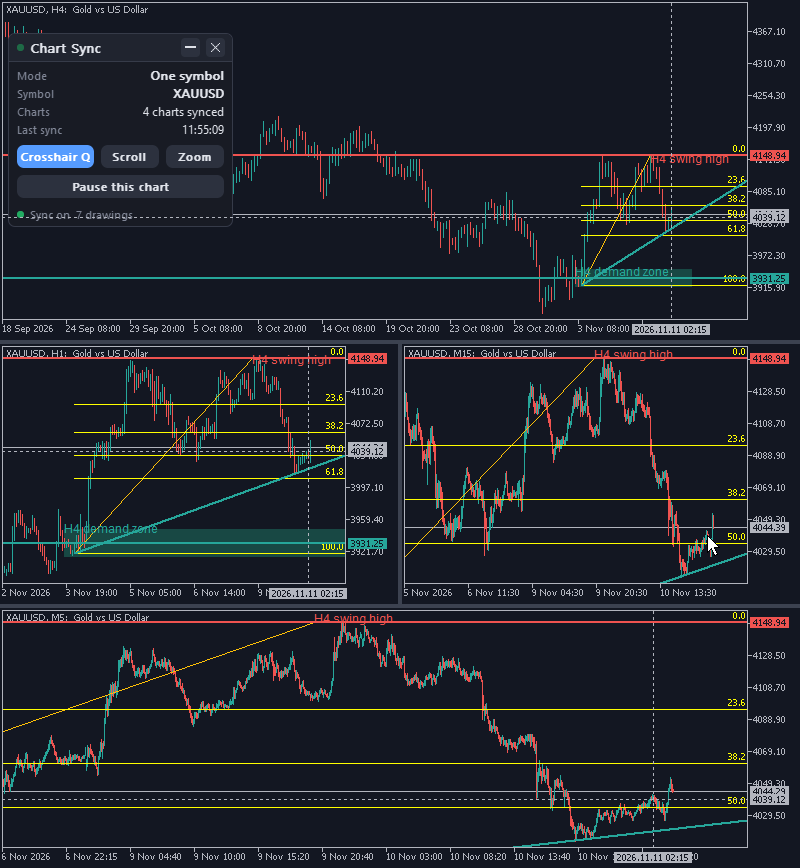
- Open four XAUUSD charts: H4, H1, M15 and M5. Drag Chart Sync onto each one (install steps are in the user manual).
- Each panel shows "Sync on", the symbol and "4 charts synced" once they have found each other.
- Save the layout as a profile, or the charts as a template with Chart Sync on them, so the whole setup comes back after a restart.
Step 1: mark the higher timeframe map on H4
- Draw horizontal lines at the levels that matter: last week's high and low, the Asian range, a round number.
- Draw supply and demand zones as rectangles. Gold moves in wide ranges, so a zone often shows the reaction better than a single line.
- Add a Fibonacci retracement over the last H4 impulse. Its levels, colours and labels appear on the other charts, even levels with a blank label.
- Put a text note on a level ("H4 demand", "weekly high"). Text, descriptions and tooltips travel with the drawing, in any language.
Typically in under half a second, the same objects appear on H1, M15 and M5. By default an H4 drawing shows on every timeframe from M1 up to W1, so your map is on every lower chart without any setup.
Step 2: refine on H1, keep M15 and M5 clean
- An H1 drawing shows from M1 up to D1, so an H1 trendline also lands on your H4 chart. Lines drawn on M15 show up to H1 only, and M5 lines up to M30.
- That default keeps entry clutter off your H4 view. Want a different split? Change the "Sync ... objects up to" and "down to" inputs on any chart and every chart follows.
Step 3: time the entry with the synced crosshair
- Move the mouse along the M15 candles. H4, H1 and M5 show a dotted time and price crosshair at the same moment and price.
- You see where the M15 candle you point at sits inside the H4 candle, and whether it is testing the H4 zone or still above it.
- Press Q to switch the crosshair off or on for every chart. MetaTrader's own crosshair still works on the chart under your mouse for measuring.
- Adjust a zone edge on M5 and the change shows on H4 too, so the map stays current.
Step 4: pause one chart for a scratch idea
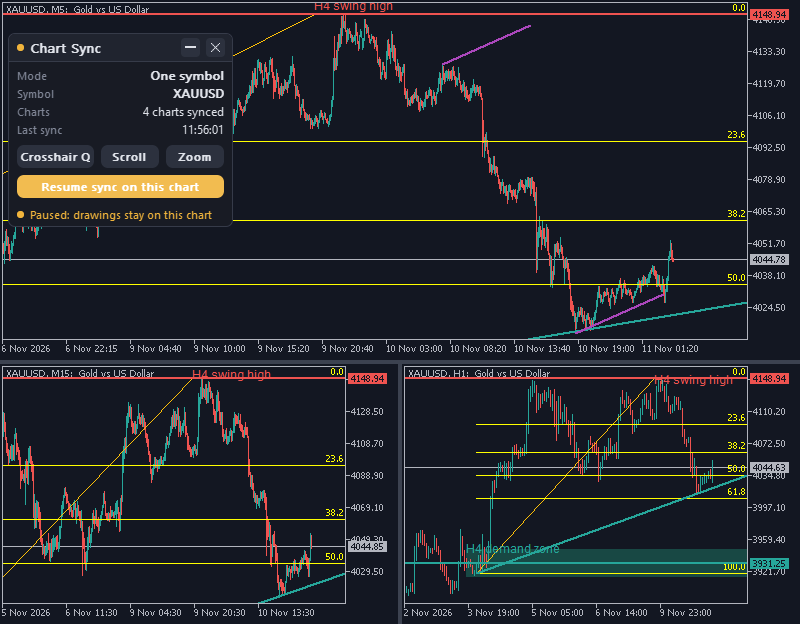
- Want to test a channel or an alternative count without touching your main map? Click "Pause this chart" on the M5 panel.
- What you draw while paused stays on that chart only, also after a timeframe change and after you resume.
- Changes from your other charts still arrive, so the paused chart keeps the H4 levels.
- Click "Resume sync on this chart" when you are done. The scratch drawings are not pushed to the other charts.
Step 5: watch EURUSD or a dollar chart next to gold
- Many gold traders keep EURUSD, or a dollar index chart if their broker offers one, beside the gold charts.
- In the default mode a Chart Sync group shows one symbol, and attaching it to a EURUSD chart would switch that chart to gold. Set "Sync mode" to Link by symbol on one chart instead; every chart follows.
- Now every chart keeps its own symbol. Your XAUUSD charts share their levels, your EURUSD charts share theirs, and nothing crosses over.
- The crosshair still helps: the EURUSD chart shows the time line at the moment you point at on gold, without a price line, since a gold price means nothing there.
Tips for gold
- Clear old levels from any chart. The panel asks "Delete 1 drawing on all charts?" while the others keep it. After Delete, "Undo delete" on that chart's panel brings it back on every chart for 15 seconds.
- Drawings are saved per symbol, so your gold map is there after a restart and when you switch back from another market.
- Check your broker's contract spec before you size a trade from these levels. On gold 1 lot is usually 100 oz, so a US$1 move is about US$100 per lot.
Risk note
Chart Sync copies your analysis between charts. It does not find entries or tell you where to trade, and a level is not a guarantee: gold can run through any line and move tens of dollars in minutes around news such as NFP, CPI and FOMC. Trading forex and CFDs is high risk, and prop firm rules can end an account on one bad day. This article is educational, not financial advice.
Learn more
- Chart Sync user manual
- How to sync drawings across timeframes and charts in MT5 and MT4
- How to sync the crosshair, scroll and zoom across charts in MT5 and MT4
- Keep your drawings when you change templates, profiles or restart MT5 and MT4