A Clean Chart in MT5: Why Clutter Hurts Your Analysis and How to Remove It

This article is for informational and educational purposes only. It does not constitute financial advice or an investment recommendation. Trading in financial markets carries a high risk of loss.
Introduction
Charts fill up slowly, and the reason depends on how you trade. If you run several Expert Advisors, for example during an incubation period, every chart, indicator and object uses part of the terminal's resources, and a heavy terminal is not the best place for EAs that need to react to every tick. If you trade manually, arrows, notes, lines and shapes accumulate week after week until the chart is harder to read and slower to work with.
This article is divided into three sections. The first explains why clutter matters in both cases. The second shows where it comes from, including objects you cannot see. The third covers how to keep charts and the terminal light in MetaTrader 5.
1. Why a cluttered chart is a problem
Running many EAs: every resource counts
During incubation it is common to run many EAs at the same time, each one on its own chart, often on a VPS with limited memory and processing power. Each chart keeps its price history in memory, each indicator recalculates on new ticks, and each object has to be redrawn. None of this is a problem with a few charts, but it adds up.
A terminal under load responds more slowly, and an EA that depends on reacting to price quickly may act later than in the backtest. It also makes incubation results harder to interpret: if live results differ from the test, the cause should be the strategy or the market, not an overloaded terminal.
A chart that only runs an EA does not need decorative indicators, old drawings or months of trade history arrows. The lighter each chart is, the more EAs the same terminal can run reliably.
Trading manually: more objects, more noise
Discretionary traders tend to accumulate objects: arrows to mark entries, notes, trend lines, zones and Fibonacci levels. Each one was useful once, but together they make almost any price close to some level, and it becomes easy to find one that supports what you already wanted to do.
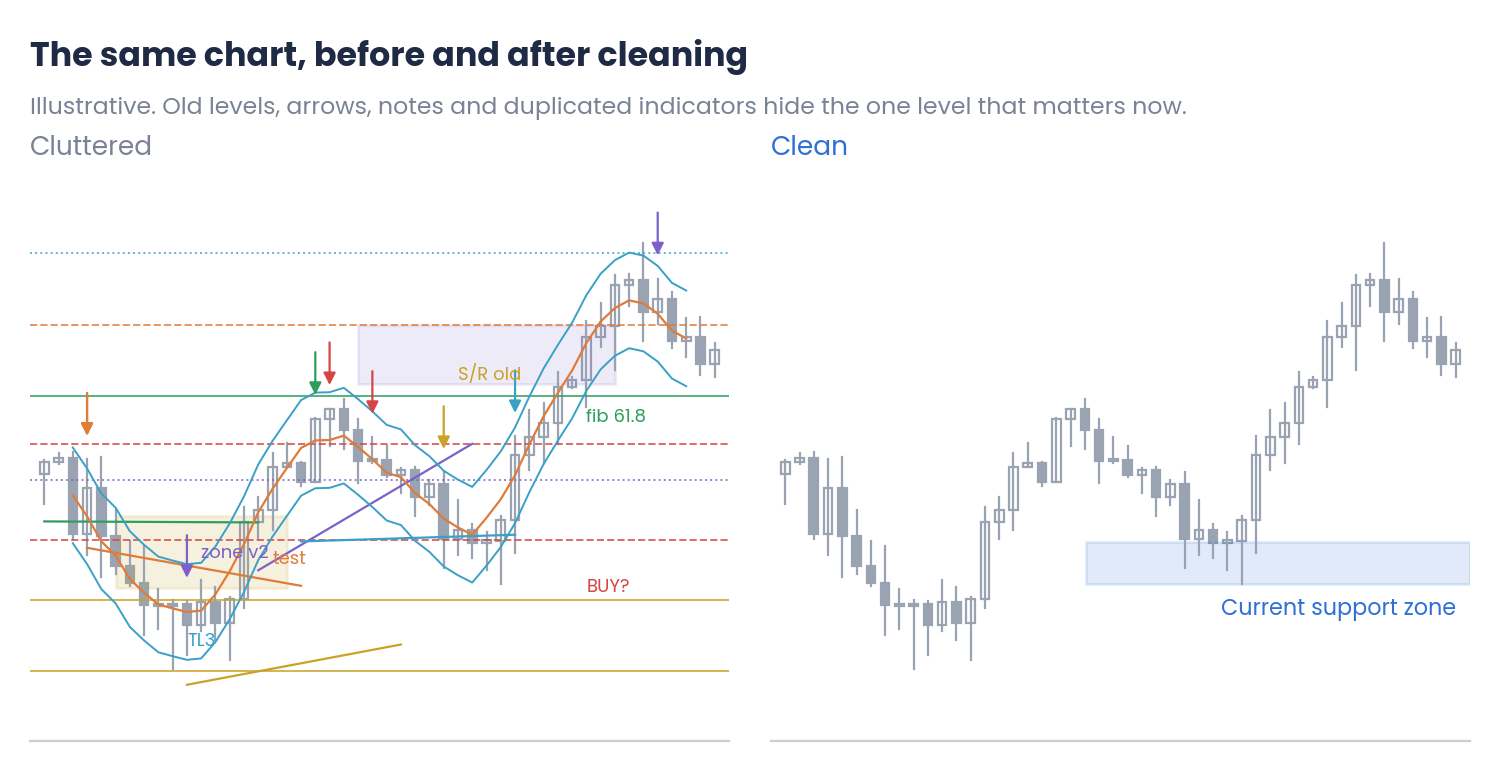
Figure 1. The same chart, cluttered and clean (illustrative)
On the clean chart, the level that matters now is obvious. On the cluttered one, it is one more line among many. Old zones that were broken weeks ago keep influencing the reading, and several indicators built from the same prices repeat the same message without adding real confirmation.
2. Where the clutter comes from
Objects you do not see
A chart often contains many more objects than are visible on the screen, and all of them use resources.
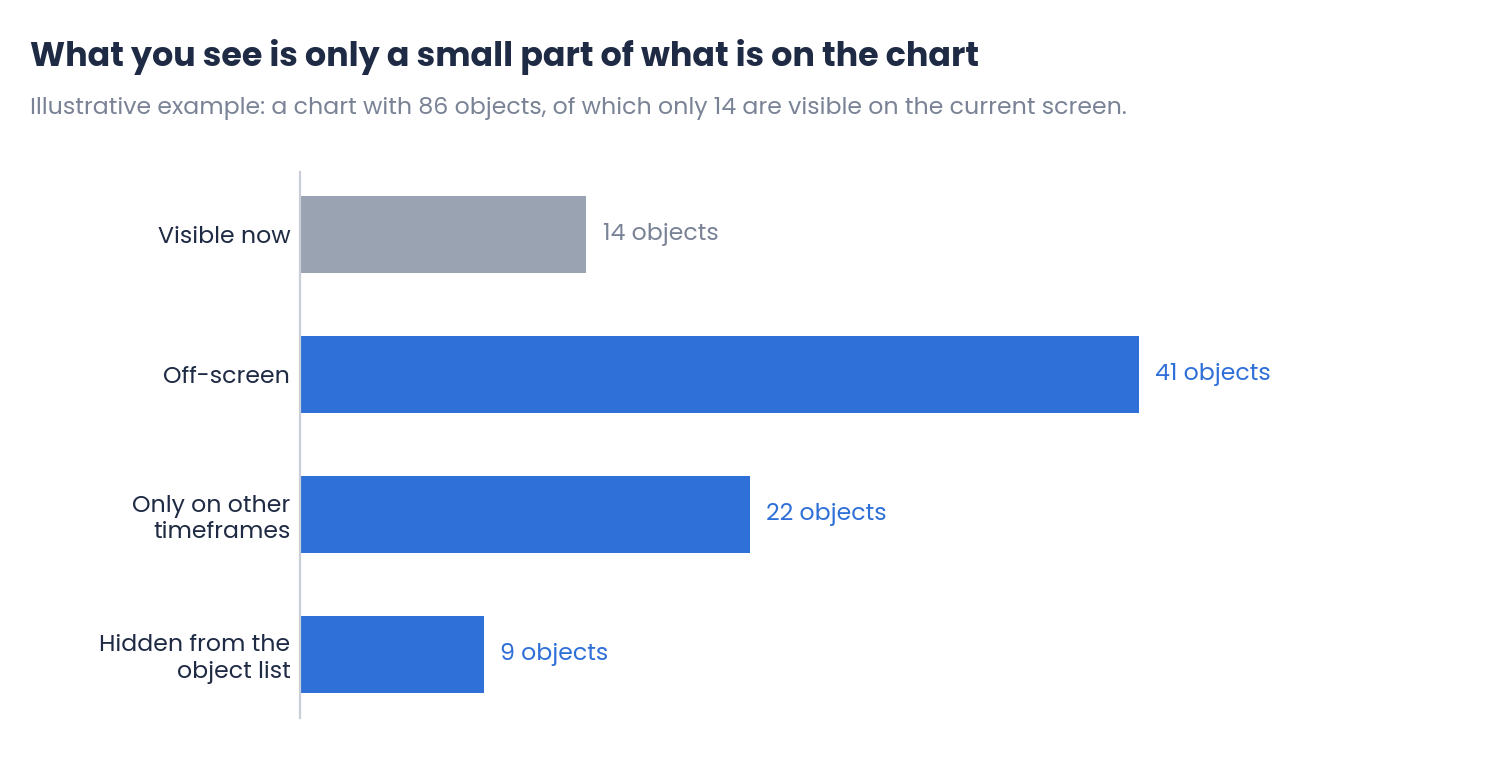
Figure 2. Visible objects versus all the objects on a chart (illustrative example)
- Off-screen: objects drawn on older parts of the history, outside the visible area.
- Only on other timeframes: in the object properties, an object can be set to appear only on certain timeframes. On the current one, it is invisible but still there.
- Hidden from the object list: programs can mark their objects as hidden, so they do not appear in the standard list of objects by default.
How many objects can a chart hold?
More than most traders expect. On one M5 chart, a full count showed 399 objects and 3 indicators, while only a handful of drawings were visible on the screen.
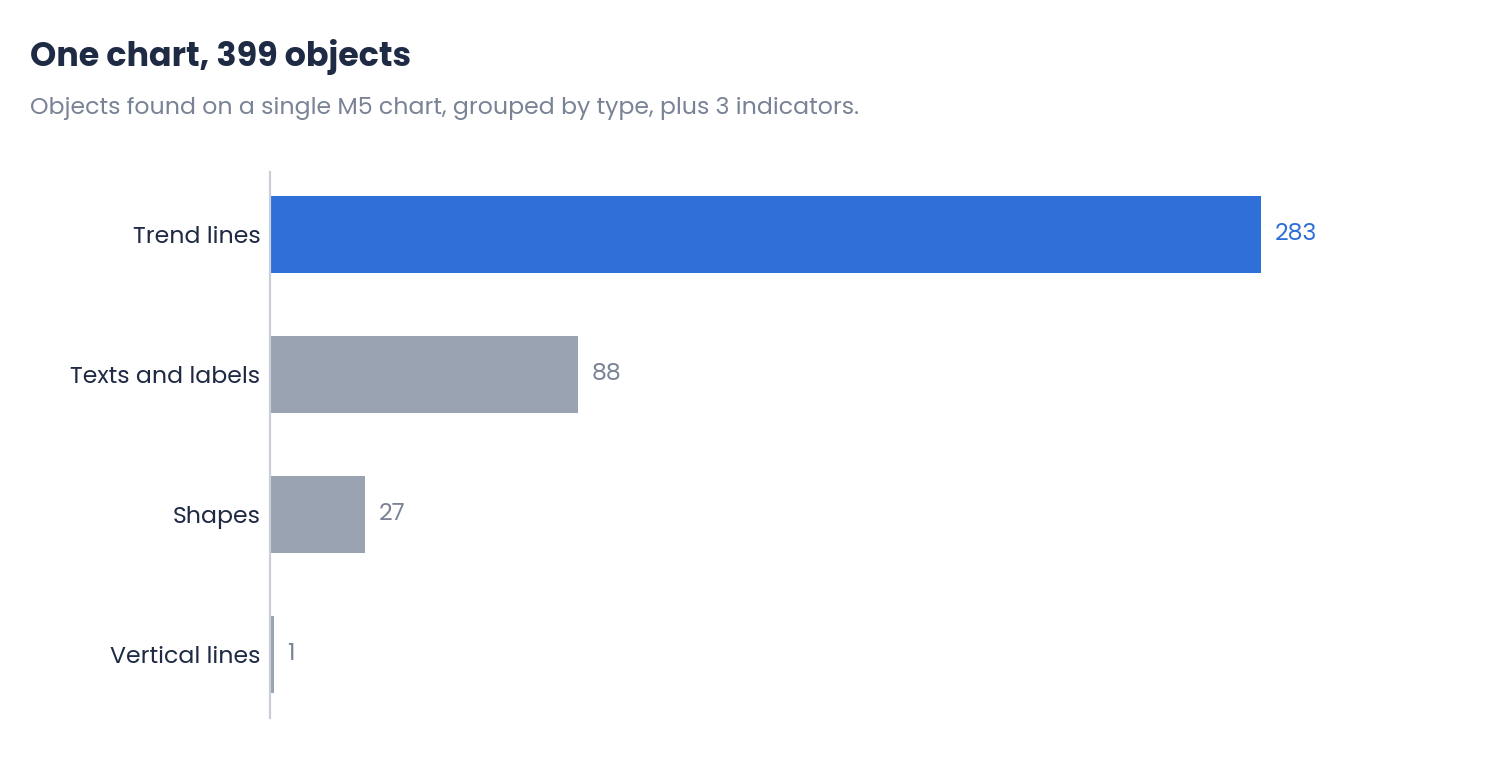
Figure 3. Objects found on a single chart, grouped by type
Hundreds of trend lines are rarely drawn by hand one by one. Counts like this usually come from programs that create objects automatically, which is why they keep growing without anyone noticing.
Common sources
- Programs that draw on every signal: some EAs and indicators create an arrow or a label on each signal or trade and never delete them. Over weeks of incubation, they can add up to hundreds of objects.
- Programs that leave objects behind: some indicators and scripts do not delete their objects when they are removed from the chart.
- Trade history marks: arrows and lines showing past trades, which grow with every trade.
- Manual drawings: arrows, notes, lines, zones and Fibonacci levels that were never removed.
- Duplicated indicators: the same indicator loaded twice, often with slightly different settings.
- Templates: a template saved from a cluttered chart copies everything to every chart where it is applied.
3. How to keep charts and the terminal light in MT5
The built-in tools
- Object list (Ctrl+B): shows the objects on the chart and lets you select and delete them.
- Indicator list (Ctrl+I): shows the indicators in the main window and in each subwindow.
- Clean template: save a template from a clean chart, and apply it to the charts where you load EAs. Saved as default.tpl, it is used for new charts.
- Maximum bars in chart: in Tools → Options → Charts, a lower value reduces the history each chart keeps in memory. Check that your EAs and indicators still have the bars they need.
- Fewer charts and symbols: close charts you do not use and remove unused symbols from Market Watch.
These tools work, but the object list is one long, flat list. With dozens or hundreds of objects from different sources, it is hard to know what each one is, where it is and whether it is safe to delete.
A simple cleaning routine
| Step | EA charts | Manual trading charts |
|---|---|---|
| 1. Indicators | Keep only those the EA needs, or none | Remove duplicates and indicators you no longer use |
| 2. Objects | Remove signal arrows and labels that accumulate | Keep only the levels and notes that are still relevant |
| 3. Hidden objects | Check off-screen, other timeframes and hidden objects | Same check: what you cannot see still uses resources |
| 4. Protect | Never touch objects the EA uses to work | Identify the drawings you want to keep |
| 5. Template | Use a minimal template for every EA chart | Save a clean template for new charts |
A weekly review, for example at the weekend when the market is closed, is usually enough. Some EAs use chart objects as part of their logic; deleting them can affect how they work, so check before removing objects from an EA chart.
A free tool to do it from one panel
To make this routine faster, I developed Chart Sweeper, a free utility for MetaTrader 5. It turns the object list into a panel where you can see everything on the chart and remove only what you choose:
- Everything in one place: indicators in every window, and objects grouped by type, by source (manual drawings, trade history marks or the program that created them) or by visibility (visible, off-screen, other timeframes or hidden).
- Delete or hide: tick a single object, a group or everything, and delete it with a confirmation, or hide it and show it again later.
- Protection: protect an indicator, a group such as your manual drawings, or a single object, so it cannot be deleted by mistake.
- Locate before deleting: click an object's name and the chart scrolls to it and makes it blink.
- Undo: restore the chart as it was after the last delete.
It is designed to be used on charts where an EA is running. It only acts on the chart where it is loaded, never opens, closes or modifies trades, and never stops or changes the Expert Advisor; it tells you when one is running. Undo is disabled while an EA is on the chart, so the EA is never reloaded without trading permission. When the panel is closed, it removes itself and leaves nothing behind.
Conclusions
- Why clutter matters: with many EAs in incubation, every chart, indicator and object uses resources, and a heavy terminal can affect how EAs react. In manual trading, too many objects add noise and keep old levels alive.
- Where it comes from: programs that draw on every signal or leave objects behind, trade history marks, manual drawings, duplicated indicators and templates. Many objects are off-screen, on other timeframes or hidden.
- How to keep it light: keep EA charts minimal, review manual charts regularly, look for objects you cannot see and use clean templates. Lower the maximum bars in chart and close what you do not use.
A clean chart will not improve a weak strategy. It does give EAs a lighter terminal to run on, and it makes a good manual strategy easier to apply as intended. Keep only what you actually use, and review the rest regularly.
References
- MetaTrader 5 Help: objects list, indicators list, chart templates and platform settings (Charts).
- MQL5 Reference: object properties (OBJPROP_TIMEFRAMES, OBJPROP_HIDDEN).
Disclaimer
This content is for informational and educational purposes only. It does not constitute financial advice or a recommendation to buy or sell any instrument. The charts are illustrative and do not represent real trades. Chart Sweeper is a chart utility developed by the author; it does not generate trading signals and does not open, modify or close trades. Trading forex, CFDs and other leveraged products carries a high risk of loss. Every trading decision, and its outcome, is the sole responsibility of the reader. The author accepts no liability for any loss arising from the use of this information.




