
What it does
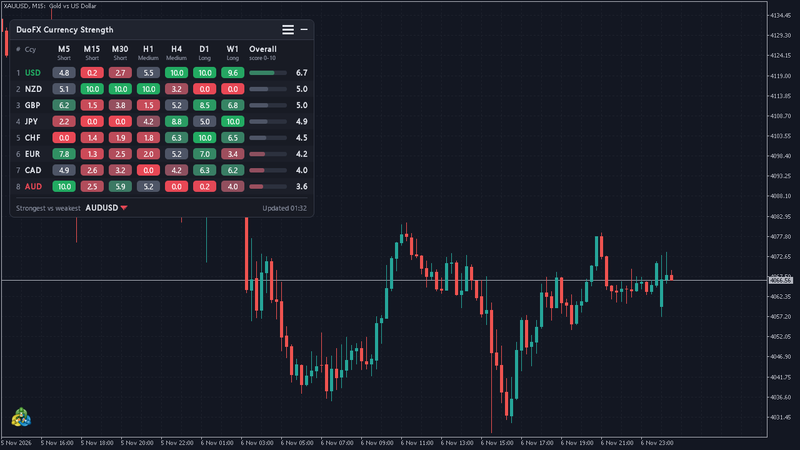
- Scans all 28 major and cross forex pairs and ranks the eight currencies (USD, EUR, GBP, JPY, CHF, CAD, AUD, NZD) from strongest to weakest.
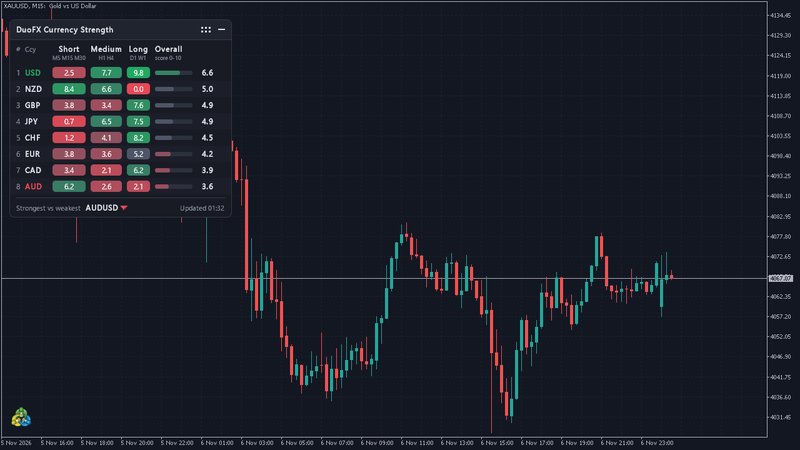
- Splits strength into Short, Medium and Long term groups, plus an Overall score, as a heat map from red (weak) to green (strong).
- Shows the "strongest vs weakest" pair in the footer. It is an analysis tool. It gives no entry signals and never trades.
Install from the Market and attach
MT5
- Log in to the MQL5 account you bought with (Tools > Options > Community).
- Open the Market in the terminal (Toolbox, Ctrl+T, Market tab), go to Purchased and click Install on "DuoFX Currency Strength Meter MT5".
- Open Navigator (Ctrl+N), Indicators, Market. Drag it onto any chart.
- Click OK. No Algo Trading permission is needed, because it is an indicator.
MT4
- Log in to the MQL5 account you bought with (Tools > Options > Community).
- Open the Terminal window (Ctrl+T), Market tab, Purchased. Install "DuoFX Currency Strength Meter MT4".
- Open Navigator (Ctrl+N), Indicators, Market, and drag it onto any chart.
- "Allow DLL imports" is not needed. It uses no DLLs. Click OK.
It works on any chart, including gold. The meter reads the 28 forex pairs, so on XAUUSD it shows the USD, EUR and JPY backdrop. It does not rate gold itself.
Your first 5 minutes
- Attach it. The panel, titled "DuoFX Currency Strength", opens in the top left corner.
- The first start can show "Loading history 12/28" in the footer (pairs ready out of pairs found). Your terminal is downloading history for each pair. It fills in by itself.
- Read it top to bottom: rank 1 is the strongest currency, rank 8 the weakest. Green is strong, red is weak.
- Look at the footer: "Strongest vs weakest" and a pair with an arrow.
- Click the view button in the header (a small grid icon, or three bars when every timeframe is shown) to switch between the three groups and a column for every timeframe.
- Drag the panel by its header. Click the minimise button (a dash) to shrink it to a bar that still shows the strongest and weakest currency. Click the bar to open it again.
- On that chart it remembers its position, view and minimised state when you switch timeframes.
Inputs, in plain words
Strength
- Short term timeframes (default M5, M15, M30). Comma separated.
- Medium term timeframes (default H1, H4).
- Long term timeframes (default D1, W1).
- Up to 12 timeframes across the three groups. MT4 accepts M1, M5, M15, M30, H1, H4, D1, W1 and MN1. MT5 also accepts M2, M3, M4, M6, M10, M12, M20, H2, H3, H6, H8 and H12. Unknown names and repeats are skipped.
- Lookback in bars (default 12, from 1 to 500). How many bars back on each timeframe the change is measured.
- Values shown: Score 0-10 (default) or % change.
- Sort currencies by: Overall (default), Short term, Medium term, Long term or Fixed order. The strongest and weakest currency (and the footer pair) follow this choice. With Fixed order they come from Overall.
- Columns at start: Short / medium / long term (default) or every timeframe.
- Refresh every N seconds (default 1, from 1 to 3600).
Symbols
- Symbol prefix and Symbol suffix. Leave both blank to detect them automatically (EURUSD.a, EURUSDm and so on): it reads them from the chart symbol when that is one of the 28 pairs, otherwise from your broker's EURUSD symbol. Fill them in only if detection fails.
Dashboard
- Corner (Top left by default), Horizontal offset from the corner and Vertical offset from the corner (12 / 28 px).
- Theme: Auto (follows the chart background, the default), Dark or Light.
- Font (Segoe UI) and Font size (9). The layout rebuilds around them.
- Start minimised (off).
The panel explained
- # is the rank. Ccy is the currency.
- One column per group (Short, Medium, Long) or per timeframe. Each cell is the currency's value on that horizon, coloured from deep red to vivid green.
- Overall has a bar and a value: score 0-10, or average % change.
- The strongest currency's code is shown in green and the weakest in red.
- Footer left: Strongest vs weakest with the pair and an arrow: up means the strong currency is the base (the pair has been rising), down means it is the quote.
- Footer right: "Updated HH:MM" (server time), "Loading history N/N", "N/28 pairs" before the time if your broker lacks some, or "No currency pairs found".
- A "-" in a cell means no data yet for that currency on that horizon.
How strength is calculated
For each timeframe it takes the change of every available pair's close over the lookback, as a log return in % (almost the same as the plain % change for normal moves), adds it to the base currency and subtracts it from the quote currency, and averages each currency over its pairs. Scores rescale the eight currencies to 0-10 on each timeframe, so the strongest is 10 and the weakest 0. Groups average their timeframes, and Overall averages the groups.
FAQ and troubleshooting
The panel says "Loading history".
- Wait a few minutes. The terminal downloads history for the pairs and timeframes you chose. More timeframes means more to load.
It says "No currency pairs found".
- Your broker uses unusual symbol names, or the pairs are hidden. Open Market Watch, right-click, Show All, then fill in the prefix and suffix inputs.
It shows "20/28 pairs".
- Your broker does not offer all 28. The meter skips missing pairs and uses the rest, so values are less complete.
Cells show "-".
- Not enough bars on that timeframe yet. Wait for history to load, or open a chart of a missing pair on that timeframe once so the terminal downloads it.
Nothing appears on the chart.
- Check the indicator is listed in the chart's indicator list (Ctrl+I). The panel may be off-screen: change Corner, or reset offsets to 12 / 28.
- If none of the timeframe inputs is valid, it does not start and the Experts log shows "No valid timeframes in the inputs". Use names such as M5,M15,M30 (on MT4, only the standard nine timeframes).
Does it need internet, DLLs or AutoTrading?
- No. It reads your broker's prices only.
Does it trade or give signals?
- No. It ranks currencies. You choose the pair, the entry and the risk.
Does it work for scalping?
- Set the Short term group to M1, M5 and M15 and lower the lookback. It is still analysis, not a signal.
Will it slow my terminal?
- It runs on a timer, not on every tick, and redraws only when something changes.
After an update the old version still runs.
- In the Market, Purchased, press Update. Then remove the indicator from the chart and drag it on again.
Version history
- 1.00 (2026-11-09), MT5 and MT4: first publish. 28 pairs, 8 currencies, Short / Medium / Long term and Overall, dark and light themes, minimised bar.
- 2026-11-09, MT5 and MT4: description revised. No new file, so the version stays 1.00.
Learn more
- How to pick the strongest vs weakest currency pair
- Using currency strength (USD) as context when trading gold XAUUSD
Links
- MT5: https://www.mql5.com/en/market/product/207105
- MT4: https://www.mql5.com/en/market/product/207106
- Website: https://duofxlabs.com/currency-strength-meter/
Trading forex and CFDs is high risk. This indicator is a market analysis tool for educational and informational purposes only. It is not financial advice and does not guarantee results.