Best Forex Indicator Settings: How to Optimize Trading Indicators and Avoid Common Mistakes

Best Forex Indicator Settings:
How to Optimize Trading Indicators and Avoid Common Mistakes
Introduction
Technical indicators play an important role in Forex trading. They help traders identify trends, measure momentum, detect potential reversals, and find entry opportunities. However, using incorrect indicator settings can generate misleading signals and lead to poor trading decisions.
Many beginners use default settings without considering their trading style, timeframe, or market conditions. A configuration that works for a swing trader may not be suitable for a scalper trading XAUUSD on M5.
Indicator Settings Optimization means adjusting technical indicator parameters to better match a specific trading strategy. The goal is not to find perfect settings, but to build a consistent trading system with reliable signals and controlled risk.
In this guide, we explore how to optimize popular Forex indicators, choose suitable parameters, and avoid common beginner mistakes.
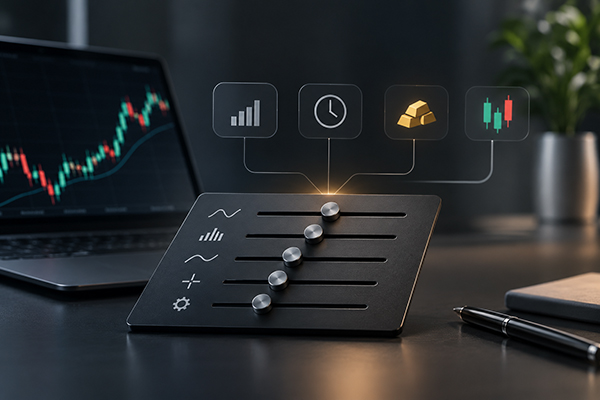
What Is Indicator Settings Optimization?
Indicator Settings Optimization is the process of adjusting technical indicator parameters to improve their usefulness within a trading strategy.
Most indicators have default settings. For example:
RSI: 14 periods
MACD: 12, 26, 9
Moving Average: 20, 50, or 200 periods
Stochastic: 5, 3, 3
ATR: 14 periods
These settings are common starting points, but they are not suitable for every market or trading style.
A trader analyzing XAUUSD on M5 may require different settings from someone trading EURUSD on H4. The right configuration depends on the strategy, volatility, and timeframe.
Why Indicator Settings Matter in Forex Trading
1. Different Markets Have Different Behaviors
Forex pairs, gold, and indices have different volatility characteristics. For example, XAUUSD can experience sharp movements during London and New York sessions.
An indicator configured for slower market conditions may react too slowly during periods of high volatility.
Adjusting parameters can help make signals more relevant to the instrument being traded.
2. Timeframes Affect Indicator Performance
Lower timeframes such as M1 and M5 contain more market noise and frequent price fluctuations. Shorter indicator periods can react faster but may generate more false signals.
Higher timeframes such as H1 and H4 generally provide a broader market perspective. Longer indicator periods may help traders focus on significant movements.
3. Trading Styles Require Different Settings
Scalpers usually need faster signals, while swing traders focus on broader market movements.
Using identical indicator settings for every trading style can result in delayed entries or unnecessary signals.
How to Optimize Technical Indicator Settings Step by Step
Step 1: Define Your Trading Strategy
Before changing indicator parameters, determine what you want the indicator to accomplish.
Are you looking for trend direction, momentum confirmation, overbought and oversold conditions, or entry signals?
For example, a trend-following trader may use Moving Averages, while a momentum trader may prefer RSI or MACD.
Never optimize indicators without a clear trading objective.
Step 2: Start With Default Parameters
Understand how the standard settings work before making adjustments.
For example, when testing RSI, compare periods such as 9, 14, and 21 while keeping your entry and exit rules unchanged.
Change one parameter at a time so you can identify which adjustment makes a meaningful difference.
Step 3: Backtest Different Settings
Backtesting allows you to compare indicator configurations using historical price data.
Do not focus exclusively on win rate. Consider these important metrics:
Profit factor
Maximum drawdown
Risk-to-reward ratio
Number of trades
Average profit per trade
A configuration with a higher win rate is not necessarily more profitable if its losses are significantly larger.
Step 4: Test Different Market Conditions
Do not optimize indicators using only trending markets.
Evaluate their performance during trends, consolidations, breakouts, and high-volatility periods.
After backtesting, use forward testing on a demo account or unseen historical data to evaluate whether the results remain consistent.
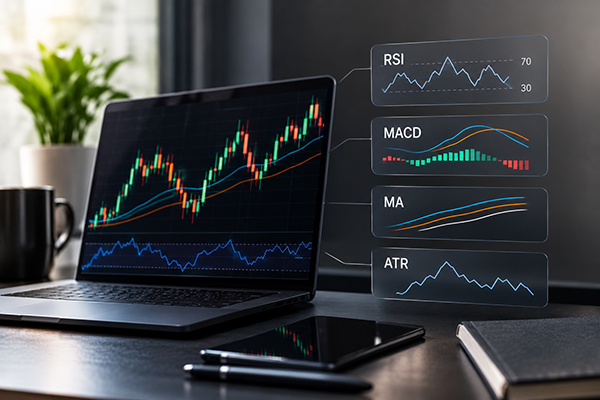
Best Indicator Settings for Popular Forex Indicators
1. RSI Settings Optimization
The Relative Strength Index (RSI) measures momentum and helps identify overbought and oversold conditions.
Its standard setting is 14, with traditional levels of 70 and 30.
Common configurations include:
RSI 7 or 9: Faster reactions, often used by scalpers.
RSI 14: A popular starting point for general trading.
RSI 21: Slower reactions for broader market analysis.
Shorter settings may identify momentum changes earlier but can also produce more false signals.
Remember that an RSI reading above 70 does not automatically mean the market will reverse. Strong trends can remain overbought for extended periods.
2. MACD Settings Optimization
MACD (Moving Average Convergence Divergence) identifies momentum changes and potential trend shifts.
Its standard configuration is 12, 26, and 9.
Traders can experiment with faster settings for short-term trading or slower configurations for broader trend analysis.
MACD crossovers can provide useful confirmation, especially when combined with price action and important support and resistance levels.
However, not every crossover represents a valid trading opportunity.
3. Moving Average Settings Optimization
Moving Averages help identify market direction and dynamic support and resistance.
Popular settings include:
EMA 20: Short-term market direction.
EMA 50: Intermediate trend analysis.
EMA 100: Broader trend structure.
EMA 200: Long-term market direction.
Scalpers may use EMA 20 and EMA 50, while swing traders often monitor EMA 50 and EMA 200.
Avoid adding too many Moving Averages to your chart. Keep your analysis simple and focused.
4. ATR Settings Optimization
Average True Range (ATR) measures market volatility rather than price direction.
The standard setting is 14 periods.
ATR can help traders adjust stop-loss distances, evaluate market volatility, and avoid using identical stop distances across different instruments.
For example, a stop loss suitable for EURUSD during a quiet session may be too tight for volatile XAUUSD conditions.
Common Indicator Optimization Mistakes Beginners Should Avoid
1. Overfitting Historical Data
Overfitting happens when traders adjust indicator settings until they produce excellent backtesting results but fail in live market conditions.
To reduce this risk, test your strategy on separate historical periods and different market environments.
2. Changing Too Many Parameters
Changing several indicator settings simultaneously makes it difficult to understand which adjustment improves performance.
Modify one parameter at a time and document the results.
3. Ignoring Trading Costs
Spread, commission, and slippage can significantly affect profitability, especially for scalpers.
Always include realistic trading costs when evaluating a strategy.
4. Using Identical Settings on Every Timeframe
An indicator configuration designed for M5 may behave differently on H1 or H4.
Test your parameters on the timeframe you actually trade rather than assuming they will work everywhere.
5. Constantly Searching for Perfect Settings
No indicator configuration works perfectly in every market condition.
Avoid changing your settings after every losing trade. Evaluate performance over a sufficient sample of trades before making adjustments.
How to Build a More Reliable Indicator Strategy
A practical trading system should combine indicators with clearly defined responsibilities.
Consider this framework:
Trend Direction: Use Moving Averages to identify the broader trend.
Momentum Confirmation: Use RSI or MACD to evaluate market momentum.
Volatility Measurement: Use ATR to assess market conditions.
Entry Confirmation: Wait for a predefined price action or indicator signal.
Risk Management: Define stop loss, take profit, and position size before entering.
Keeping your trading rules simple makes it easier to backtest, evaluate, and improve your strategy.
Maintain a trading journal and record indicator settings, market conditions, and trade results. This helps identify which configurations work consistently and where improvements are needed.


Recommended Trading Indicators for Forex Traders
TW Volume Signal Pro MT5
TW Volume Signal Pro is designed for traders interested in volume-based analysis and gold trading. It provides trading signals, predefined stop-loss and take-profit levels, trend-change detection, alerts, and multiple profit targets.
TW Scalper Shoot MT5
TW Scalper Shoot is a trend-scalping indicator designed for M5 and M15 trading. It combines price action, Fibonacci levels, support and resistance, Moving Averages, volume analysis, and AI-based noise reduction.
Both tools can support a more structured trading workflow, but traders should test their performance and always apply independent risk management.
Conclusion
Indicator Settings Optimization is not about finding magical numbers or eliminating losing trades. It is about understanding how technical indicators work and selecting parameters that support your trading strategy.
Start with standard settings, test adjustments systematically, evaluate different market conditions, and avoid overfitting historical data.
Ultimately, a simple trading system with consistent rules, proper indicator settings, and disciplined risk management is more valuable than a complicated strategy overloaded with technical tools.