Is Your EA Still Working? How to Monitor It and When to Pause It

This article is for informational and educational purposes only. It does not constitute financial advice or an investment recommendation. Trading in financial markets carries a high risk of loss.
Introduction
Every Expert Advisor goes through losing periods, and every trader running one eventually asks the same question: is this a normal bad run, or has the EA stopped working? Answering it by feeling usually leads to the worst decisions, such as switching off a good EA at the bottom of a drawdown or keeping a broken one running for months.
This is the fourth and last article in a series on evaluating an Expert Advisor. It is divided into three sections. The first explains what to track and how to compare it with the backtest. The second shows how to tell a normal bad period from a real change. The third covers how to decide what to do, using rules written in advance.
1. What to track
A simple monitoring log
Monitoring an EA does not require complex tools. A weekly or monthly record of a few figures, compared with the same figures in the backtest, is enough to detect most problems early.
| Figure | Compare with | What a deviation may mean |
|---|---|---|
| Number of trades | Trades per month in the backtest | Wrong hours, filters or settings, or a different market |
| Win rate | Backtest win rate and its uncertainty | A change in the edge, once there are enough trades |
| Average trade | Backtest Expected Payoff | Costs, execution or the edge itself |
| Current drawdown | Backtest maximum and the levels you defined | A normal bad run or a real deterioration |
| Longest losing streak | Longest streak in the backtest | Usually normal up to a point; see the levels below |
| Spread and slippage per trade | Costs assumed in the backtest | The broker or the execution is more expensive than tested |
If several EAs run on the same account, use their magic numbers to separate the results of each one.
Compare with a range, not with a line
The backtest curve is only one of many possible paths. Live results should be compared with the range of normal outcomes around it. That range can be estimated by building many random sequences from the backtest trades, as shown in the article on choosing risk and capital for an EA.
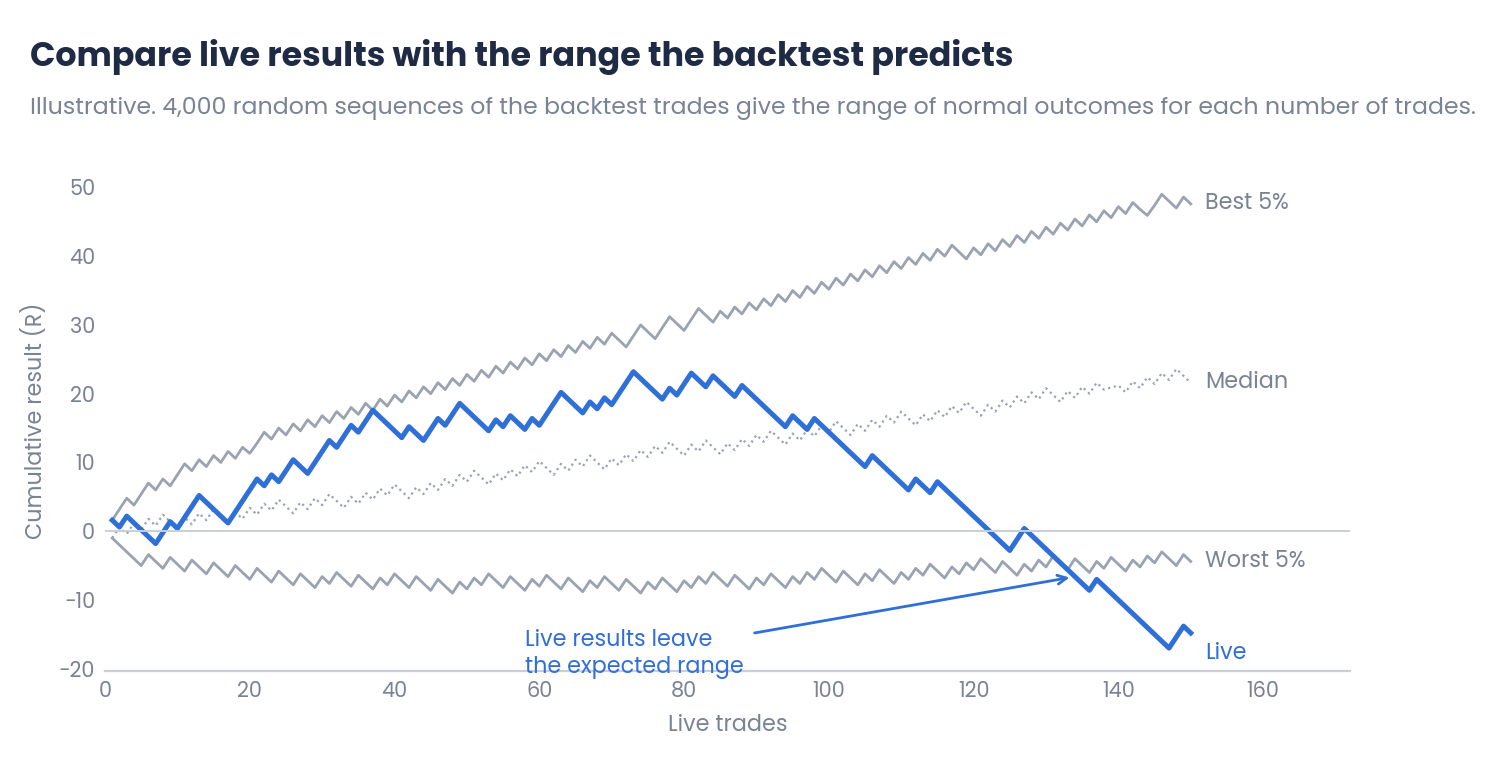
Figure 1. Live results compared with the range of outcomes expected from the backtest (illustrative)
While the live curve stays inside the range, even a disappointing period is compatible with the backtest. When it falls below the worst 5% of the expected outcomes, something may have changed and it deserves a closer look.
2. A normal bad period or a real change?
The number of trades decides how much a result means
A negative average trade after a few weeks does not prove that the EA has stopped working. With few trades, the average moves a lot by chance. A simple way to judge it is to calculate the range in which the live average trade would normally fall if nothing had changed:
Normal range ≈ Backtest average trade ± 2 × Standard deviation of trades ÷ √(Live trades)
The standard deviation of the backtest trades can be calculated from the trade list in the report.
Step-by-step example
| Step | After 60 trades | After 200 trades |
|---|---|---|
| 1. Backtest average trade | +12 USD | +12 USD |
| 2. Standard deviation of trades | 80 USD | 80 USD |
| 3. Margin: 2 × 80 ÷ √trades | 2 × 80 ÷ 7.75 = 20.7 | 2 × 80 ÷ 14.1 = 11.3 |
| 4. Normal range of the average | −8.7 to +32.7 USD | +0.7 to +23.3 USD |
| 5. Live average trade | −5 USD | −5 USD |
| 6. Reading | Inside the range | Outside the range |
Illustrative values. The calculation assumes that trades are independent and is only a guide.
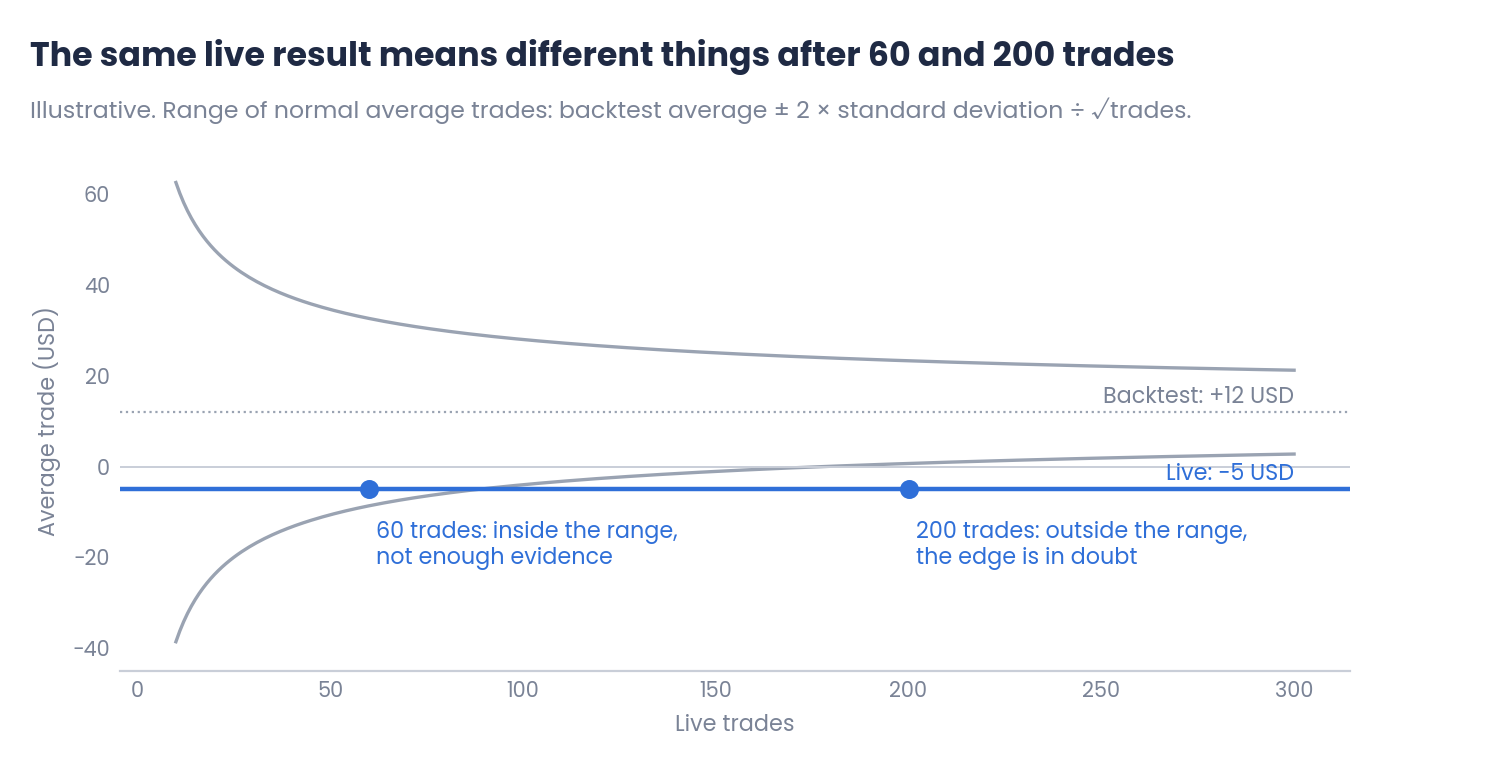
Figure 2. Normal range of the average trade as the number of live trades grows (illustrative)
The same −5 USD average means very little after 60 trades and quite a lot after 200. Patience at the start and firmness once there is enough evidence are both part of the same method.
Knowing the strategy helps to interpret it
If you know what the EA does, you can check whether the market is still giving it the conditions it needs. A trend-following EA will struggle in a long sideways market, and a range EA during strong trends. Volatility much lower or higher than usual, which can be measured with the ATR ratio described in the article on ATR volatility, can also explain a bad period. An EA that loses in conditions it was never designed for is different from one that loses in the conditions where it used to work.
3. Deciding what to do
Levels defined in advance
As explained in the previous article of this series, the rules for pausing an EA should be written before it goes live. A common approach is to set drawdown levels based on the backtest maximum:
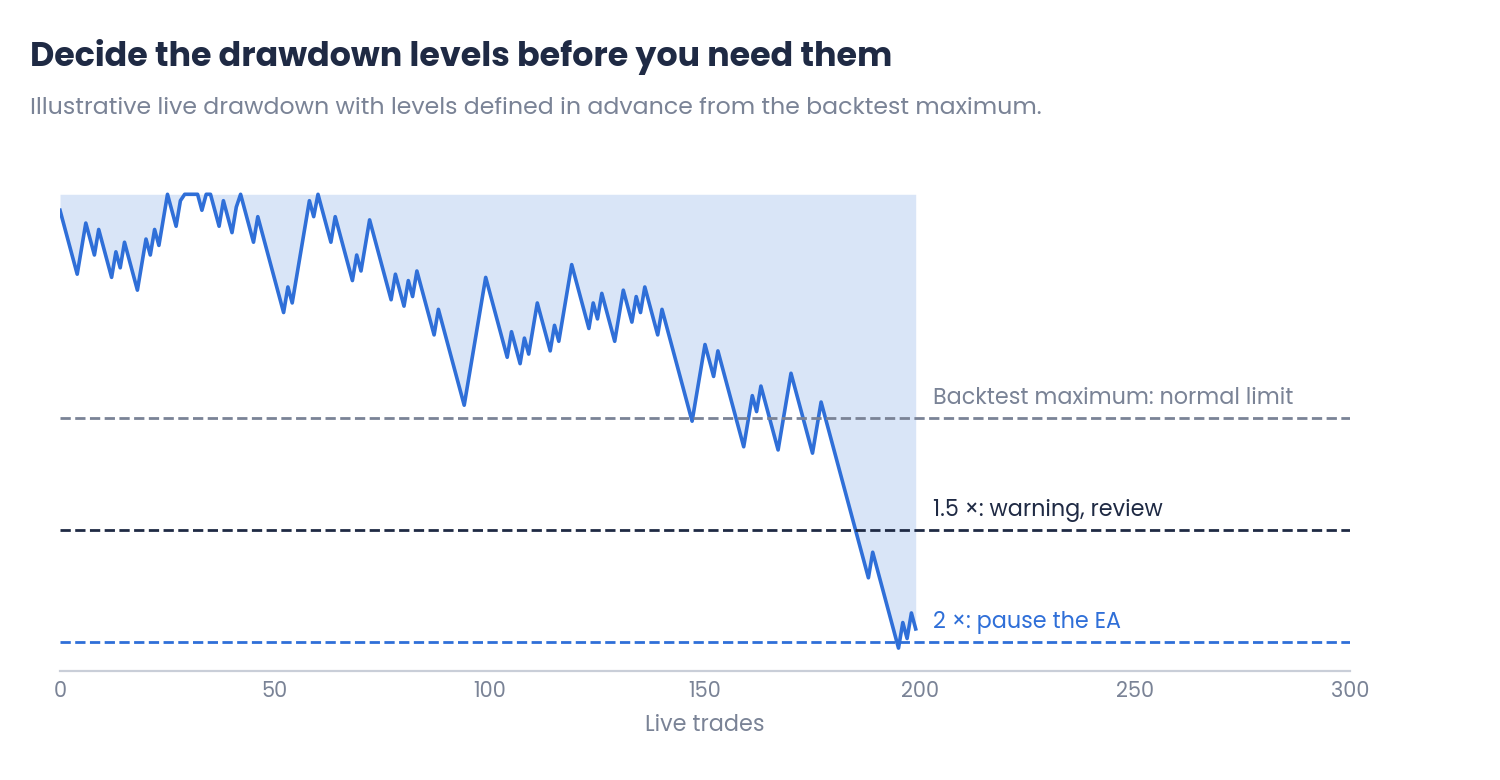
Figure 3. Live drawdown with levels defined in advance (illustrative)
| Situation | Possible action |
|---|---|
| Results inside the expected range | Keep running it without changes |
| Drawdown beyond the backtest maximum | Review execution, costs and market conditions |
| Drawdown about twice the backtest maximum | Pause it, or move it to demo and keep watching |
| Average trade outside its range with enough trades | Pause it and review whether the edge still exists |
| Technical problems: wrong hours, rejected orders | Stop it immediately and fix the cause |
Indicative levels. Each trader should define them according to the strategy and the risk accepted.
Less is more: do not re-optimise after every loss
When an EA goes through a bad period, the temptation is to optimise it again on the most recent data. Doing so fits the parameters to the last few weeks, which is the same mistake as fitting them to the past in the backtest. A small number of well-understood EAs, with stable settings and clear rules for pausing them, is easier to evaluate than a portfolio that changes every month. Changes should come from a review with enough data.
Common mistakes
- Comparing with the backtest curve. Compare with the range of normal outcomes.
- Deciding after a few trades. Early results are dominated by chance.
- Changing the rules during a drawdown. The levels should be fixed before going live.
- Re-optimising after every losing period. It fits the EA to recent noise.
- Ignoring technical deviations. Trades at the wrong time or rejected orders need action at once, whatever the results.
Conclusions
- What to track: number of trades, win rate, average trade, drawdown, losing streaks and costs, compared with the backtest. Compare the live curve with the range of normal outcomes.
- A bad period or a real change: the number of trades decides how much a result means. A simple range for the average trade shows when there is enough evidence, and knowing the strategy helps to explain a bad period.
- Deciding what to do: use levels and rules written before going live, pause instead of improvising, and avoid re-optimising after every loss. Less is more: fewer EAs, stable settings and clear rules.
Evaluating an EA does not end when it goes live: the backtest gives the expectations, and monitoring checks whether they still hold. This series has covered the whole process, from reading a backtest to deciding whether an EA is still working. Test any EA with your own data on demo or in the Strategy Tester, and combine it with disciplined risk management.
References
- Robert Pardo, The Evaluation and Optimization of Trading Strategies, 2nd edition, 2008.
- MetaTrader 5 Help: account history and trading reports.
Disclaimer
This content is for informational and educational purposes only. It does not constitute financial advice or a recommendation to buy or sell any instrument or product. Past results and simulations are not a forecast. The charts and examples are illustrative, and every strategy, account and broker is different. Trading forex, CFDs and other leveraged products carries a high risk of loss. Every trading decision, and its outcome, is the sole responsibility of the reader. The author accepts no liability for any loss arising from the use of this information.