
Range Trading for MT4 and MT5: How to Trade Ranges, Failed Breaks and Breakouts with Supreme Range Profile Structure

1. Introduction
Markets spend long stretches going sideways, and a range is where many trading plans begin: buy near the low, sell near the high, fade the move that pokes out and fails, or join the move that leaves for good. Done by hand, every chart asks four questions. Where exactly are the edges? Is this a range or only a pause in a trend? Where inside it did the volume trade? And when price closes outside, is it a breakout or a trap?
Supreme Range Profile Structure answers those questions by fixed rules and draws the answers. It draws a range only when recent swing highs and swing lows cluster tightly, alternate often enough, span enough bars and fit an ATR width window. It builds a volume profile inside the range with its point of control (POC), marks every move that closed outside and then closed back inside with a diamond, and when closes are accepted beyond an edge it tags the break and draws a position tool: an entry, a stop and three targets, all measured from the range.
This guide explains the rule behind every drawing, walks through real charts, and ends with a read of any range in about ten seconds. The diagrams and the checklist (Figures 2, 3 and 7) illustrate a rule and say so in their captions; Figures 4 to 6 are real MetaTrader charts.
2. What It Draws
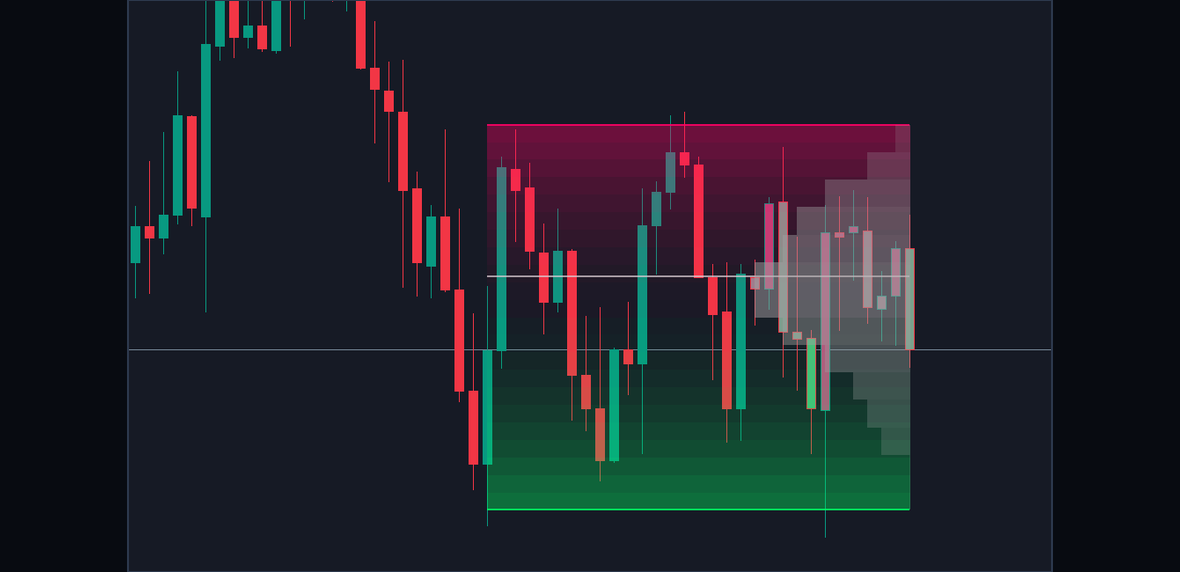
Figure 1. An active range, annotated: the two edge lines, the two-colour shading, the volume profile rows against the right end, the point of control and the tinted candles.
Every drawing comes from a range, the active one or a completed one kept behind it.
- The range itself, a band from the bar of its oldest swing to the newest bar. Gradient Smoothness (22) layers shade it: the upper half in the bearish colour, the lower half in the bullish colour, strongest at the edges and clear in the middle. A completed range keeps a fainter shading.
- Two edge lines, the top edge in the bearish colour and the bottom edge in the bullish colour. While the range is active, each line becomes more solid with every swing that touches it, so a glance shows which edge has been touched more often.
- The volume profile, Profile Rows (14) horizontal rows growing leftwards from the range's right end, each as long as the volume traded at its prices. The rows are grey while the range is active and take the colour of the break once it ends.
- The point of control, a line across the whole range through the busiest row.
- Diamonds at the extreme of every move that closed outside the range and then closed back inside it: above the range in the bearish colour, below it in the bullish colour.
- The BREAKOUT or BREAKDOWN tag on the broken edge, on the bar that confirmed the break.
- The position tool drawn from that bar: ENTRY, SL, TP1, TP2 and TP3 with a reward box and a risk box.
- Candle colours while a range is active, by where each bar closes inside it.
- The equilibrium, a dotted line at the middle of the range, off by default.
The chart keeps the last 10 completed ranges (Completed Ranges) with their profile, tag and position tool, and the newest 30 diamonds (Deviation History). The Data Window (Ctrl+D) shows Active Range High and Active Range Low for every bar of an active range.
One rule about time runs through the whole guide. Breaks, deviations, their tags and position tools, and every alert are decided on a closed bar and never change afterwards. The search for a range, the active range's edges and profile, and the colour of the newest candle are also worked out while a bar is forming, so the newest part of the chart can still move until that bar closes.
3. How a Range Is Found
Swings. A swing high is a bar whose high none of the 5 bars before it exceeds and none of the 5 bars after it reaches (Swing Length, 5). Because those later bars have to close first, a swing is confirmed 5 bars after it formed. Swing lows are the mirror image. The indicator keeps the newest 10 swings (Swing Memory), and two highs in a row merge into the higher one, two lows into the lower one, so the memory always alternates between highs and lows.
ATR. Every width, tolerance and buffer is measured in the Average True Range over 14 bars (ATR Length). The same settings therefore fit a quiet forex pair and a fast index: a range is wide or narrow for its own market, not in points.
The search. While no range is active, on every bar the indicator tests the newest swings as a set. It starts with the smallest allowed set and adds one older swing at a time, up to the whole memory. The smallest set is the larger of twice Touches Per Edge and Minimum Rotations plus one: 4 swings at the defaults. A set is a range when all of these hold:
- it holds at least 2 swing highs and at least 2 swing lows (Touches Per Edge, 2);
- it has at least 3 rotations between highs and lows (Minimum Rotations, 3), and with alternating swings a set of six swings has five;
- its highs lie within twice Edge Stability ATR of each other, from the lowest to the highest, which is 0.6 ATR at the default of 0.30, and its lows do the same;
- the top edge is the average of its highs and the bottom edge the average of its lows, and the height between them is at least 1 and at most 6 ATR (Minimum Width ATR, Maximum Width ATR);
- its oldest and newest swings are at least 8 bars apart (Minimum Range Span, 8).
The largest set that passes wins, so the range takes in as many swings as fit. It starts at the bar of its oldest swing, at most 1,500 bars back.
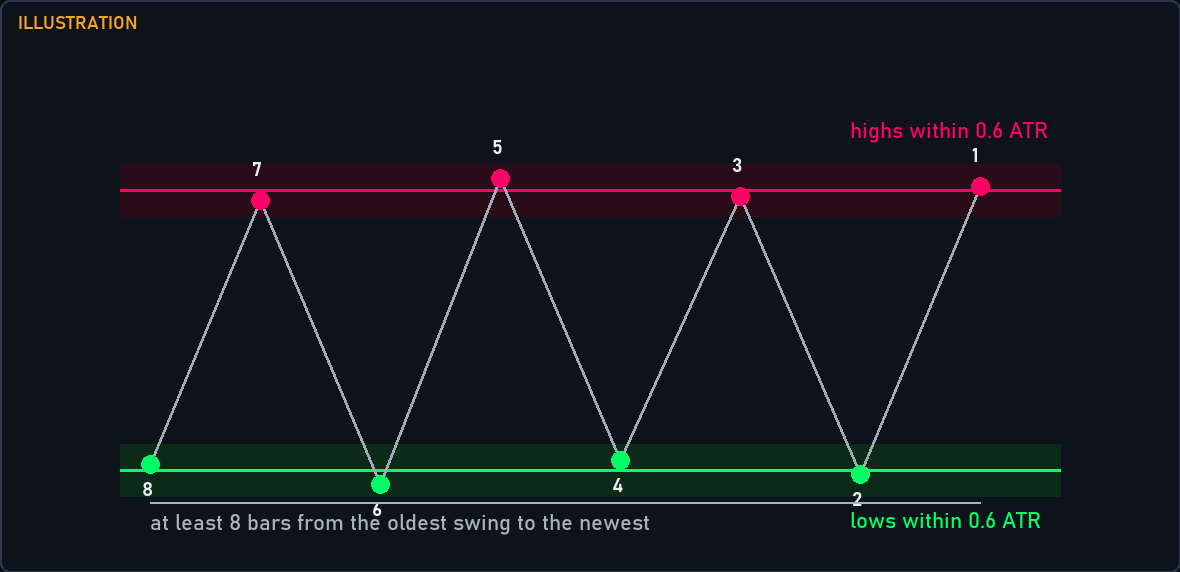
Figure 2. Illustration of the rule: alternating swing highs and lows cluster at two levels, with enough touches on each edge, enough rotations between them and enough bars between the first and the last swing, and the height fits the ATR width window.
Because the edges are averages of the swing prices, some wicks poke through them. That is expected: an edge marks the centre of a cluster of turns, not the most extreme tick, and it is exactly the area where a range trader watches for the next turn.
Edges that adapt. While a range is active, a new swing high that formed inside the range and lies within one Edge Stability ATR of the top edge is a touch. Each touch moves the top edge 20 percent of the way toward that swing (Edge Adaptation, 0.20) and makes its line more solid. Swing lows do the same for the bottom edge, and a swing farther from the edge changes nothing. Each edge starts with as many touches as the range had swings on that side.
Why the rules matter. A trend also makes swing highs and lows, but they step up or down instead of clustering. Asking for clustered highs, clustered lows, alternation and a minimum span is what separates a balance area from a pause. When the rules are not met, the chart shows no active range, which is information too: there is no range to trade.
When a range ends. A range ends when it breaks (section 6), or, if you set Maximum Range Age above its default of 0, when it has been active that many bars. Then the remembered swings are cleared and the search waits New Range Cooldown (4) bars, so the next range is always built from fresh swings.
4. The Volume Profile and the Point of Control
The range's height is split into 14 rows of equal height. Every bar from the range's first bar on adds its tick volume to the rows its high-to-low span covers, shared out by how much of its span lies in each row; the part of a bar outside the range adds nothing. When an edge moves, the profile is built again from the range's first bar, so the rows always fit the current edges.
The busiest row is drawn 40 percent of the range's length in bars long (Profile Width %), and at least 2 bars. Quieter rows are shorter and fainter, and empty rows are not drawn. The POC line runs across the whole range through the middle of the busiest row; if two rows tie, the lower one is used, and no line is drawn while the range has no volume.
Volume here is MetaTrader's tick volume, the number of price changes in a bar. It measures activity, not contracts traded, and another broker's feed can give other rows.
How to read the profile:
- POC near the middle. Trade has been two-sided around the centre of the range. A move from one edge toward the other passes through the busiest prices on the way.
- POC near an edge. Most of the range's activity took place near that edge. Some traders read it as acceptance of those prices, others as orders building up against a break. The profile shows where the trade happened, not what comes next.
- Thin rows. Prices where little traded were crossed quickly. Inside a range they can separate two busier areas.
For trading, the POC is a reference level inside the range: a first objective for a trade taken at an edge, and a place for a tighter stop on a trade taken at a break.
Trading inside the range. The simplest range trade uses the edges and the POC. Wait until price closes near an edge, look for your own sign that it is turning there, put the stop beyond that edge plus the break buffer, where a close would start a break, and use the POC as the first objective and the opposite edge as the second. While the range is active its edges can still move with new touches, so check them again before you act.
5. Deviations: The Failed Breaks
A move out of a range starts the same way whether it becomes a break or fails. The indicator uses a buffer of Break Buffer ATR (0.10) times the ATR beyond each edge. A closed bar that closes more than the buffer above the top edge is outside up; one that closes more than the buffer below the bottom edge is outside down. Wicks never count, only closes.
From the first close outside, the indicator tracks the move's extreme: the highest high of a move up, the lowest low of a move down. If a later closed bar closes back inside, between the two edges, while the range is still active, the move is a deviation. No buffer applies on the way back. A diamond is then placed at the extreme, on the bar that made it, which can be several bars before the bar that came back: above the range in the bearish colour, below it in the bullish colour.
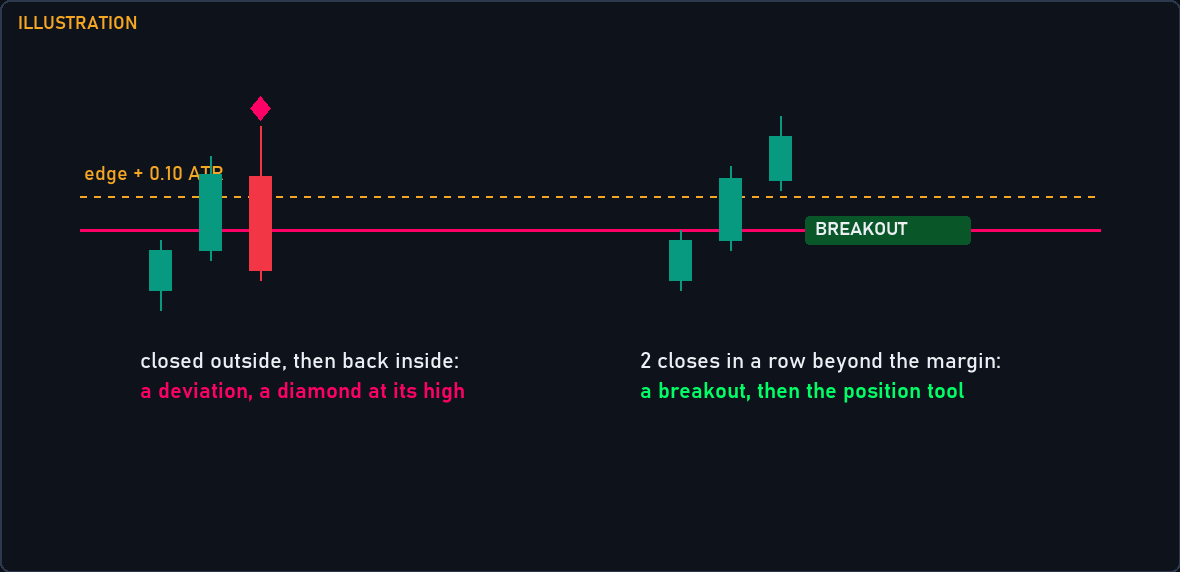
Figure 3. Illustration of the rule: closes beyond the edge plus the ATR buffer count toward a break, two in a row confirm it, and a close back inside instead puts a diamond at the move's extreme.
Two details decide many charts. A close between an edge and its buffer is neither outside nor back inside: it resets the break count and leaves the deviation open. And if the move becomes a break instead, no diamond is drawn.
How traders use a deviation. It is the classic failed breakout: price closed outside the range, found no acceptance and closed back inside. The diamond gives three reference levels at once:
- the diamond's extreme, where the failed move stopped, so a stop for a fade goes beyond it;
- the POC, a first objective back inside the range;
- the opposite edge, a second objective.
Timing matters. The diamond sits on the bar of the extreme, which can be earlier than the close back inside. When you see it, the deviation has already been confirmed; act on the bar that closed back inside, which is also the bar the Range High Deviation or Range Low Deviation alert comes on. A deviation does not end the range: price can deviate again, or break later.
6. Breakouts With Acceptance
Each closed bar that closes more than the buffer above the top edge adds one to the upward count, and any other close resets it to zero. When the count reaches Break Acceptance Closes (2), the range breaks upward on that bar, a breakout. The same rule below the bottom edge gives a breakdown. Only closes count, never wicks, and the forming bar never shows a break.
On the break bar the range ends and its drawing freezes there. Its profile turns to the bullish colour after a breakout and the bearish colour after a breakdown, the BREAKOUT or BREAKDOWN tag is placed on the broken edge (Breakout Tag), the position tool is drawn (next section), and the Range Breakout or Range Breakdown alert fires.
Why two closes. A single close outside is the start of either a break or a deviation. Asking for a second close in a row gives a move that is going to fail one more bar to come back inside and be marked as a deviation; a move that fails after two closes outside is still a break. One close reacts sooner and turns some would-be deviations into breaks; three or more wait longer and confirm further from the edge. That is the trade-off of acceptance: by the time the break is confirmed, the break bar has closed more than the buffer past the edge, so the market is already away from the entry line.
A range that only ages. With Maximum Range Age above 0, a range active for that many bars ends without a break: no tag, no position tool, no alert, and its profile stays in the profile colour. If a break happens on that same bar, the age limit wins.
7. The Position Tool: Reference Levels From the Range
Every break draws a position tool from the break bar to 10 bars later (Position Width). Its levels come from the range alone:
- ENTRY at the broken edge: the top for a breakout, the bottom for a breakdown. It is not the close of the break bar.
- SL at the opposite edge, so the stop distance is the range height.
- TP1, TP2 and TP3 beyond the entry at 0.50, 1.00 and 2.00 times the range height (TP1, TP2, TP3).
- A reward box from the entry to TP3 in the break's colour and a risk box from the entry to the stop in the other colour.
- Lines: the entry solid and the stop dashed, both in the chart's text colour; TP1 and TP2 dotted and TP3 solid, in the break's colour. The labels ENTRY, SL, TP1, TP2 and TP3 sit at the tool's right end, without prices.
TP2 at one range height is the measured move many traders already use: the distance the market rotated inside the range, projected from the edge it left. TP1 at half of it is an early checkpoint, TP3 at twice the height a far one.
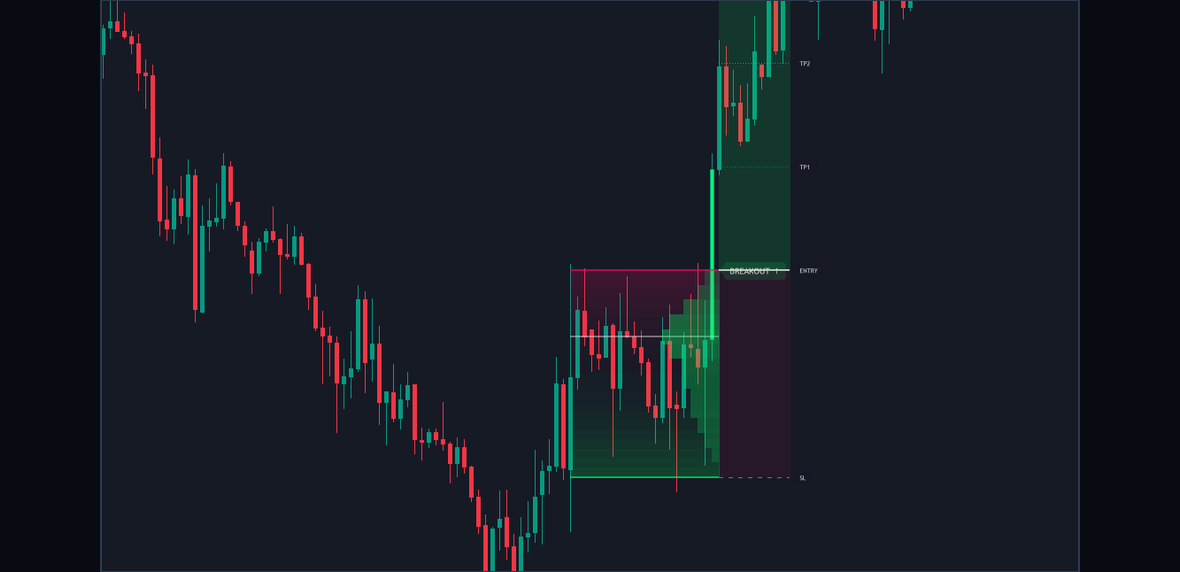
Figure 4. GBPUSD H1 on MetaTrader 5: a range broken upward, with the BREAKOUT tag on the top edge and the position tool drawn from the break bar.
A worked calculation, with round illustration values rather than prices read from the figure: a range with its top at 1.2740 and its bottom at 1.2700 is 40 pips high. A breakout's tool puts ENTRY at 1.2740, SL at 1.2700, TP1 at 1.2760, TP2 at 1.2780 and TP3 at 1.2820: a 40 pip stop against 20, 40 and 80 pips to the targets.
The levels are reference levels measured from the range, not a forecast, and the indicator does not follow the move afterwards: nothing marks a target or the stop as reached. Three ways to use them:
- Measure from your own fill. Say the break bar, the second close beyond the edge, closed at 1.2755. From there the stop at the opposite edge is 55 pips away and TP2 only 25, so the plan is no longer the one the tool drew from the edge. Work out your own distances before you decide anything.
- Wait for the edge. Some traders wait for price to come back to the ENTRY line, the old edge, and take the plan the tool drew: the stop at the opposite edge, or a tighter one inside the range, for example beyond the POC. A tighter stop loses less when it is hit and is hit more often. A retest may never come.
- Use the targets as checkpoints. Decide before entering what you do at TP1: take part off, move your own stop, or hold for TP2 and TP3. The decision and the order are yours.
Whichever way you choose, size the position from the stop. The stop distance is the whole range height, and it differs a lot from one range to the next.
8. Candle Colours
While a range is active, Range Candle Colors tints each candle by where it closes inside the range: the bullish colour at the bottom edge, the profile colour at the middle and the bearish colour at the top edge, with a blend in between at Candle Transparency (10). A close above the top edge takes the full bullish colour and a close below the bottom edge the full bearish colour. Candles outside any active range, and the bar that ends a range, keep the chart's own colours. MetaTrader 5 tints only the inside of each body, so the wick and the outline keep your colours; MetaTrader 4 colours the bodies in 26 colour steps.
The colours make the position inside the range readable at a glance. The bullish colour near the low marks the area where a range trader looks at longs, the bearish colour near the high the area for shorts. A full-colour candle closed beyond an edge; whether it counts toward a break depends on the buffer. A full-colour candle followed by a tinted one is a close back inside, and the bar on which a deviation is confirmed when the earlier close was beyond the buffer.
9. The Settings That Matter
Install the indicator from its Market page (MetaTrader 5: {{MT5_URL}}, MetaTrader 4: {{MT4_URL}}) and attach it with the defaults. All 47 inputs are described in the user manual ({{MANUAL_URL}}); these are the ones that change what you trade.
| Input | Default | What changing it does |
|---|---|---|
| Swing Length | 5 | Lower values find smaller swings and so more, tighter ranges, confirmed sooner; higher values find fewer, bigger ones. |
| Edge Stability ATR | 0.30 | Higher lets looser clusters count as a range and widens the touch zone; lower asks for cleaner edges. |
| Minimum Width ATR | 1.0 | The smallest range height in ATR; narrower clusters are not ranges. |
| Maximum Width ATR | 6.0 | The largest range height in ATR; wider clusters are not ranges. |
| Minimum Range Span | 8 | The fewest bars between the oldest and the newest swing; higher values ignore brief pauses. |
| Break Buffer ATR | 0.10 | How far beyond an edge a close must be to count as outside; 0 counts any close beyond the edge. |
| Break Acceptance Closes | 2 | Consecutive closes outside the buffer that confirm a break. |
| TP1 | 0.50 | The first target, in range heights beyond the entry. |
| TP2 | 1.00 | The second target, in range heights. |
| TP3 | 2.00 | The third target, in range heights; the reward box reaches to it. |
| Bars to calculate (0 = all) | 20,000 | How much history the ranges are found in. Where it starts decides which swings come first, so another depth can show other ranges. |
Because every width and buffer is in ATR, start with the defaults on the timeframe you trade before you change anything. If you change one setting, change one at a time and look at several ranges before you judge it.
10. Worked Examples on Real Charts
Example 1: GBPUSD H1, a breakout (Figure 4)
Read Figure 4 in the order you would read a live chart. The shading ends at the break bar, so the range is completed. Its profile has taken the bullish colour, the colour of a breakout. Look at the POC: it marks the price where the range traded most before the break. The BREAKOUT tag sits on the top edge at the bar that confirmed the break, and the position tool starts on that bar.
A plan from this picture asks three questions. How far is the break bar's close from the ENTRY line, compared with the distance to the stop at the bottom edge? Would you buy there, or wait for a return to the old top edge? And what will you do at TP1? The tool gives the levels; the answers are yours.
Example 2: EURUSD H1, a breakdown
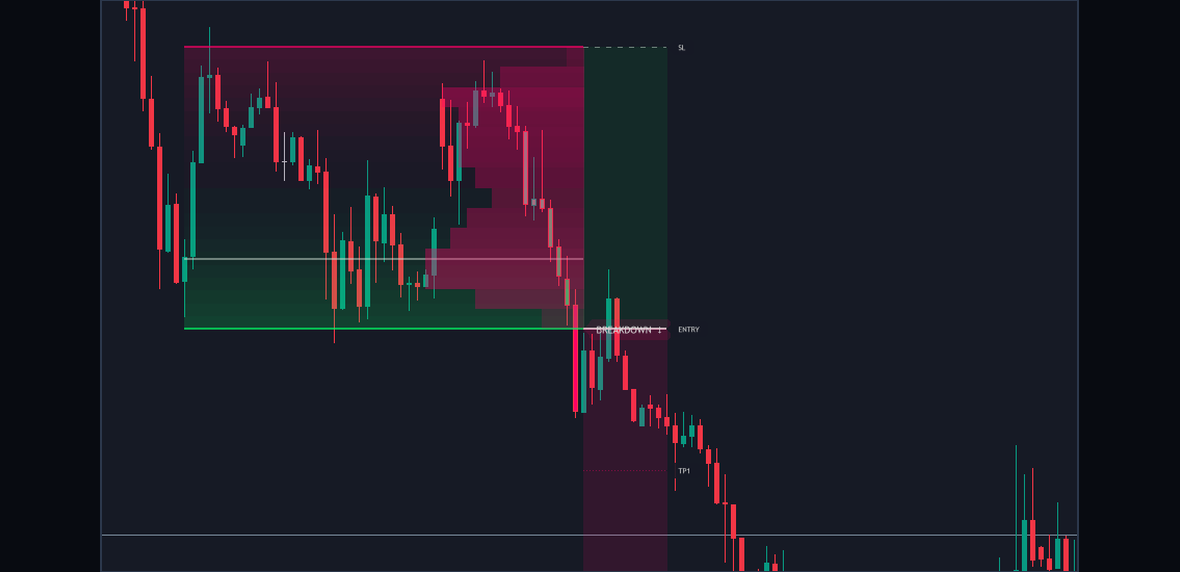
Figure 5. EURUSD H1: a range broken downward, with the BREAKDOWN tag on the bottom edge and the position tool drawn from the break bar.
A breakdown mirrors every level. ENTRY sits on the bottom edge, SL on the top edge, and TP1, TP2 and TP3 lie below at half, one and two range heights. The reward box runs down from the entry in the bearish colour, the risk box up to the stop in the bullish colour, and the range's profile has turned bearish. The same three questions apply: the distance of the break bar's close from the entry, whether to sell there or wait for a return to the old bottom edge, and the plan at TP1.
Example 3: failed breaks marked with diamonds
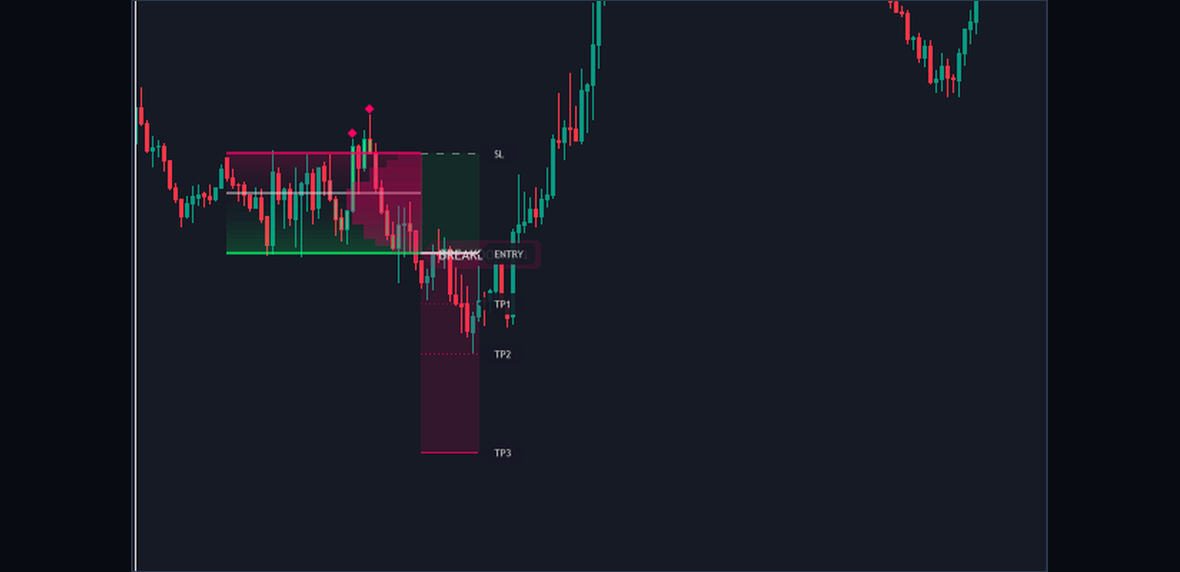
Figure 6. Diamonds at the extremes of moves that closed outside a range and then closed back inside it.
Each diamond in Figure 6 is a move that closed outside the range and then closed back inside. A diamond above the range is a high deviation, one below it a low deviation. For each one, find three levels: the diamond's own price, where a stop for a fade would sit beyond; the POC, the first objective back inside; and the opposite edge, the second. Then find the bar that closed back inside, on or to the right of the diamond: that close is where the deviation became known.
11. The Ten-Second Read
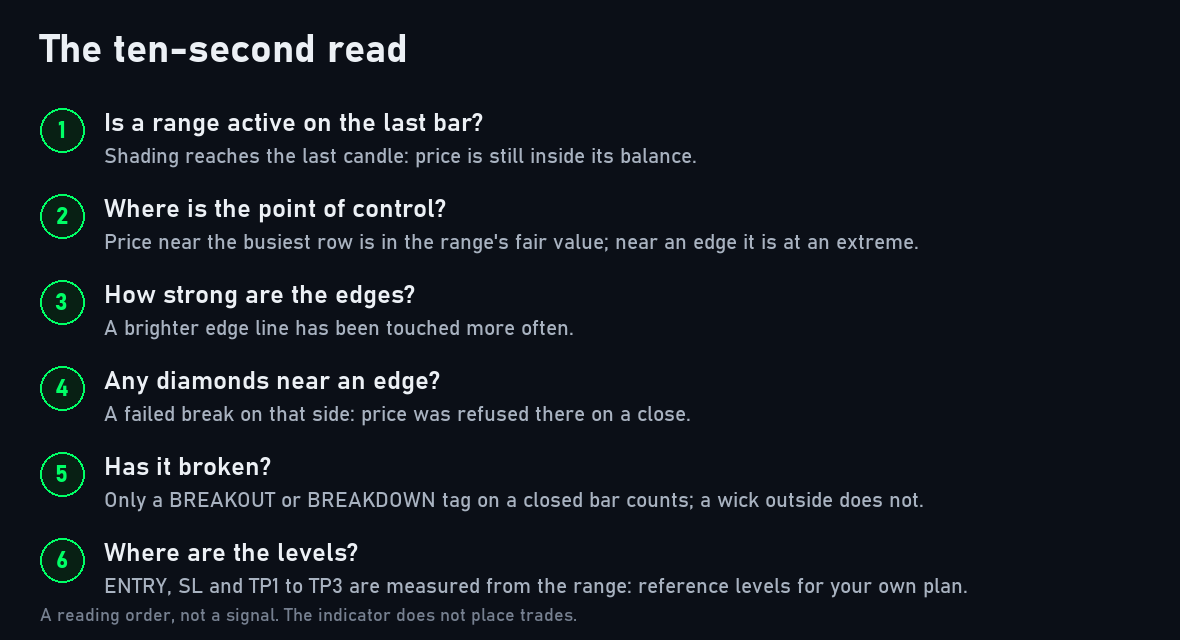
Figure 7. The ten-second read as a checklist.
When a range is on the chart, or an alert arrives, read it in the same order every time.
- Is there an active range? The shading reaches the newest bar. No range means no range trade.
- Where is price inside it? The candle colour: bullish near the low, bearish near the high, full colour beyond an edge.
- Where is the volume? The POC and the shape of the profile.
- Which edge has been touched more? The more solid edge line.
- Has a move failed recently? A fresh diamond, and on which side.
- Has it broken? A tag and a position tool, and how far price already is from the ENTRY line.
The read is yours; the indicator only lays out the evidence.
12. Three Common Mistakes
- Treating the first close outside as the breakout. One close beyond the buffer starts the count; the break needs Break Acceptance Closes in a row, and until then the move can still become a deviation. Read closed bars, not the forming one.
- Treating the position tool as an order or a forecast. Its entry is the broken edge, not your fill, and its targets are multiples of the range height. They are reference levels; measure your own distances from your own price.
- Letting the range size the trade. The stop at the opposite edge is the full range height, which differs from range to range. Size every position from its stop, and decide on a tighter stop deliberately, not by habit.
13. Alerts
Four conditions can raise an alert, each with its own switch and all on by default: Range Breakout, Range Breakdown, Range High Deviation and Range Low Deviation. A break that follows a close outside sends the break alert only, never a deviation alert as well. There is no alert for a new range, an edge touch, a range that ages out, or price reaching a level of the position tool.
Four channels deliver them: the terminal's alert window (on by default), a sound with a file of your choice, a push notification to the MetaTrader app on your phone, and e-mail; push and e-mail use the terminal's own settings. Every alert is decided on a closed bar and fires once for that bar. Nothing fires for history or in the Strategy Tester. The messages read:
Supreme Range Profile Structure broke upward | Your Broker:EURUSD Supreme Range Profile Structure broke downward | Your Broker:EURUSD Supreme Range Profile Structure deviated above the range and confirmed back inside | Your Broker:EURUSD Supreme Range Profile Structure deviated below the range and confirmed back inside | Your Broker:EURUSD
with your broker's name and the chart's symbol after the vertical bar. An alert is the moment to run the ten-second read, not an instruction.
14. What It Does Not Do
- It does not place trades. It draws and alerts; you place and manage every order.
- It does not promise a result. A range, a break or a deviation says where price has been, not where it will go. The position tool's levels are reference levels measured from the range, not a forecast.
- It does not see the future. A swing is confirmed 5 bars after it forms. Breaks and deviations wait for a closed bar; a range can still appear, and its edges and profile can still move, while a bar is forming.
- It does not read anything but your chart. The swings come from your broker's candles and the profile from its tick volume, so another feed can draw other ranges.
15. Conclusion
A range gives a trader a map: two edges that have held, the prices where the trade happened, and a clear line between a move that failed and one that was accepted. Supreme Range Profile Structure draws that map by fixed rules on every chart, and leaves the decision to you. Test it on a demo account first, keep a journal of the ranges you trade and how you used their levels, and change one setting at a time.
Risk Disclaimer
Trading leveraged products such as forex and CFDs carries a high level of risk and may not be suitable for all investors. You could lose more than your initial deposit. Supreme Range Profile Structure is an analysis tool, not financial advice; past ranges, breaks and deviations do not guarantee future results. Test it on a demo account before trading real money.