Volume Profile Indicator for MT4 and MT5: How to Trade Key Level Breaks, Rejections and Retests

1. Introduction
A volume profile answers a question a candle chart cannot: at which prices did the market actually do its business? The rows where most of the volume traded are the prices both sides accepted. The thin rows between them are prices the market passed through quickly. When price comes back to those places, it tends to react, and the reaction is where trades come from.
The idea is simple. Using it the same way every day is not. Where does the profile start? Which bulge is a real peak? Is that line still worth watching after price closed through it? Was the last candle a rejection of the level or the start of a break? Two traders marking the same chart by hand will answer differently, and so will the same trader on a tired afternoon.
That is why I built a volume profile indicator for MT4 and MT5 that answers each of those questions by fixed rules. It builds a profile of the latest bars, turns its point of control, value area and volume peaks into key levels, keeps those levels on the chart as zones and lines, and marks every bar where price breaks a level, rejects it or comes back to retest it. Everything is decided when a bar closes.
This guide explains the concepts first and the tool second. The second half is practical: what each marker means, a ten-second chart read, three trade plans built on the markers with the entry, the stop and the target written out, the mistakes that cost the most, real chart examples and the full parameter reference.
One point up front: the indicator does not trade. It draws and it alerts. Every order, every position size and every exit stays with you.
The indicator is available on the MQL5 Market for both platforms:
MetaTrader 5: Supreme Dynamic Profile MT5
MetaTrader 4: Supreme Dynamic Profile MT4
2. Volume Profile in One Page
A volume profile takes a stretch of bars, splits its price range into horizontal rows and adds up the volume that traded in each row. Drawn sideways next to the chart, it shows where the market spent its effort.
- The point of control (POC) is the row with the most volume: the price the market agreed on most.
- The value area is the band of rows around the POC that holds most of the volume, by convention 70 percent. Its top edge is the value area high (VAH), its bottom edge the value area low (VAL).
- A volume peak (a high volume node) is a row that holds more volume than its neighbours. Price often slows down and turns there, because many positions were opened at that price.
- A volume trough (a low volume node) is a row that holds less volume than its neighbours. Price tends to move through it quickly, because few positions sit there.
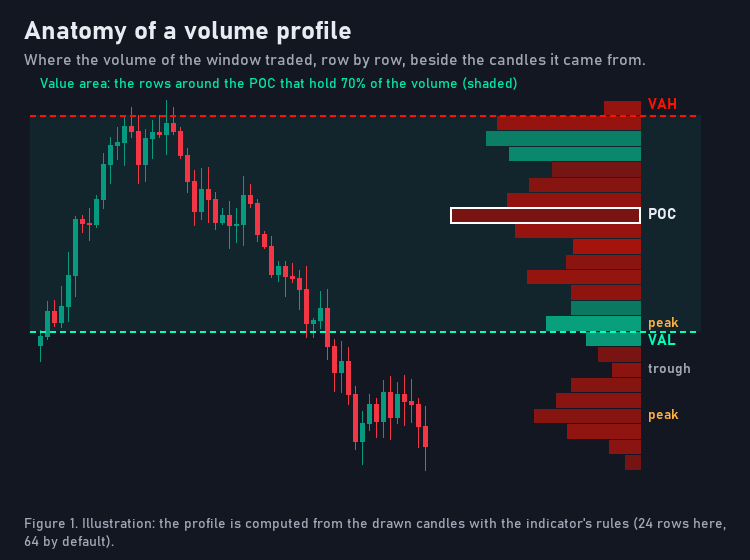
Figure 1. Illustration: the profile beside the candles it was built from, with its POC, value area, a peak and a trough.
Volume on a forex or CFD chart in MetaTrader is tick volume: the number of price changes in each bar, not the traded lots. It is a good proxy for activity, and it is what the indicator uses, so another broker's feed can build a slightly different profile.
3. What "Value" Tells You
Where price closes against the value area is the first thing to read, because it tells you who is in control right now.
- Above value: the market accepted prices above the area where most business was done. Buyers are in control, and pullbacks into the levels below are the first places to look for longs.
- Inside value: the market is in balance. Price tends to rotate between the edges, and the VAH and VAL are the levels that matter most.
- Below value: the mirror image. Sellers are in control, and rallies into the levels above are the first places to look for shorts.
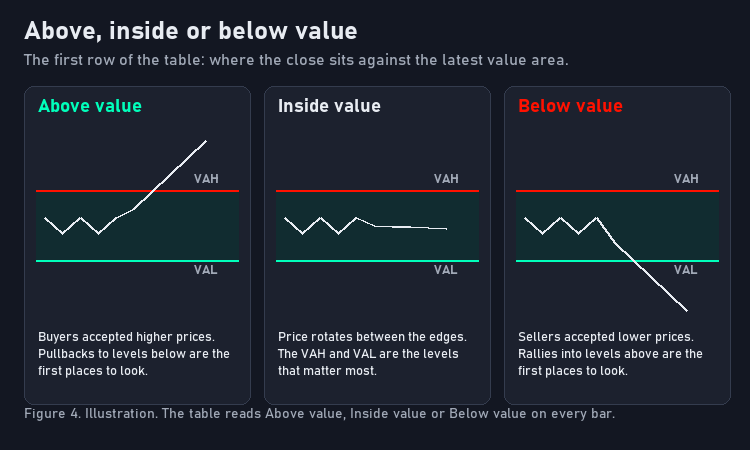
Figure 4. Illustration. The indicator's table states which of the three it is, on every bar.
This one line of context changes how the same marker should be read. A bullish rejection of a level while price trades above value is a pullback holding in the direction of control. The same marker below value is a bounce against it.
4. Introducing Supreme Dynamic Profile, a Volume Profile Indicator for MT4 and MT5
Supreme Dynamic Profile is the tool I built to put these ideas on the chart without judgement calls. It runs on MetaTrader 4 and MetaTrader 5 with one shared calculation: the same profile, the same levels and the same markers on both.
What it draws:
- The latest volume profile, to the right of the newest candle: one row per price band, longer where more volume traded, coloured by its estimated up and down volume, with an outline and marks at the POC, VAH and VAL.
- Key levels: the VAH and VAL as lines, up to 2 volume peaks as zones and the highest-volume row as a line by default. The POC, volume troughs and the lowest-volume rows can be switched on. A level is green while price closed above it last and red while it closed below it.
- Signal markers on the bar where they happen: a filled triangle for a break, a hollow triangle for a rejection, a diamond for a retest. Under the bar for a bullish signal, over it for a bearish one.
- Level labels in one column beside the profile: each level's name and its share of the profile's volume.
- A metrics table: value position, the distance to the POC in ATR, the nearest level above and below, and relative volume.
- Alerts for nine conditions, through a pop-up, a sound, a push notification or an e-mail.
Get it here:
MetaTrader 5: Supreme Dynamic Profile MT5
MetaTrader 4: Supreme Dynamic Profile MT4
5. How the Profile Is Built
The window. By default the profile covers the last 240 bars ("Fixed" lookback). In "Dynamic" mode it starts at the latest confirmed pivot high or low instead, a pivot being a high or low with 35 bars on each side that do not exceed it, and never reaches further back than the lookback limit. A Dynamic profile therefore describes the move since the last swing.
The rows. The window's range, from its highest high to its lowest low, is split into 64 rows. Each bar's volume is spread evenly over the price range the bar covered, so a long bar spreads its volume thinly and a small bar concentrates it. A bar that closed up counts as up volume, one that closed down as down volume, an unchanged bar half and half. That estimated split is what colours each row. With "Use Lower Timeframe" on, the same is done with the lower-timeframe candles inside each bar, which places the volume more precisely.
The POC and the value area. The POC is the row with the most volume. The value area starts at the POC row and grows one row at a time towards the neighbour with more volume, until it holds 70 percent of the total.
When it is rebuilt. On every 5th closed bar, and in Dynamic mode also when a new pivot confirms. Profiles and levels are calculated over the last 2,000 bars of the chart ("Calculation History"); bars before them only feed the first window.
6. From the Profile to Key Levels
Each rebuild proposes levels from the new profile:
- the VAH and the VAL, drawn as lines (on by default);
- volume peaks: rows with more volume than every row within "Peak Detection (%)" of the profile on each side, at most 2, drawn as zones of 3 rows by default;
- ranked rows: the highest-volume row (1 by default), a line, even when it is not a local peak;
- optionally the POC, volume troughs and the lowest-volume rows.
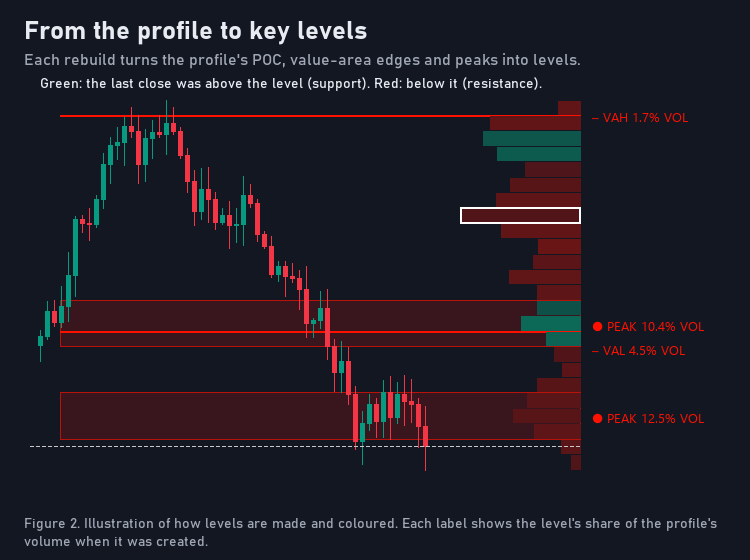
Figure 2. Illustration of how levels are made and coloured. The percentage is the level's share of the profile's volume when it was created.
Three rules keep the chart readable and the levels honest:
- A level keeps its place. When a new profile finds a node within a fraction of a row of an active node of the same kind, the existing level is kept exactly as it was first drawn. Levels do not drift with every rebuild.
- No overlaps. With "Avoid Overlap" on, a new node that would overlap an active node is skipped.
- Levels end. A level stops when a bar closes through it ("Stop Extending On Break", on by default) or after 500 bars. A stopped level disappears, or stays in grey with "Historical Nodes" on.
The colour carries the side. A level is drawn in the bullish colour while the last close outside it was above it, so it sits under price as potential support, and in the bearish colour while that close was below it. A level created with the close inside it stays grey until a bar closes outside it.
Of all active levels, the nearest peak, the nearest trough and the nearest ranked row are always drawn, then the others by distance to price, up to 8 at a time. Every active level is still tracked and can signal.
7. The Three Signals
On every closed bar, every active level created before that bar is checked. A level is touched when the bar's range reaches into it.
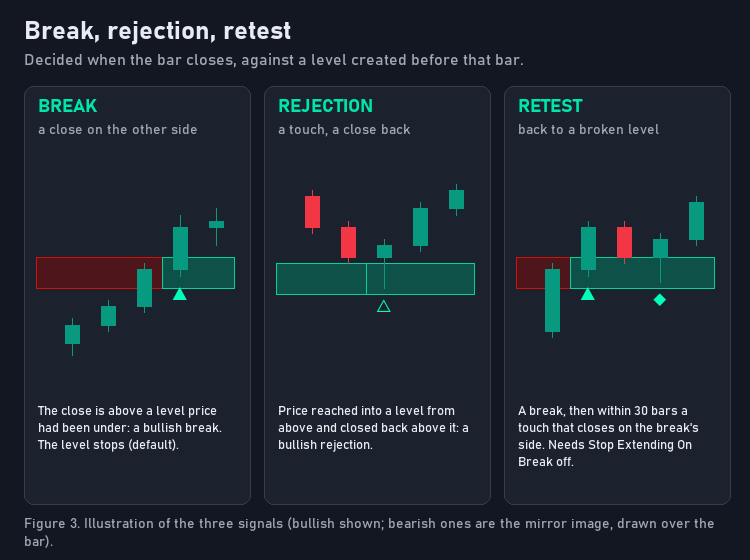
Figure 3. Illustration of the three signals; bearish ones are the mirror image, drawn over the bar.
- Break (filled triangle). The bar closes on the other side of the level from where it last closed. A bullish break is a close above a level price was under; a bearish break the opposite. With the default settings the level stops there.
- Rejection (hollow triangle). Price touched the level coming from one side, and a bar closed back on that same side without breaking it. A bullish rejection is a level holding as support; a bearish rejection a level holding as resistance.
- Retest (diamond). Within 30 bars of a break, price touches the level again and closes on the break's side. A retest needs a broken level to stay active, so it appears only when "Stop Extending On Break" is switched off.
Three filters decide which signals count:
- Which levels. By default only volume nodes (peaks, troughs, ranked rows) give signals. "Signal Levels" set to All Levels adds the POC and the value area edges.
- Cooldown. The same level waits 3 bars after an accepted signal before it can give another one.
- Relative volume. "Minimum RVOL" can require the bar's volume to be at least a multiple of its 20-bar average. At 0, the default, the filter is off.
At most one bullish and one bearish marker are drawn per bar, a break before a retest before a rejection. Hover a marker to see every level that signalled on that bar, with its price, its share of the volume, its row strength, its up volume, how often it was touched and its age.
8. Labels, Hover Details and the Table
Each drawn level gets a label in one column beside the profile, nearest first: its symbol and name, then its share of the profile's volume (for example "PEAK 15% VOL"). The share is measured when the level is created and describes how much of the profile's business happened there. It is not a probability of anything. "Label Content" can show the row strength or the up volume instead, and "Label Prices" adds the price.
The table in the corner reads the chart for you:
| Row | What it says |
|---|---|
| Value area | Above value, Inside value or Below value: the close against the latest VAH and VAL |
| POC distance | the close's distance to the POC in ATR(14), plus above, minus below |
| Nearest above | the nearest drawn level above the close, its price and its distance in ATR |
| Nearest below | the same below |
| Relative volume | the current bar's volume against its average, as a multiple |
The Detailed variant adds the profile's window and age, its volume, its estimated up and down split, the number of active and stored levels and the last accepted signal.
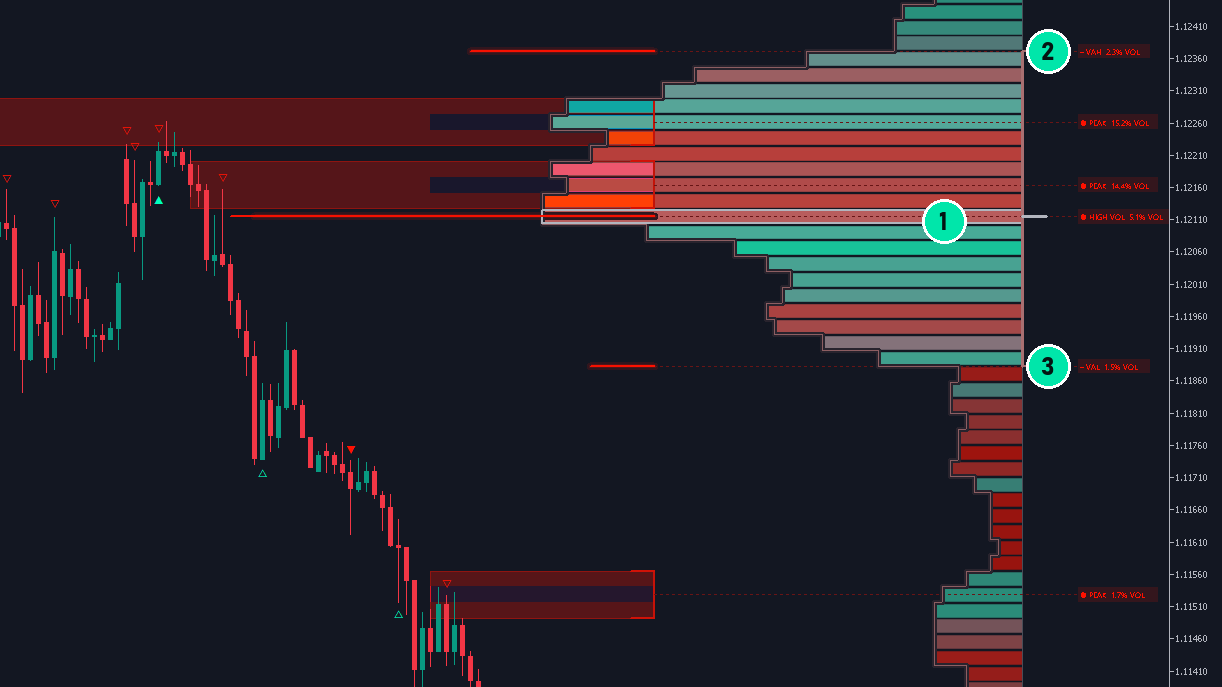
A real EURUSD H1 capture at default inputs, cut to the profile. 1: the point of control, the outlined row. 2: the value area high with its label. 3: the value area low. The latest profile has its POC at 1.12115, the value area from 1.11883 to 1.12371.
9. What Repaints and What Does Not
Every decision is made on a closed bar. A level, a marker or an alert never changes once made, and nothing is decided while a bar is forming.
Two things move by design, and it helps to know them:
- The newest profile is redrawn at every rebuild, because it always shows the latest window. The levels already created stay where they were created.
- A pivot is confirmed 35 bars after its own bar, so in Dynamic mode a window starts that many bars behind the pivot. That is a delay, not a repaint.
One more practical point: which bars fall on a rebuild (every 5th bar) and where the calculated history begins depend on how many bars the chart holds, so loading a chart with much more history can change the oldest levels. The levels near price are not affected.
10. The Settings That Change the Picture Most
- Stop Extending On Break. On (the default), a broken level stops and the chart shows breaks and rejections. Off, broken levels stay active, so price can come back to them and the diamond retest markers appear. If you trade retests, this is the switch.
- Lookback Mode and Lookback Limit. Fixed 240 bars gives a steady profile of the recent past. Dynamic follows the latest swing, so the levels describe the current move.
- Peak Max and Peak Variant. More peaks give more levels to trade and more signals to filter. Lines instead of zones give exact prices but fewer touches.
- Signal Levels. All Levels adds signals at the POC and the value area edges, which is useful when you trade rotations inside value.
- Minimum RVOL. A value such as 1.5 keeps only signals on bars with at least one and a half times the average volume.
- Profile Resolution. More rows give finer levels; fewer rows give broader zones.
11. The Ten-Second Read
Before any order, read the chart in this order:
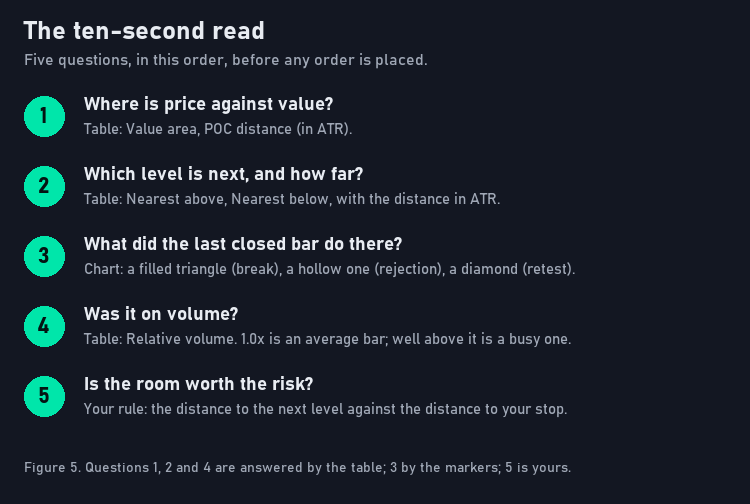
Figure 5. Five questions; the table answers three of them.
- Where is price against value? The first row of the table.
- Which level is next, and how far? Nearest above and below, with the distance in ATR.
- What did the last closed bar do there? A filled triangle, a hollow triangle, a diamond or nothing.
- Was it on volume? The relative volume row. Around 1.0x is an ordinary bar.
- Is the room worth the risk? The distance to the next level in your direction against the distance to your stop.
If the answer to question 5 is no, there is no trade, however clean the marker looks.
12. Three Ways to Trade the Levels
The markers tell you that something happened at a level. A trade plan needs three more things: where to enter, where you are wrong and where you take profit. Here are three plans built on the markers. They are rules for you to test, not results.
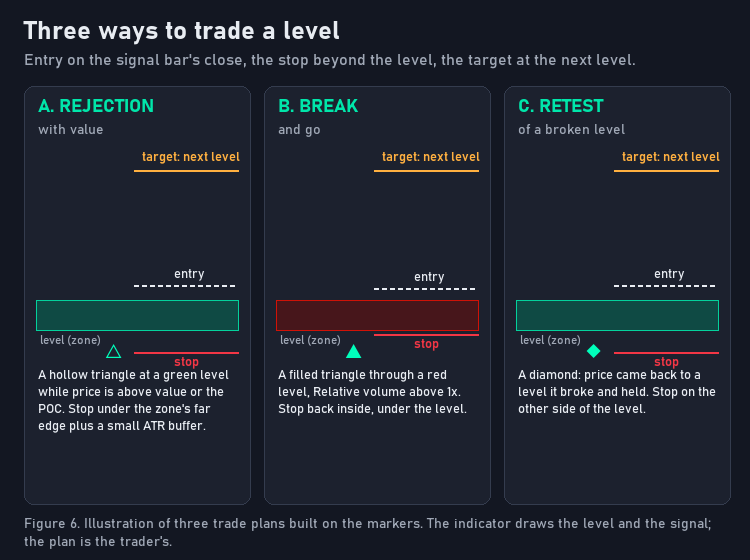
Figure 6. Illustration of the three plans. The indicator draws the level and the signal; the plan is the trader's.
A. The rejection with value
- Context: price above value (or above the POC) for longs, below value for shorts.
- Trigger: a bullish rejection (hollow triangle under the bar) at a green level under price; for shorts, a bearish rejection at a red level above price.
- Entry: at the close of the signal bar, or on the next bar's open.
- Stop: beyond the far edge of the zone, plus a small buffer (a quarter to a half of an ATR is a common choice). If price closes through the whole zone, the idea was wrong.
- Target: the nearest level in your direction, which the table lists with its distance in ATR. Take the trade only when that distance is clearly larger than the distance to your stop.
B. The break and go
- Context: price leaving value, or already outside it in the direction of the break.
- Trigger: a break (filled triangle) through a volume node, preferably with relative volume above 1.0x in the table.
- Entry: at the close of the breaking bar.
- Stop: back on the other side of the broken level. A break that closes back inside the level has failed.
- Target: the next level beyond the broken one. A break into an empty stretch with no level ahead (the table says None) has no defined target; trail the stop instead.
C. The retest of a broken level
Switch "Stop Extending On Break" off for this plan, so that broken levels stay on the chart.
- Trigger: a diamond: within 30 bars of a break, price came back to the level and closed on the break's side.
- Entry: at the close of the retest bar.
- Stop: on the other side of the level. The old resistance should now hold as support, and the other way round.
- Target: the next level in the break's direction.
Risk on every plan
Size each position from the distance between the entry and the stop, so that a stopped trade costs the same small share of the account whatever the market. Many traders risk one percent or less per trade. Test any plan on a demo account first, on the markets and timeframes you trade.
13. A Practical Workflow
- Open the chart and read the table. Above, inside or below value; how far from the POC.
- Look at the labels. The levels nearest price, their volume shares, and the gap to the next one.
- Wait for a closed bar. The marker appears when the bar closes, never before.
- Match the marker to a plan. Rejection with value, break and go, or retest. A marker that fits none of them is information, not a trade.
- Check the room. Distance to target against distance to stop.
- Place and manage the order yourself. Move nothing because the next profile looks different; the level you traded keeps its place.
Alerts let you do steps 1 and 2 once and then leave the chart: the indicator tells you when a level breaks or holds on a closed bar.
14. Four Mistakes That Cost the Most
- Trading every marker. A chart with several active levels prints markers often, and most of them are information. Trade the ones that fit a plan and the context.
- Ignoring value. A rejection against the side in control is a counter-trend trade. It can work, but it needs a closer target and a tighter plan.
- Reading the volume share as a win rate. "15% VOL" says how much of the profile's volume sits at that level. It says nothing about how often price will turn there.
- Entering before the close. A wick into a level is not a rejection until the bar closes back. The indicator waits for the close; so should the order.
15. Real Chart Examples
Every chart below is a real capture of the shipped indicator at its default inputs on a broker demo feed. The numbers in each paragraph are read from the same capture.
Breaks and rejections on EURUSD H1, MetaTrader 5

Cut from a real capture at default inputs. The numbered badges mark the newest bullish and bearish break and the newest bullish and bearish rejection in this part of the chart; hover a marker on your own chart to see the level behind it.
EURUSD H1, MetaTrader 5
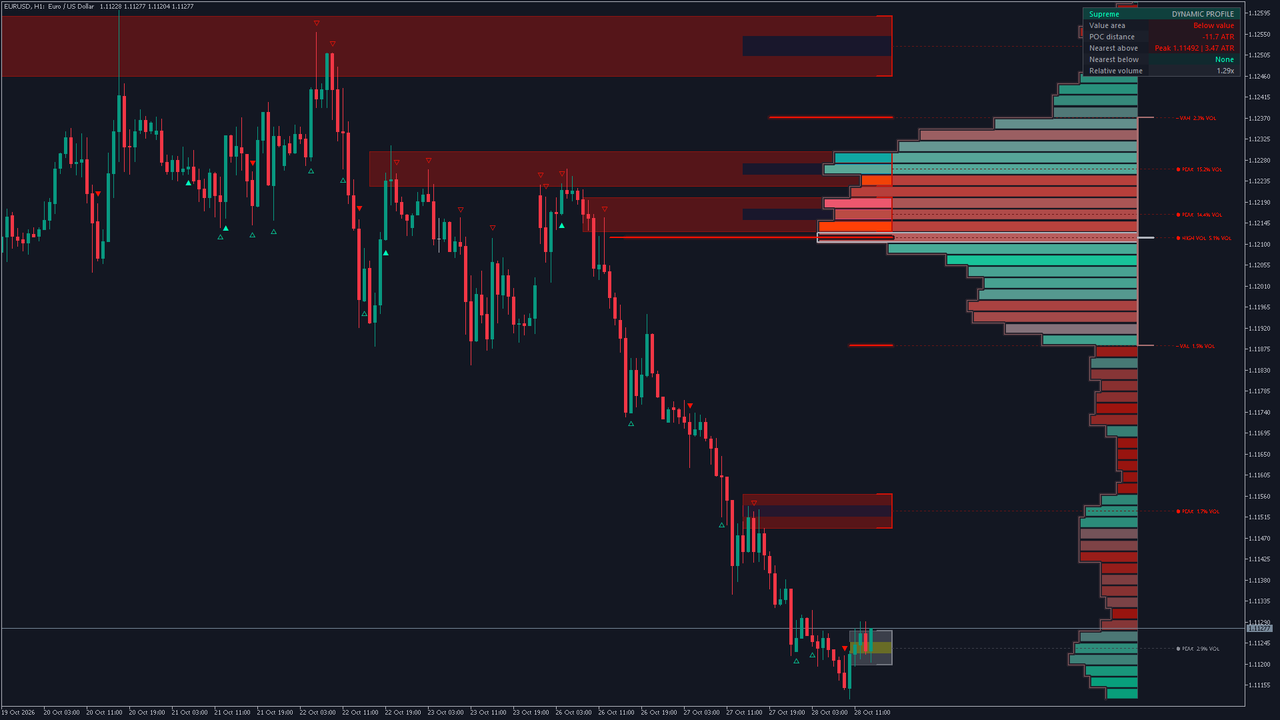
The latest profile has its POC at 1.12115, the value area from 1.11883 to 1.12371. The table reads Below value, the POC -11.7 ATR away, the nearest level above Peak 1.11492 | 3.47 ATR, the nearest below None, and relative volume 1.29x. The newest marker is a bearish break on the 2026.10.28 09:00 bar, at the Peak level 1.11211. Price trades below value, so sellers have control: the first plan to watch is a bearish rejection (plan A) at a red level above. No level is drawn below the close, so a bearish break from here has no level to aim at (plan B would trail its stop).
Gold (XAUUSD) H1, MetaTrader 5
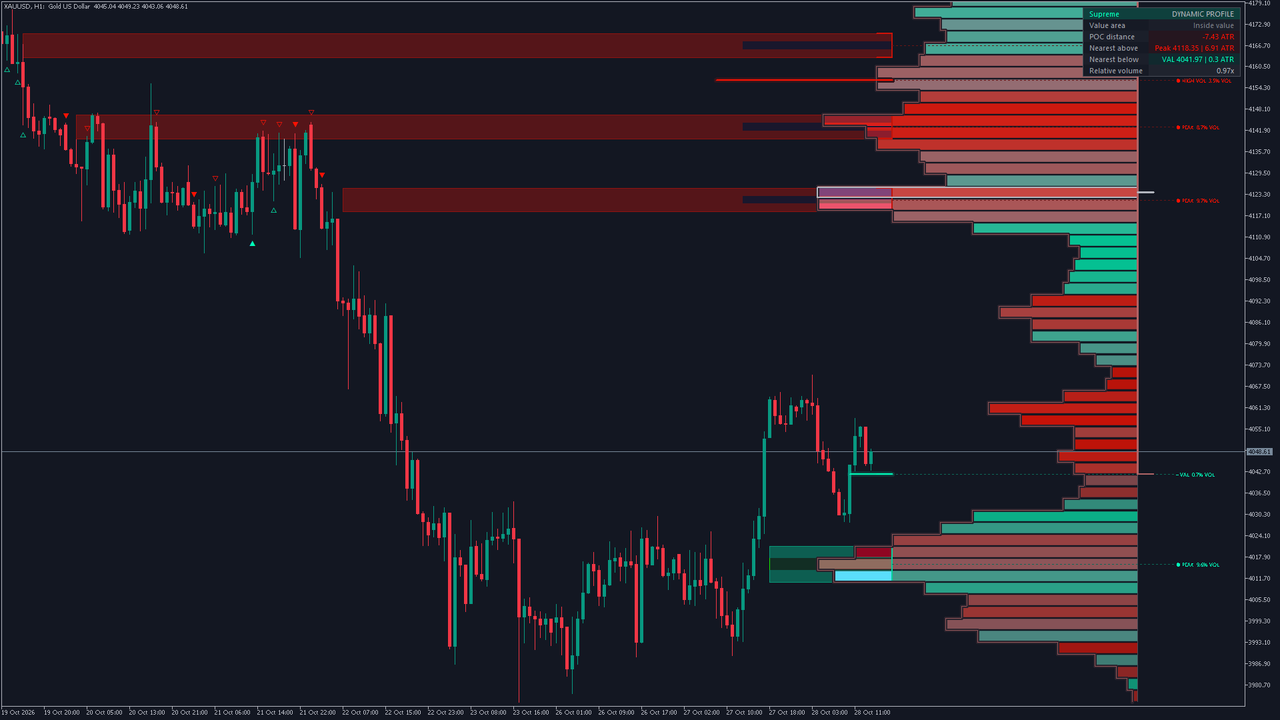
The latest profile has its POC at 4123.91, the value area from 4041.97 to 4191.90. The table reads Inside value, the POC -7.43 ATR away, the nearest level above Peak 4118.35 | 6.91 ATR, the nearest below VAL 4041.97 | 0.3 ATR, and relative volume 0.97x. The newest marker is a bearish break on the 2026.10.22 03:00 bar, at the Peak level 4121.72. Price trades inside value, where it tends to rotate: rejections at the edges and at the levels between them are the setups to watch, with the room to the next level (6.91 ATR above, 0.3 ATR below) against the stop.
Gold (XAUUSD) H4, MetaTrader 5
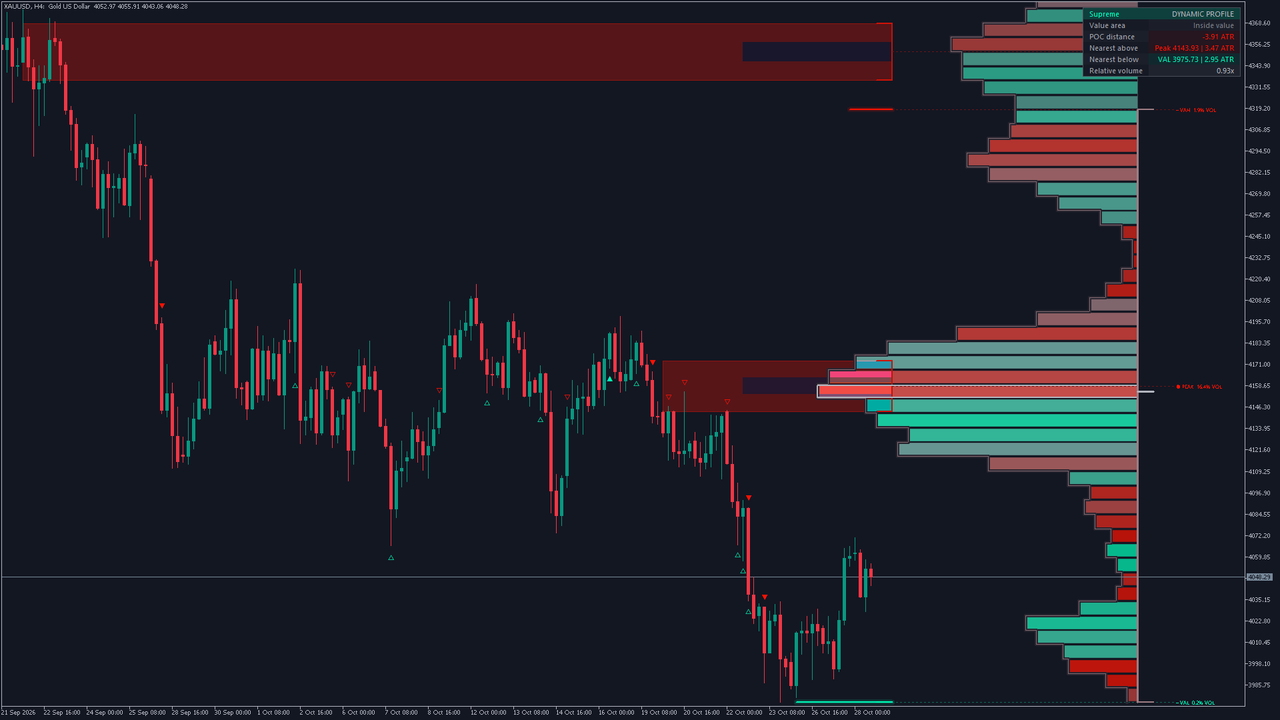
The latest profile has its POC at 4155.47, the value area from 3975.73 to 4318.50. The table reads Inside value, the POC -3.91 ATR away, the nearest level above Peak 4143.93 | 3.47 ATR, the nearest below VAL 3975.73 | 2.95 ATR, and relative volume 0.93x. The newest marker is a bearish break on the 2026.10.23 04:00 bar, at the Peak level 4019.69. Price trades inside value, where it tends to rotate: rejections at the edges and at the levels between them are the setups to watch, with the room to the next level (3.47 ATR above, 2.95 ATR below) against the stop. On H4 each row of the profile covers a wider band, so the zones are wider and the stops beyond them further away.
EURUSD M15, MetaTrader 5
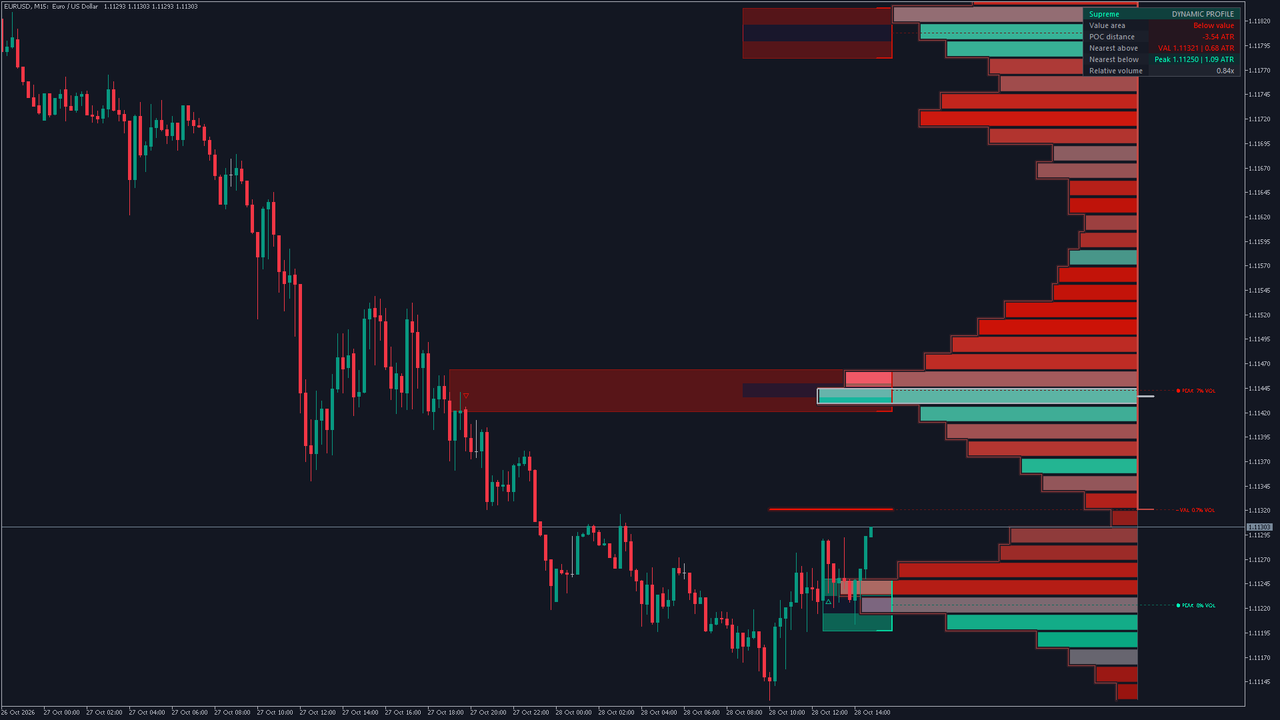
The latest profile has its POC at 1.11437, the value area from 1.11321 to 1.12120. The table reads Below value, the POC -3.54 ATR away, the nearest level above VAL 1.11321 | 0.68 ATR, the nearest below Peak 1.11250 | 1.09 ATR, and relative volume 0.84x. The newest marker is a bullish rejection on the 2026.10.28 12:45 bar, at the Peak level 1.11224. Price trades below value, so sellers have control: the first plan to watch is a bearish rejection (plan A) at a red level above. A bearish break would aim at the level below, 1.09 ATR away. On M15 the profile describes the last 240 quarter hours, 60 hours of trading.
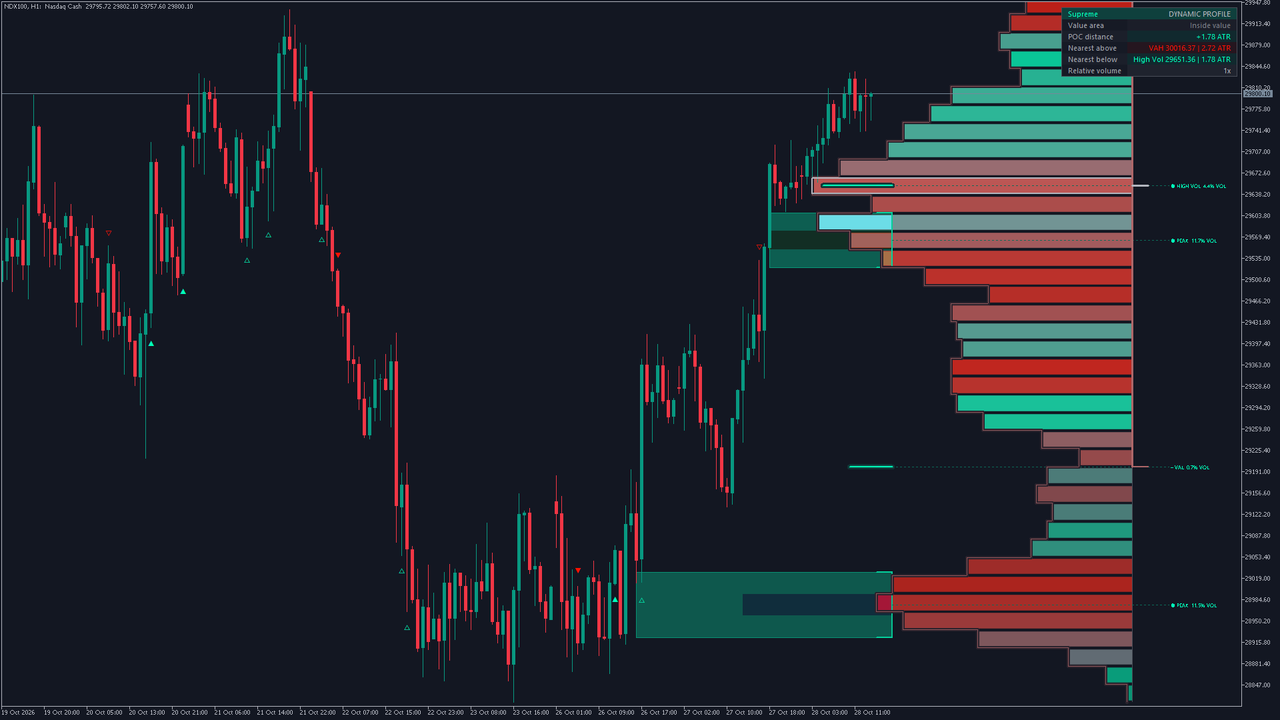
Nasdaq 100 H1, MetaTrader 5
The latest profile has its POC at 29651.36, the value area from 29198.75 to 30016.37. The table reads Inside value, the POC +1.78 ATR away, the nearest level above VAH 30016.37 | 2.72 ATR, the nearest below High Vol 29651.36 | 1.78 ATR, and relative volume 1x. The newest marker is a bearish rejection on the 2026.10.27 16:00 bar, at the Peak level 29564.53. Price trades inside value, where it tends to rotate: rejections at the edges and at the levels between them are the setups to watch, with the room to the next level (2.72 ATR above, 1.78 ATR below) against the stop. Index charts carry real activity in their tick volume, and the peaks of their profiles are often clear.
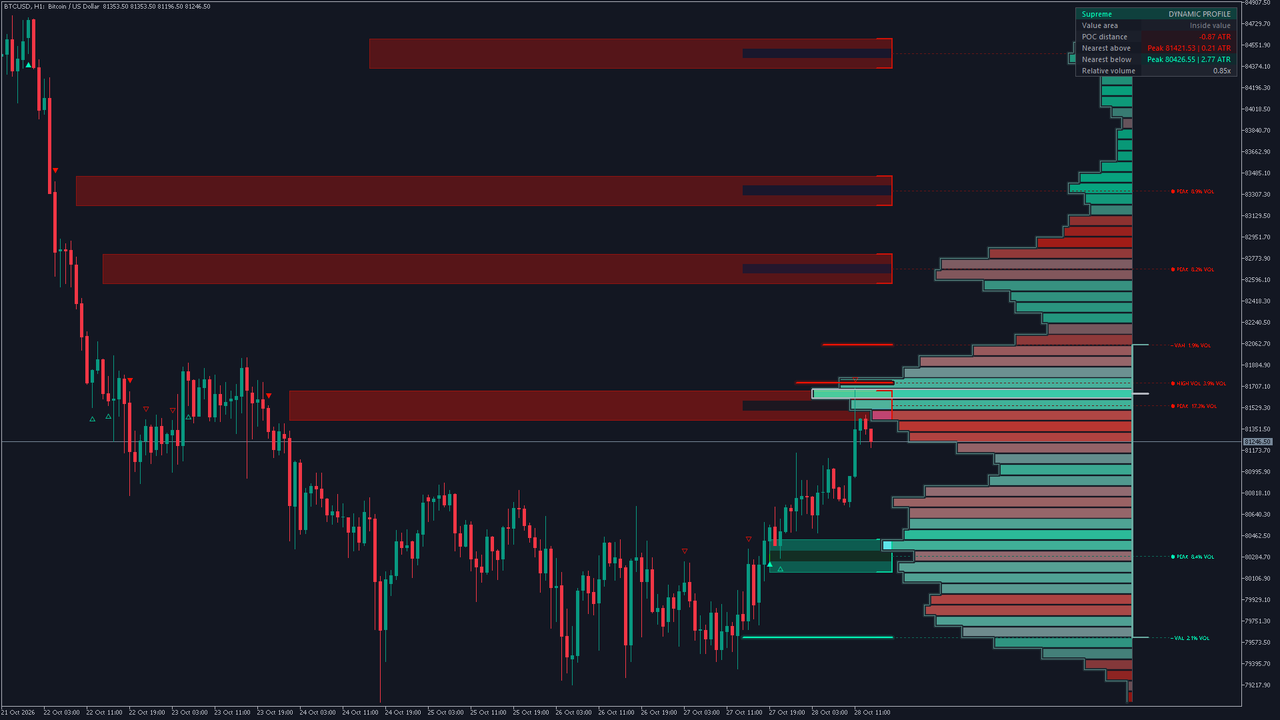
Bitcoin H1, MetaTrader 5
The latest profile has its POC at 81644.29, the value area from 79614.72 to 82050.20. The table reads Inside value, the POC -0.87 ATR away, the nearest level above Peak 81421.53 | 0.21 ATR, the nearest below Peak 80426.55 | 2.77 ATR, and relative volume 0.85x. The newest marker is a bearish rejection on the 2026.10.28 11:00 bar, at the Peak level 81543.85. Price trades inside value, where it tends to rotate: rejections at the edges and at the levels between them are the setups to watch, with the room to the next level (0.21 ATR above, 2.77 ATR below) against the stop. Bitcoin trades through the weekend, so its windows are continuous.
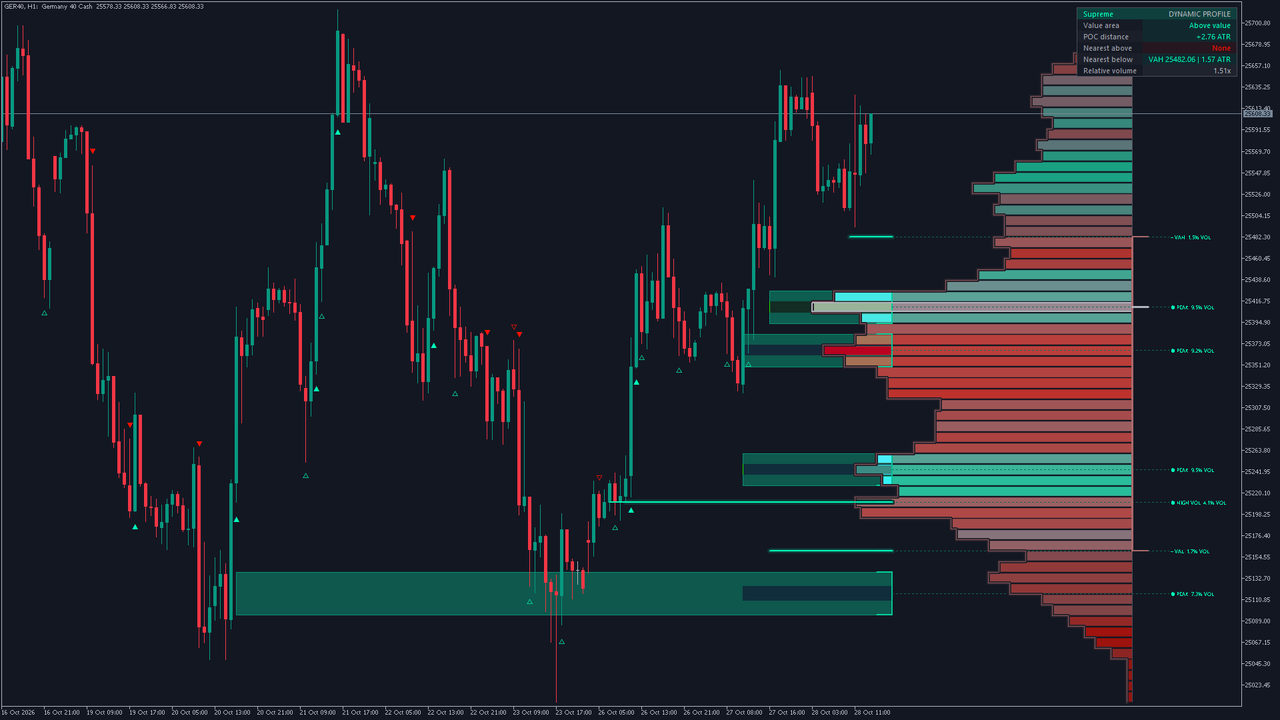
DAX 40 H1, MetaTrader 5
The latest profile has its POC at 25410.05, the value area from 25160.81 to 25482.06. The table reads Above value, the POC +2.76 ATR away, the nearest level above None, the nearest below VAH 25482.06 | 1.57 ATR, and relative volume 1.51x. The newest marker is a bullish rejection on the 2026.10.27 12:00 bar, at the Peak level 25365.74. Price trades above value, so buyers have control: the first plan to watch is a bullish rejection (plan A) at a green level below. No level is drawn above the close, so a bullish break from here has no level to aim at (plan B would trail its stop).
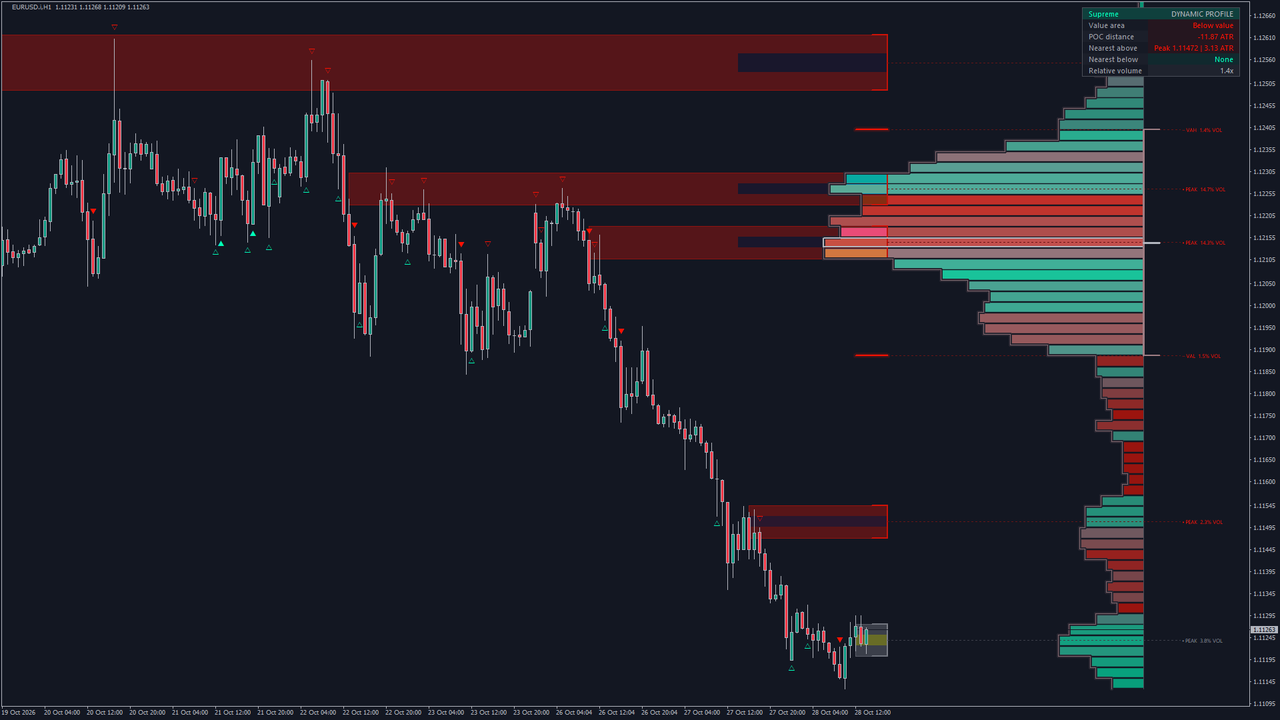
EURUSD H1, MetaTrader 4
The latest profile has its POC at 1.12144, the value area from 1.11887 to 1.12401. The table reads Below value, the POC -11.87 ATR away, the nearest level above Peak 1.11472 | 3.13 ATR, the nearest below None, and relative volume 1.4x. The newest marker is a bearish break on the 2026.10.28 09:00 bar, at the Peak level 1.11216. Price trades below value, so sellers have control: the first plan to watch is a bearish rejection (plan A) at a red level above. No level is drawn below the close, so a bearish break from here has no level to aim at (plan B would trail its stop). The MetaTrader 4 version on a different broker's feed: the same rules, its own volume.
16. Alerts
Nine conditions, each with its own switch: a new key level, a bullish and a bearish break, rejection and retest, and any bullish or any bearish signal. The six individual signal alerts are on by default; the new-level alert and the two "any" alerts are off. Every alert is evaluated on a closed bar, fires once for that bar, and never fires for history or in the Strategy Tester.
Channels: a pop-up window (on), a sound, a push notification to your phone and an e-mail. Push and e-mail use the terminal's own settings in Tools > Options.
An alert names the level the signal fired on, the symbol, the timeframe and the close. The titles are:
Bullish Key Level Break Bearish Key Level Break Bullish Key Level Rejection Bearish Key Level Rejection Bullish Key Level Retest Bearish Key Level Retest
An example from the EURUSD H1 capture: Bearish Key Level Break (Peak 1.11211) on EURUSD H1 @ 1.11150 .
The signal filters (Signal Levels, Signal Cooldown, Minimum RVOL) apply to alerts too. The marker switches do not: hiding the markers keeps the alerts.
17. Installation from the MQL5 Market
- Open the product page for your platform (the links are in sections 1, 4 and 19) and click Buy or Free Demo.
- The terminal installs the indicator automatically; it appears in the Navigator under Indicators > Market.
- Drag it onto a chart, check the inputs and click OK.
- For alerts on your phone or by e-mail, set up Tools > Options > Notifications or Email first.
The indicator needs the chart's history: the first calculation on a long chart takes a moment. It reads tick volume, which every MetaTrader symbol has.
18. Parameter Reference
92 inputs in 13 groups. The calculation's own settings come first in their groups, then the MetaTrader settings and the alerts.
Components
| Input | Default | What it does |
|---|---|---|
| Volume Profile | Yes | Draws the latest profile: one horizontal row per price band (and, with Visual Accents, its outline and the VAH, VAL and POC ticks). Off hides the histogram only; the levels and signals are computed the same way, and the level labels move next to the last bar. |
| Point of Control | No | Creates a level at the profile's point of control, the row with the most volume (white, the chart's foreground colour). Off by default. Turning it off also removes POC signals. |
| Value Area Levels | Yes | Creates the value-area high (VAH) and low (VAL) levels: the edges of the band of rows around the POC that holds Value Area (%) of the profile's volume. |
| Background | No | Shades the latest profile: the value area, the whole profile range, or both (Background Variant). Off by default. |
| Volume Peaks | Yes | Creates levels at local volume peaks: rows that hold more volume than their neighbours. Drawn as zones by default (Peak Variant). |
| Volume Troughs | No | Creates levels at local volume troughs: rows that hold less volume than their neighbours, where price tends to move quickly. Off by default. |
| Ranked Volume Rows | Yes | Adds the highest-volume (and, if set, lowest-volume) rows of the profile as levels, even when they are not local peaks or troughs. |
| Historical Nodes | No | Keeps the drawings of peak, trough and ranked levels after they stop (broken or expired), in the history colour. Off by default: a stopped node disappears. |
| Level Labels | Yes | Writes a label for each visible level in one column to the right of the profile: the level's name and, by default, its share of the profile's volume. Hover a label for its full details. |
| Metrics Table | Yes | Shows the metrics table: where price is against the value area, the distance to the POC in ATR, the nearest level above and below, and relative volume. |
| Visual Accents | Yes | Adds the outlines and highlights: the profile outline, a shaded core and edge brackets on zones, a glow on line levels. Off draws plain zones and lines. |
| Zone Center Lines | No | Draws a dotted line through the middle of each zone. Off by default. |
| Emphasize Nearby Levels | Yes | Draws the levels nearest the current price a little stronger and the far ones softer. Drawing only. |
| Label Prices | No | Adds the level's exact price to each label. Off by default. |
| Signal Markers | Yes | Draws the break, rejection and retest markers on the bars where they happen. Drawing only: off, the signals still happen and the alerts still send them. |
| Breaks | Yes | Markers for breaks: a close through a level (filled triangle. |
| Rejections | Yes | Markers for rejections: price reaches into a level and closes back away from it (hollow triangle. |
| Retests | Yes | Markers for retests: the first return to a level after a break, holding on the new side. A retest needs Stop Extending On Break off, or a broken level stops before it can be retested. |
Level Management
| Input | Default | What it does |
|---|---|---|
| Extend Previous Nodes | Yes | Keeps a peak, trough or ranked level active after a newer profile no longer contains it, until it breaks, expires or is removed from storage. Off: such a level stops at the next refresh. |
| Stop Extending On Break | Yes | Stops a level when a bar closes through it. Off: the level stays active after a break, so it can be retested. |
| Avoid Overlap | Yes | Refuses a new node that would overlap an active node or the POC. Value-area levels are exempt. |
| Level Expiry Bars | 500 | A level stops this many bars after it was created. Range 1 to 5000. |
| Maximum Stored Levels | 150 | Active and stopped levels kept in memory. When full, the oldest stopped level is removed first, or the oldest active one if all are active. Range 40 to 250. |
Calculation
| Input | Default | What it does |
|---|---|---|
| Lookback Mode | Fixed | "Fixed" builds the profile from the last Lookback Limit bars. "Dynamic" builds it from the latest confirmed pivot high or low, never more than Lookback Limit bars back, and rebuilds when a new pivot confirms. |
| Lookback Limit | 240 | How many bars the profile covers (Fixed), or at most covers (Dynamic). Range 30 to 1500. |
| Pivot Period | 35 | Bars on each side a pivot high or low needs; a pivot is confirmed this many bars after its own bar. Used by "Dynamic" lookback. Range 2 to 250. |
| Profile Resolution | 64 | How many rows the profile has. More rows give finer price bands. Range 20 to 100. |
| Refresh Every N Bars | 5 | The profile is rebuilt on every Nth closed bar (and on a new pivot in Dynamic mode). Signals are checked on every closed bar regardless. 1 rebuilds on every bar. Range 1 to 100. |
| Value Area (%) | 70 | The share of the profile's volume the value area holds, grown out from the POC row. Range 1 to 100. |
Key Level Variants
| Input | Default | What it does |
|---|---|---|
| POC Variant | Current | "Current" keeps the active POC level. "Historical" also keeps stopped POC levels. "Developing" draws the POC's path as a step line instead, with no POC level and no POC signals. |
| Value Area Variant | Current | The same three choices for VAH and VAL. "Developing" draws their paths as step lines instead of levels. |
| Peak Variant | Zones | "Zones" draws a peak as a band of rows (see Zone Radius); "Lines" as a single line at the row's centre. |
| Peak Max | 2 | At most this many peaks are taken from each profile. Range 1 to 8. |
| Trough Variant | Lines | "Lines" or "Zones" for troughs. |
| Trough Max | 1 | At most this many troughs are taken from each profile. The outermost rows are never troughs. Range 1 to 8. |
| Ranked Row Variant | Lines | "Lines" or "Zones" for ranked rows. |
| Highest Rows | 1 | How many of the highest-volume rows become levels. 0 takes none. Range 0 to 5. |
| Lowest Rows | 0 | How many of the lowest-volume rows become levels. 0 (the default) takes none. Range 0 to 5. |
| Zone Radius (Rows) | 1 | Rows taken on each side of a zone's centre row: 1 makes a three-row zone, 0 a one-row zone. Range 0 to 5. |
Profile Display
| Input | Default | What it does |
|---|---|---|
| Placement | Right | "Right" draws the profile to the right of the last bar; "Left" draws it over the bars it was built from, starting at the first one. |
| Color Variant | Directional | "Directional" colours each row by its estimated up and down volume. "Up / Down" splits each row into an up part and a down part. "Relative Volume" uses one colour whose strength follows the row's volume. A row's length is always its volume. |
| Width | 60 | The profile's width in bars. Range 5 to 200. |
| Offset | 20 | How many bars right of the last bar a right-placed profile starts. Range 0 to 250. |
| Background Variant | Value Area | What Background shades: "Value Area" (between VAH and VAL), "Profile Range" (the whole profile), or "Both". |
Signal Settings
| Input | Default | What it does |
|---|---|---|
| Marker Variant | Markers | "Markers" draws the symbols only; "Markers + Text" adds the word: BREAK, RETEST or REJECT. |
| Signal Levels | Nodes | "Nodes" signals on peaks, troughs and ranked rows. "All Levels" also signals on the POC and value-area levels when they are enabled. |
| Signal Cooldown | 3 | Bars that must pass between two accepted signals on the same level. Also applies to alerts. Range 0 to 100. |
| Retest Window | 30 | How many bars after a break its retest may come. Range 1 to 500. |
| Volume Average | 20 | Length of the volume average that relative volume (RVOL) is measured against. Range 1 to 200. |
| Minimum RVOL | 0 | A signal needs at least this relative volume: the bar's volume divided by the average before it. 0 (the default) turns the filter off. Also applies to alerts. Range 0 to 10. |
| Signal Label Limit | 80 | How many signal markers stay on the chart; the oldest goes first. At most one marker per direction per bar, a break before a retest before a rejection. Range 10 to 300. |
Appearance
| Input | Default | What it does |
|---|---|---|
| Accent Variant | Signature | "Signature" shades a zone's core, brackets its edges and adds a glow to line levels. "Volume Balance" replaces the core shading with a strip showing the up and down volume. |
| Contrast | Bright | How strong zones, borders, history and the profile are drawn: "Soft", "Balanced", "Bright", or "Custom" (the four Custom Transparency settings). |
| Visible Active Nodes | 8 | How many active node levels are drawn: the nearest one of each family first, then the rest by distance to price. Only the drawing is limited; hidden levels are still tracked, signal and alert. POC and value-area levels are always drawn. Range 3 to 100. |
| Level Extension | 5 | How many bars past the last bar active levels extend. Range 0 to 100. |
| Bullish Color | #00FFBB | Colour for levels below price, bullish signals and up volume. |
| Bearish Color | #FF1100 | Colour for levels above price, bearish signals and down volume. |
| Neutral Color | #787B86 | Colour for neutral levels and rows. The POC uses the chart's foreground colour. |
Label Settings
| Input | Default | What it does |
|---|---|---|
| Label Content | Volume Share | "Name" only, or the name with "Volume Share" (the level's share of the profile's volume), "Row Strength" (its row against the POC row) or "Up Volume" (the estimated up share). Measured when the level was created; not a win probability. |
| Label Text Size | Tiny | Label text size: "Tiny", "Small", "Normal" or "Large". |
| Label Max | 8 | At most this many level labels. A label too close in price to one already placed is skipped; the level itself stays. Range 1 to 18. |
Metrics Table
| Input | Default | What it does |
|---|---|---|
| Table Variant | Compact | "Compact" shows six rows; "Detailed" adds the profile's window and age, its volume, the sampling, the up/down estimate, the level counts and the last signal. |
| Table Text Size | Small | Table text size: "Tiny", "Small", "Normal" or "Large". |
| Position | Top Right | Where the table sits: "Top Left", "Top Center", "Top Right", "Middle Right", "Bottom Left", "Bottom Center" or "Bottom Right". |
Advanced Calculation
| Input | Default | What it does |
|---|---|---|
| Peak Detection (%) | 7 | Neighbouring rows a peak is compared with on each side, as a share of the profile's rows. Larger values pick broader peaks. Range 1 to 50. |
| Trough Detection (%) | 7 | The same for troughs. Range 1 to 50. |
| Minimum Node Volume (%) | 1 | A peak, trough or ranked row needs at least this share of the POC row's volume. Empty rows never qualify. Range 0 to 100. |
| Node Smoothing Radius | 1 | Smooths the row volumes before peaks and troughs are searched. 0 turns smoothing off. The drawn profile is never smoothed. Range 0 to 5. |
| Node Match Tolerance (Rows) | 0.75 | When a new profile finds a node within this many rows of an existing node of the same kind, the existing level is kept as it is. Range 0 to 5. |
| Calculation History | 2000 | Profiles, levels and signals are calculated over this many most recent bars. Bars before them only feed the profile window. Range 100 to 10000. |
| Use Lower Timeframe | No | Builds each bar's volume distribution from the candles of a lower MetaTrader timeframe inside it, instead of spreading the bar's volume evenly over its range. The indicator picks the smallest MetaTrader timeframe of about Bar Granularity candles per bar that divides the chart's timeframe. Off by default. |
| Bar Granularity | 5 | With Use Lower Timeframe on, about this many lower-timeframe candles per chart bar. Range 2 to 20. |
Custom Transparency
| Input | Default | What it does |
|---|---|---|
| Zone Fill | 72 | With Contrast "Custom": zone fill transparency, 0 (solid) to 100 (invisible). Range 0 to 100. |
| Border | 48 | With Contrast "Custom": zone border transparency. Range 0 to 100. |
| History | 78 | With Contrast "Custom": transparency of stopped levels kept by Historical Nodes or a Historical variant. Range 0 to 100. |
| Profile | 15 | With Contrast "Custom": the profile rows' base transparency; rows with less volume are drawn softer. Range 0 to 100. |
MetaTrader
| Input | Default | What it does |
|---|---|---|
| Bars to calculate (0 = all) | 5000 | How many of the chart's most recent bars are calculated; 0 calculates every bar. The default keeps a long chart quick to load. Profiles, levels and signals form inside the last Calculation History bars of this window. |
| Keep chart object limits (500 boxes, 500 lines, 500 labels) | Yes | On: the newest 500 boxes, 500 lines and 500 labels stay on the chart and older drawings are retired. Off: every drawing stays. |
| Pin profile inside chart | Yes | The profile and the label column sit 20 to about 90 bars right of the last bar. On: while the last bar is on screen they move left just enough to stay inside the chart, keeping their spacing, and may overlap the newest candles. Off: they stay at their designed position; use the chart shift or scroll right to see them. |
Alerts
| Input | Default | What it does |
|---|---|---|
| Alert: New Profile Key Level | No | Fires when a profile rebuild creates at least one new level. Off because a rebuild can create a level every few bars. |
| Alert: Bullish Key Level Break | Yes | Fires when a bar closes above a level price was under. |
| Alert: Bearish Key Level Break | Yes | Fires when a bar closes below a level price was over. |
| Alert: Bullish Key Level Rejection | Yes | Fires when a level holds as support: a touch from above, a close back above. |
| Alert: Bearish Key Level Rejection | Yes | Fires when a level holds as resistance: a touch from below, a close back below. |
| Alert: Bullish Key Level Retest | Yes | Fires when a broken level is retested from above. Needs Stop Extending On Break off. |
| Alert: Bearish Key Level Retest | Yes | Fires when a broken level is retested from below. Needs Stop Extending On Break off. |
| Alert: Any Bullish Key Level Signal | No | Fires on any of the three bullish signals. Use it instead of the three bullish switches, not as well, or each signal arrives twice. |
| Alert: Any Bearish Key Level Signal | No | Fires on any of the three bearish signals, the same way. |
| Channel: pop-up window | Yes | MetaTrader's alert window with the message and a sound. |
| Channel: sound | No | Plays alert.wav from the terminal's Sounds folder. |
| Channel: push notification | No | A push notification to the MetaTrader app on your phone. Needs your MetaQuotes ID in Tools > Options > Notifications. |
| Channel: e-mail | No | An e-mail with the alert title as the subject. Needs an e-mail account in Tools > Options > Email. |
19. Conclusion
A volume profile shows where the market did its business. Supreme Dynamic Profile turns that into levels you can trade against and marks, on the closed bar, what price did at each of them: a break, a rejection or a retest. The table reads value and the room to the next level for you. The plan, the stop and the size remain yours.
You can find it on the MQL5 Market:
MetaTrader 5: Supreme Dynamic Profile MT5
MetaTrader 4: Supreme Dynamic Profile MT4
Risk Disclaimer
Trading leveraged products carries a high level of risk and may not be suitable for all investors. Supreme Dynamic Profile is an analysis tool, not financial advice. The counts in this guide describe how often the indicator marked a signal, not how a trade would have ended. Test any approach on a demo account first.