Volume Profile Trading Strategy: How to Use POC, VAH & VAL with SuperScalp Pro

1. Introduction
In trading, understanding market direction is just as important as finding the right entry point.
Many traders focus heavily on technical indicators, moving averages, or Buy/Sell signals. However, understanding where the market has concentrated its trading activity can provide another valuable perspective when analyzing price movements.
One of the techniques I frequently use in my own trading is Volume Profile analysis, particularly three important levels:
-
POC (Point of Control)
-
VAH (Value Area High)
-
VAL (Value Area Low)
These levels help identify important price areas where trading activity has been concentrated. When combined with multi-timeframe analysis and SuperScalp Pro, they can help traders make more informed trading decisions.
In this article, I will explain how I use these levels to analyze the market, identify potential trading opportunities, and determine better entry and exit points.
2. Understanding POC, VAH, and VAL
Before applying this strategy, it is important to understand what each level represents.
POC – Point of Control
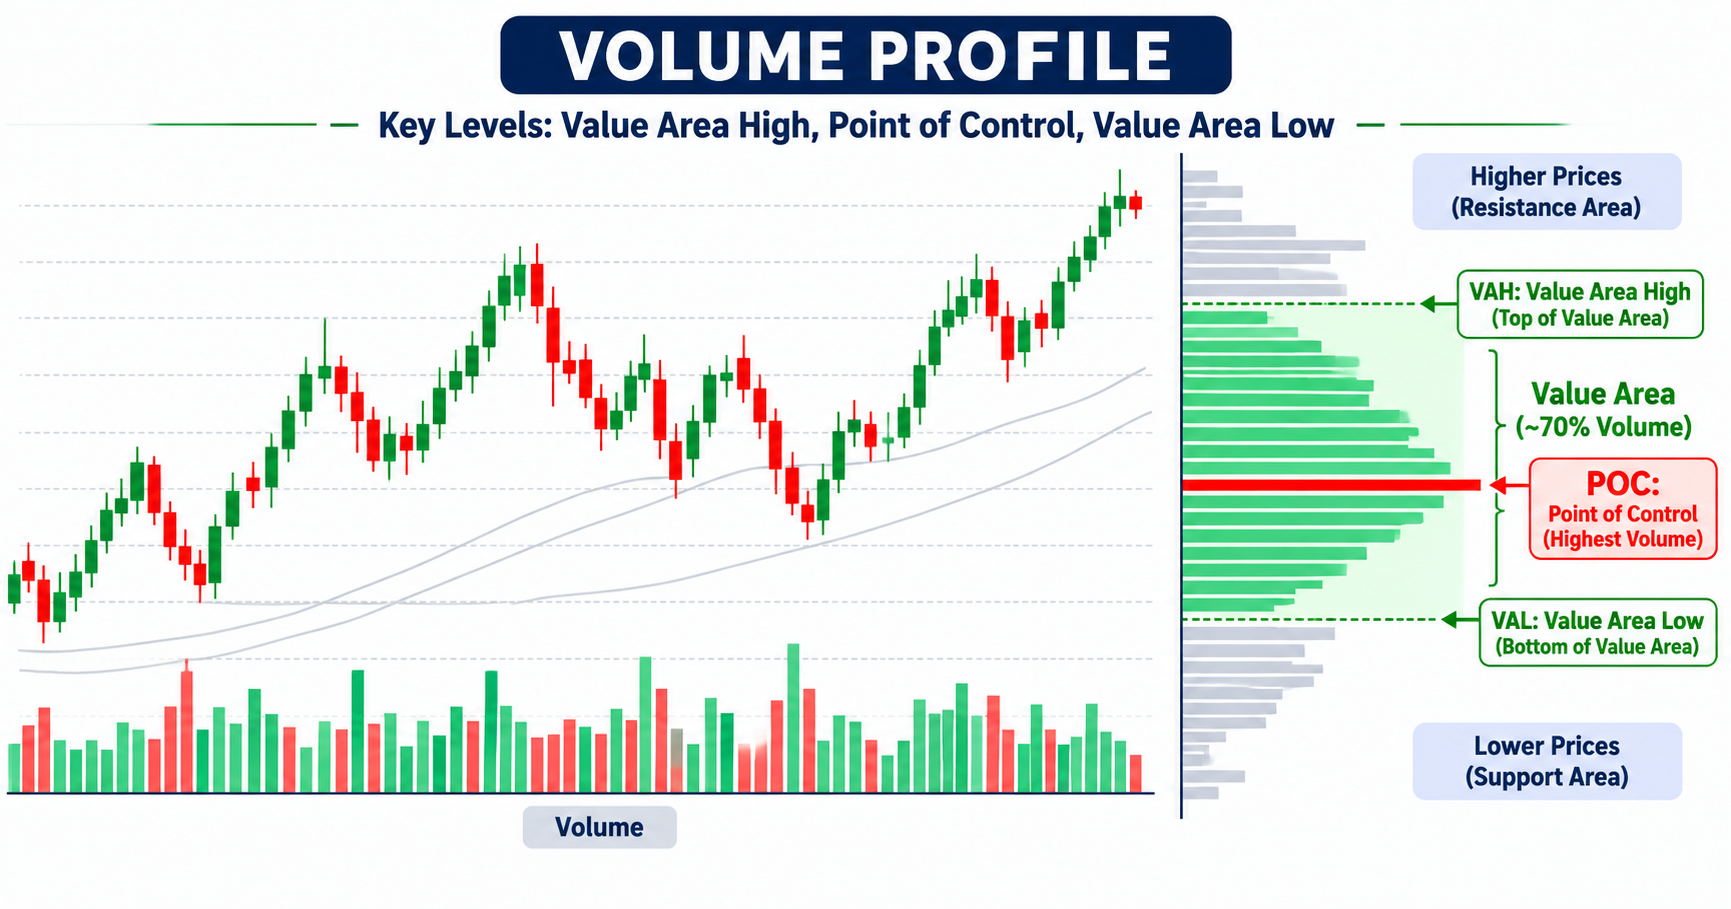
POC is the price level with the highest traded volume within the selected Volume Profile range.
It represents the price where the greatest amount of trading activity has occurred.
POC is particularly important because:
-
It can act as an important support or resistance reference.
-
Price may revisit this level when moving through the value area.
-
It can help traders identify areas of market acceptance.
-
A sustained move above or below POC may provide useful information about changing market conditions.
VAH – Value Area High
VAH represents the upper boundary of the Value Area, which typically contains approximately 70% of the trading volume within the selected profile range.
This level can help identify an important upper price boundary.
Potential trading scenarios:
-
If price approaches VAH and experiences selling pressure, a downward reaction may occur.
-
If price breaks above VAH and establishes acceptance at higher prices, this may indicate bullish continuation.
-
If price fails to remain above VAH, it may return toward POC or other lower price areas.
VAL – Value Area Low
VAL represents the lower boundary of the Value Area.
It is another important reference when analyzing potential support and resistance areas.
Potential trading scenarios:
-
If price approaches VAL and buyers step in, an upward reaction may occur.
-
If price holds above VAL and confirms bullish momentum, traders may consider potential Buy opportunities.
-
If price breaks below VAL and remains there, selling pressure may increase, creating potential Sell opportunities.
Important: POC, VAH, and VAL should not be treated as guaranteed reversal levels. They are reference areas that help traders understand market structure and evaluate possible scenarios.
3. Practical Example: XAUUSD H1
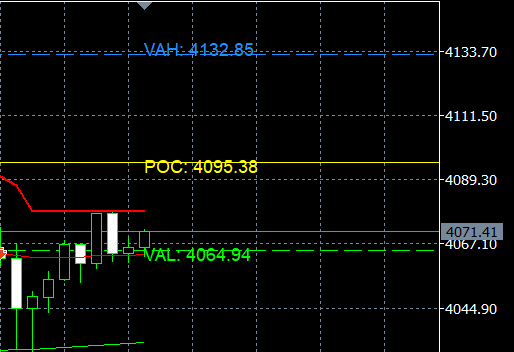
Real XAUUSD H1 chart showing VAH at 4132.85, POC at 4095.38, and VAL at 4064.94.
Let's look at my actual XAUUSD H1 chart to understand how these levels can be applied in practice.
In the example below, the Volume Profile identifies three important price levels:
-
VAH: 4132.85
-
POC: 4095.38
-
VAL: 4064.94
At the time of this chart, Gold was trading around 4071, which means price was below POC but still above VAL.
This positioning provides useful information about the current market structure.
Here is how I interpret these levels:
Scenario 1: Bullish reaction from VAL
If Gold maintains support around VAL (4064.94) and shows signs of buying pressure, traders can monitor potential Buy opportunities.
The first potential target could be POC (4095.38).
If price successfully breaks above POC and maintains bullish momentum, VAH (4132.85) may become another potential target.
Scenario 2: Bearish breakdown below VAL
If Gold breaks below VAL and establishes acceptance at lower prices, this may indicate increasing selling pressure.
In this situation, traders can monitor potential Sell opportunities rather than immediately attempting to buy against the downward movement.
Scenario 3: Recovery above POC
If price moves back above POC and successfully holds that level, it may indicate improving bullish conditions.
Traders can then monitor the possibility of a move toward VAH.
These scenarios provide a structured way to evaluate the market instead of entering trades based on individual indicator signals alone.
4. My Multi-Timeframe Trading Approach
One of the most important parts of my trading method is combining higher-timeframe analysis with lower-timeframe execution.
Personally, I do not rely on a single timeframe to make all my trading decisions.
My general approach is:
Higher Timeframes: H1 and H4
I use H1 and H4 to:
-
Identify the overall market direction.
-
Analyze potential bullish and bearish trends.
-
Identify important POC, VAH, and VAL levels.
-
Determine important price areas where I expect the market to react.
These higher-timeframe levels provide the broader market context.
Lower Timeframes: M15, M5, and M1
After identifying the important levels on higher timeframes, I move to lower timeframes to search for potential trading opportunities.
This is where I use SuperScalp Pro.
I combine its technical signals with the higher-timeframe Volume Profile analysis to evaluate potential entry points.
For example:
-
If H1/H4 analysis suggests bullish conditions, I pay more attention to Buy signals on M1–M15 near important support areas.
-
If higher-timeframe analysis suggests bearish conditions, I prioritize monitoring Sell signals near potential resistance areas.
-
I also use POC, VAH, and VAL as reference points when planning Take Profit and Stop Loss levels.
The main objective is to find entries with relatively small Stop Loss distances and greater Take Profit potential, aiming for a favorable Risk-to-Reward ratio.
5. Combining Volume Profile with SuperScalp Pro
SuperScalp Pro is a multi-layer technical analysis indicator designed to help identify potential trading opportunities through multiple technical filters and market conditions.
However, I believe that no indicator should be used in isolation. My preferred approach is to combine two different perspectives:
-
Higher-timeframe market analysis: Using Volume Profile on H1 or H4 to identify important market levels, including POC, VAH, and VAL.
-
Lower-timeframe trade execution: Using SuperScalp Pro on M1–M15 to identify potential Buy/Sell entries around these key levels.
How to Enable Volume Profile in SuperScalp Pro
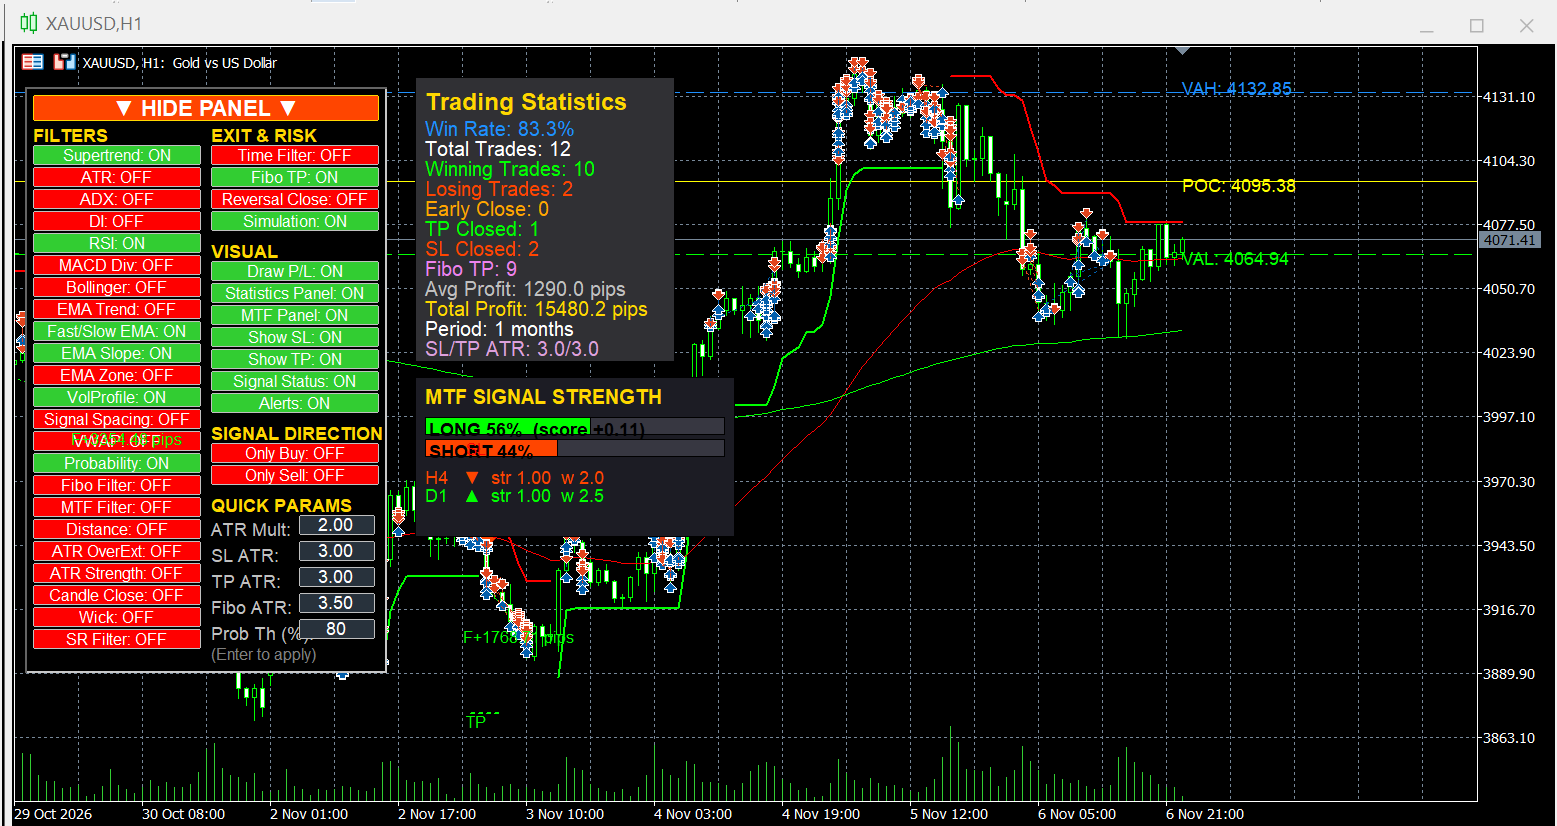
To enable Volume Profile, simply open the Control Panel and switch VolProfile from OFF to ON. The POC, VAH, and VAL levels will then be displayed directly on the chart.
Volume Profile provides market context:
-
Where is the market concentrating its trading activity?
-
Which price areas may act as support or resistance?
-
Is the market trading above or below important value levels?
-
Is the market accepting higher or lower prices?
SuperScalp Pro provides technical entry confirmation:
-
Is there a potential Buy or Sell signal?
-
Does the trend direction support the trade?
-
Are momentum and other technical filters aligned?
-
Is the potential entry suitable from a risk-management perspective?
By combining these two approaches, traders can avoid relying entirely on individual Buy/Sell signals and instead evaluate opportunities within a broader market structure.
6. Risk Management and Trade Selection
An important principle in my trading is that a high win rate is not everything.
What matters more is the relationship between average winning trades, average losing trades, and total trading costs.
For example, a trading system with a lower win rate can still be profitable if its average winning trade is sufficiently larger than its average losing trade.
When using Volume Profile, I recommend:
-
Avoid entering trades simply because price touches POC, VAH, or VAL.
-
Wait for price action or technical confirmation.
-
Consider the overall direction on H1 and H4.
-
Use lower timeframes to refine entry positions.
-
Set Stop Loss and Take Profit according to market structure and acceptable risk.
-
Always consider spread, commission, and slippage.
Remember that these levels are not perfect signals. Market conditions can change, and breakouts or false breakouts can occur.
7. Final Thoughts
For me, Volume Profile is one of the most useful tools for understanding market structure.
POC, VAH, and VAL provide important information about where trading activity has been concentrated and where the market may react.
When combined with multi-timeframe analysis and SuperScalp Pro, this approach offers another way to evaluate market conditions, identify potential trading opportunities, and improve entry selection.
My recommendation is to start by practicing Volume Profile analysis on H1 and H4, then gradually apply the identified levels to your M15, M5, or M1 trading decisions.
It may seem complicated at first, but with practice, you will gradually become more familiar with market structure and improve your ability to interpret price movements.
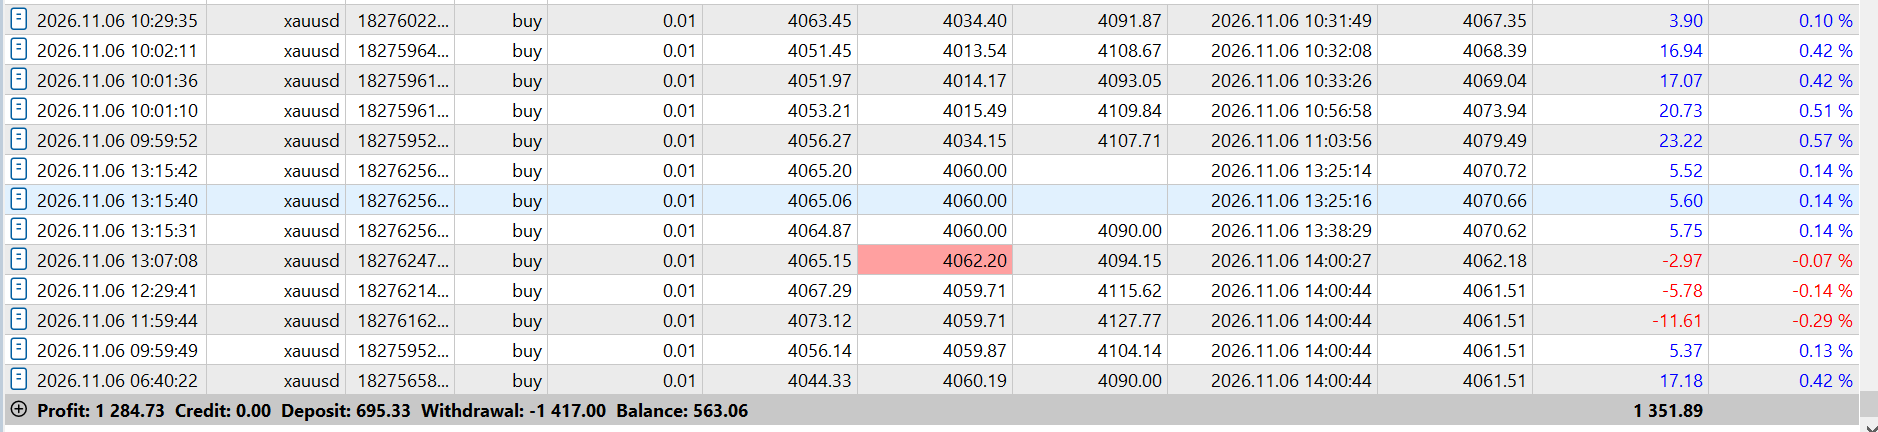
My Recent Trading Results:
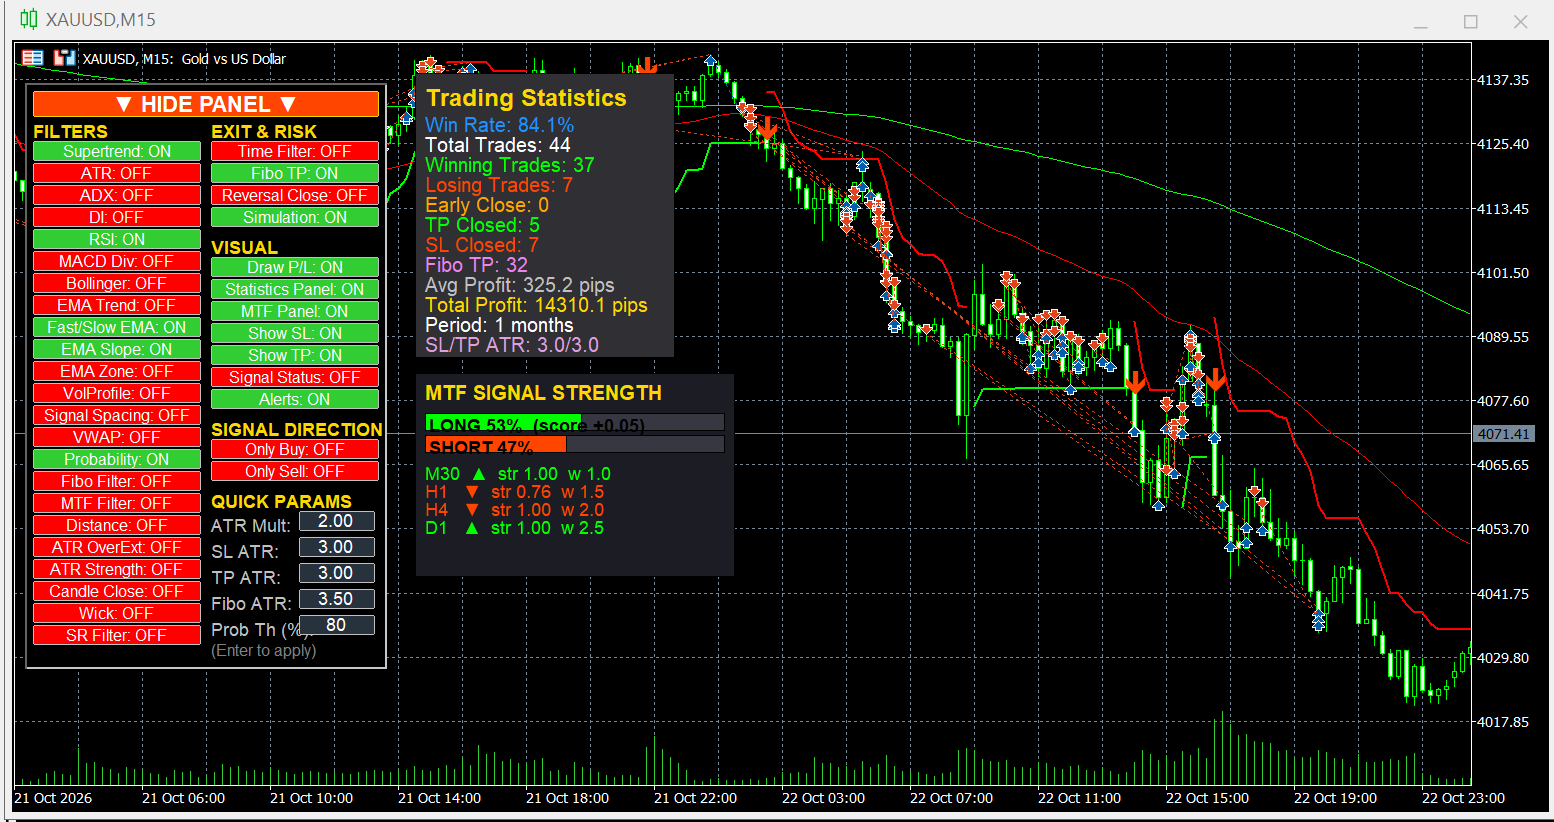
Below is an example of my recent XAUUSD trading results using this approach.
I hope this trading approach is helpful to the community. Happy trading, and always remember to manage your risk!