How to Use the AI Trading Journal and Review Trade Plans in MT4 and MT5 with Multi Risk Manager Pro

Your weekly report shows a net loss. Was it spread across most trades, or did two unusually large losses account for the result? Those explanations lead to different journal entries. The first calls for a closer look at the strategy’s trades as a group. The second gives you two specific positions to examine for sizing, stop placement and execution costs.
The AI tab in Multi Risk Manager Pro lets you ask that question using trading data from your MetaTrader account. You can also use it before entry to compare a trade drawn on the chart with your written rules. This guide walks through both workflows and shows where to check the assistant’s answer against the original figures.
Multi Risk Manager Pro for MT5 · Multi Risk Manager Pro for MT4 · MQLEXP public channel on MQL5
1. Connect the AI Provider in the Windows Companion
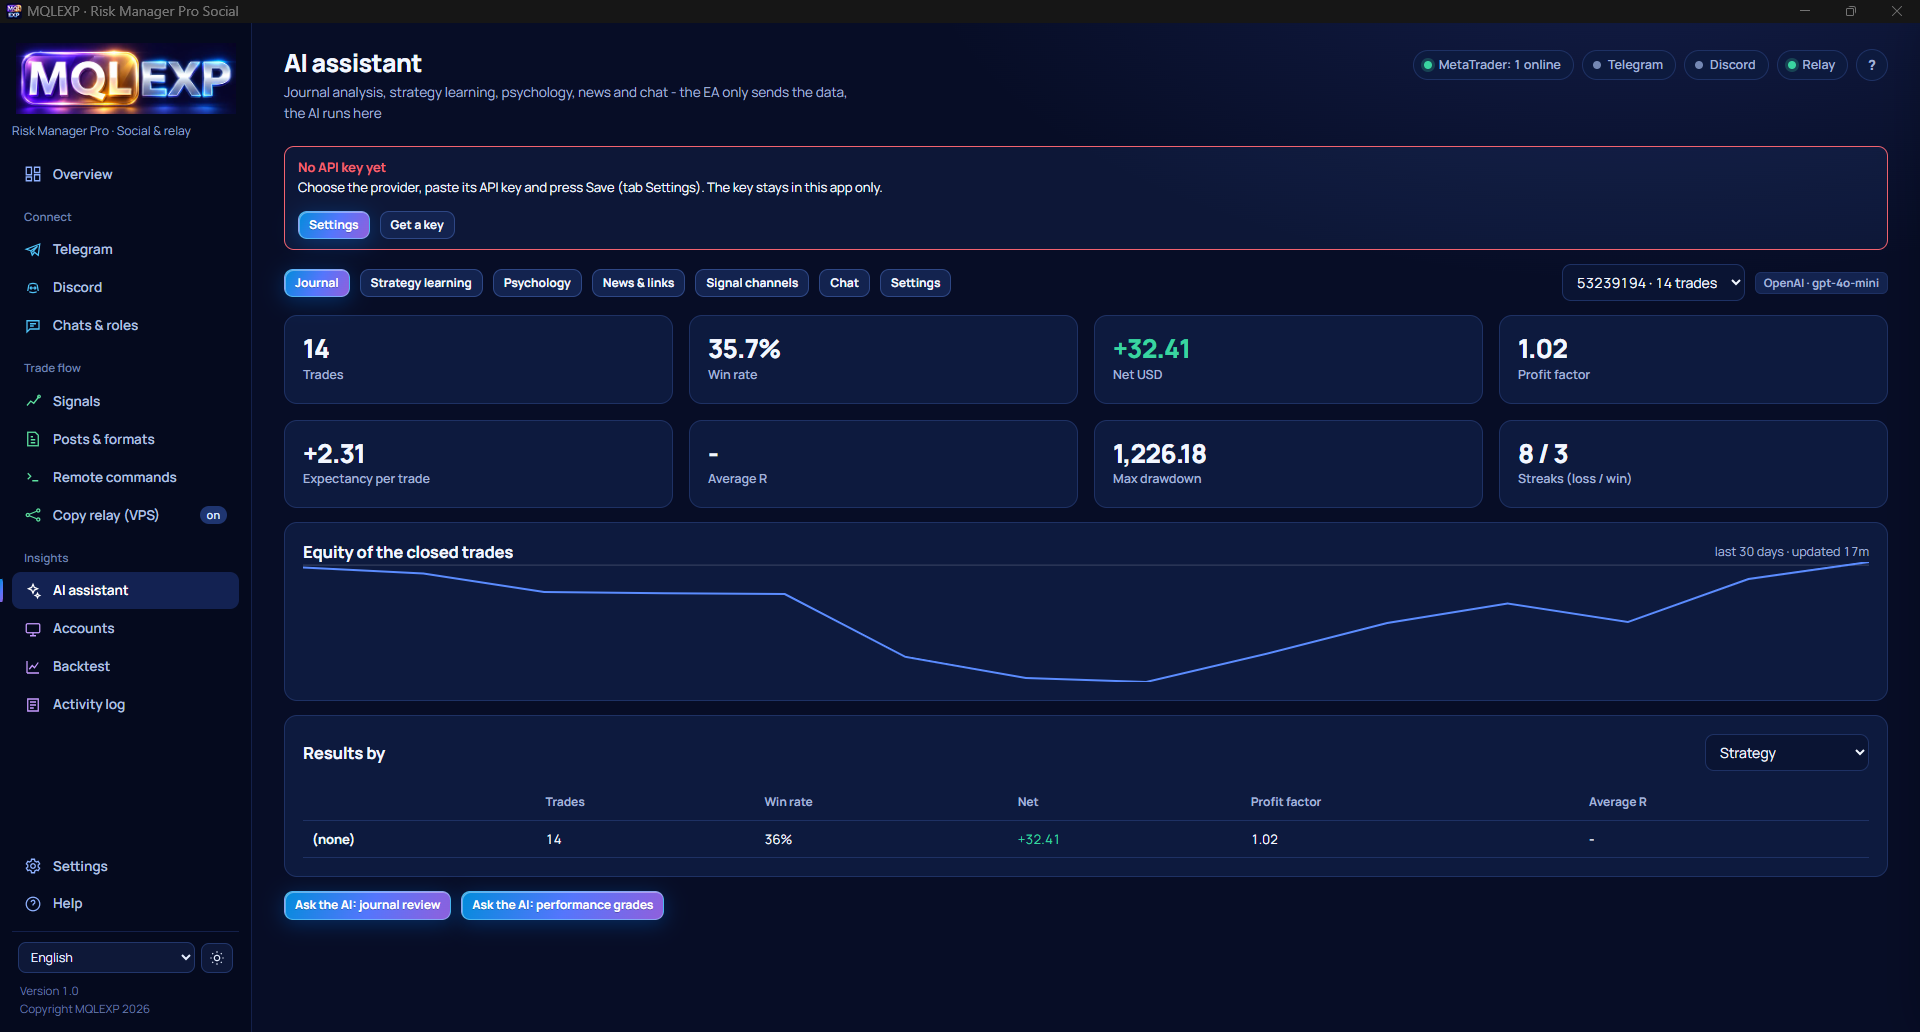
The AI tab is where you request and read a review inside MetaTrader. The Windows companion connects to the provider and model you choose. Start both on the same Windows computer or VPS, then follow these steps:
- In the companion, open AI assistant → Settings.
- Choose a provider. The available options include OpenAI, Anthropic, Gemini, OpenRouter and a custom OpenAI-compatible endpoint.
- Enter the API key, choose a model, click Save, then select Test the AI connection.
- Enter the trading rules you want the assistant to use. For example, if your own plan sets a maximum risk per trade, state the limit and whether you measure it against balance or equity.
- Return to AI → SETTINGS in MetaTrader. Choose the answer language and the number of history days to analyze. The status line identifies the active model or indicates what still needs configuring.
The companion stores your API key locally. When you request a review, the configured provider receives the prompt and the trading context used for that review. A CHART request also sends a chart image. Check any visible account labels or private chart notes before submitting one.
2. Choose the Review That Fits Your Question
| If you want to know… | Open | What to examine |
|---|---|---|
| Which trades shaped the last seven days? | WEEK REVIEW | The largest contributors to the weekly result |
| Has the same issue appeared across several weeks? | JOURNAL | Recurring observations across the selected history |
| Do two strategies behave differently? | STRATEGIES | Results grouped by the strategy labels in your records |
| Where is my current exposure concentrated? | OPEN RISK | Open positions, protective stops and shared currency exposure |
| Does my proposed entry follow my rules? | TRADE PLAN | The entry, stop, volume and risk drawn on the chart |
| What does the assistant see on this chart? | CHART | The visible price structure and annotations, using a model that accepts images |
WEEK REVIEW covers the last seven days. For a longer journal review, check Days of history to analyse before interpreting the response. A seven-day review and a 30-day journal can produce different observations simply because they cover different trades.
3. Example: Investigate a Losing Week
Start in HISTORY. Select the account and period you intend to review, then note the number of closed trades and the net result. Next, open AI → WEEK REVIEW. After reading the summary, enter a more specific question in the text box and press ASK:
Which two closed trades contributed most to this week’s net loss? Give the symbol, date and net result of each. Show the combined result of the remaining trades. Flag any missing cost or volume data.
Suppose a fictional demo week contains ten closed trades with a combined net result of −$120. The two largest losses are −$95 and −$65. Together they account for −$160, which means the other eight trades produced +$40. You now have a narrower question: What made those two losses larger?
Find both trades in HISTORY. Compare their volumes, symbols, commissions and swaps. If you saved the original trade plans, compare the planned risk with the realized loss. A larger loss in dollars can come from the contract traded or the distance to the stop, even when the lot sizes look similar. If the original stop was never recorded, leave that part of your journal entry open.
4. Example: Check a Trade Plan Before Entry
Use the R Box to draw a proposed entry, Stop Loss and Take Profit on the chart. Review the calculated volume, then open AI → TRADE PLAN. The review uses the plan as it stands when you make the request.
For example, suppose your written demo rule caps planned risk at 0.50% of equity and the panel currently shows 0.75%. Ask:
Compare the risk displayed in this plan with my 0.50% equity limit. State the difference in percentage points and identify the figures you used.
The difference is 0.25 percentage points. Check that the response used the same account, the current plan and equity as the reference. If you move the stop or change the volume afterward, check the recalculated risk in the panel and request a fresh review.
The assistant explains how the plan compares with your written rule. You control order submission in TRADE. To enforce an entry limit, configure the corresponding protection in the EA.
5. Review Open Risk or a Chart Image
Use OPEN RISK when your question concerns positions that are already open. For instance, ask: “Which open positions involve USD, and which of them have no recorded Stop Loss?” Compare the symbols, directions and stop prices in the answer with the positions in MetaTrader. For a position with no recorded stop, the assistant may lack the information needed to calculate a stop-based monetary loss.
Use CHART when the question depends on something visible, such as a marked range or the placement of an R Box. Choose a model that supports image input. A focused question such as “Which edge of my marked range is closest to the planned entry?” gives you an observation you can verify directly on the chart.
6. Save the Review You Can Use
Use COPY to copy an answer into your journal. A practical entry contains three items: the assistant’s observation, the trades or chart levels you checked, and one question to revisit. For the fictional week above, that might read:
The two largest losses totaled $160. I verified both trades in HISTORY. The remaining eight trades earned $40 net. For the next review, I will record planned risk at entry so I can compare it with the realized loss.
ASK AGAIN reruns the last request. SEND posts an answer to a configured Telegram or Discord destination, and +CHART can include the chart image. Review the destination and the account details visible in the response before sharing it.
If a request fails, check the AI status line, confirm the companion is running and use Test the AI connection. If text reviews work but CHART fails, check the selected model’s image support. If a review returns fewer trades than expected, compare its account and date range with HISTORY before drawing a conclusion.