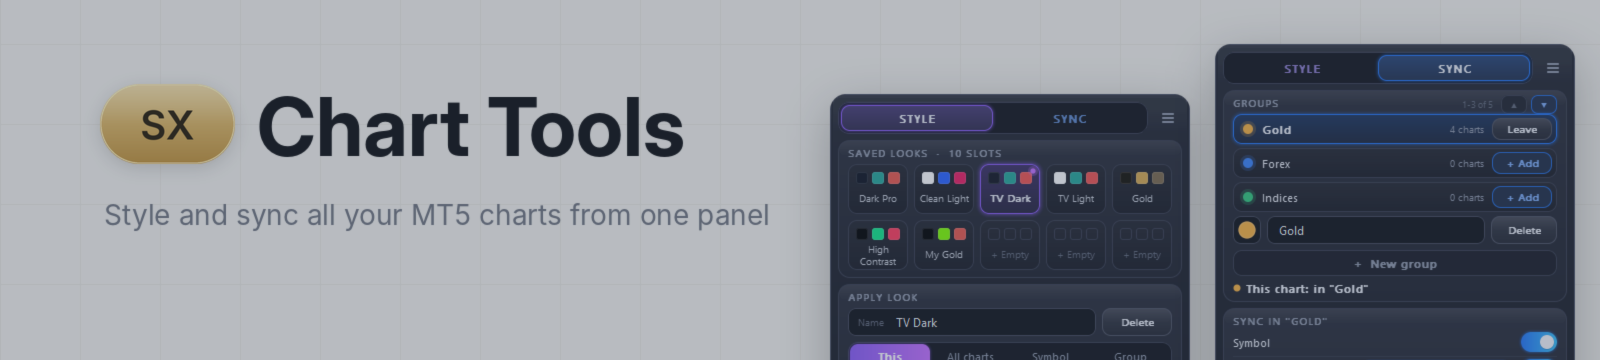

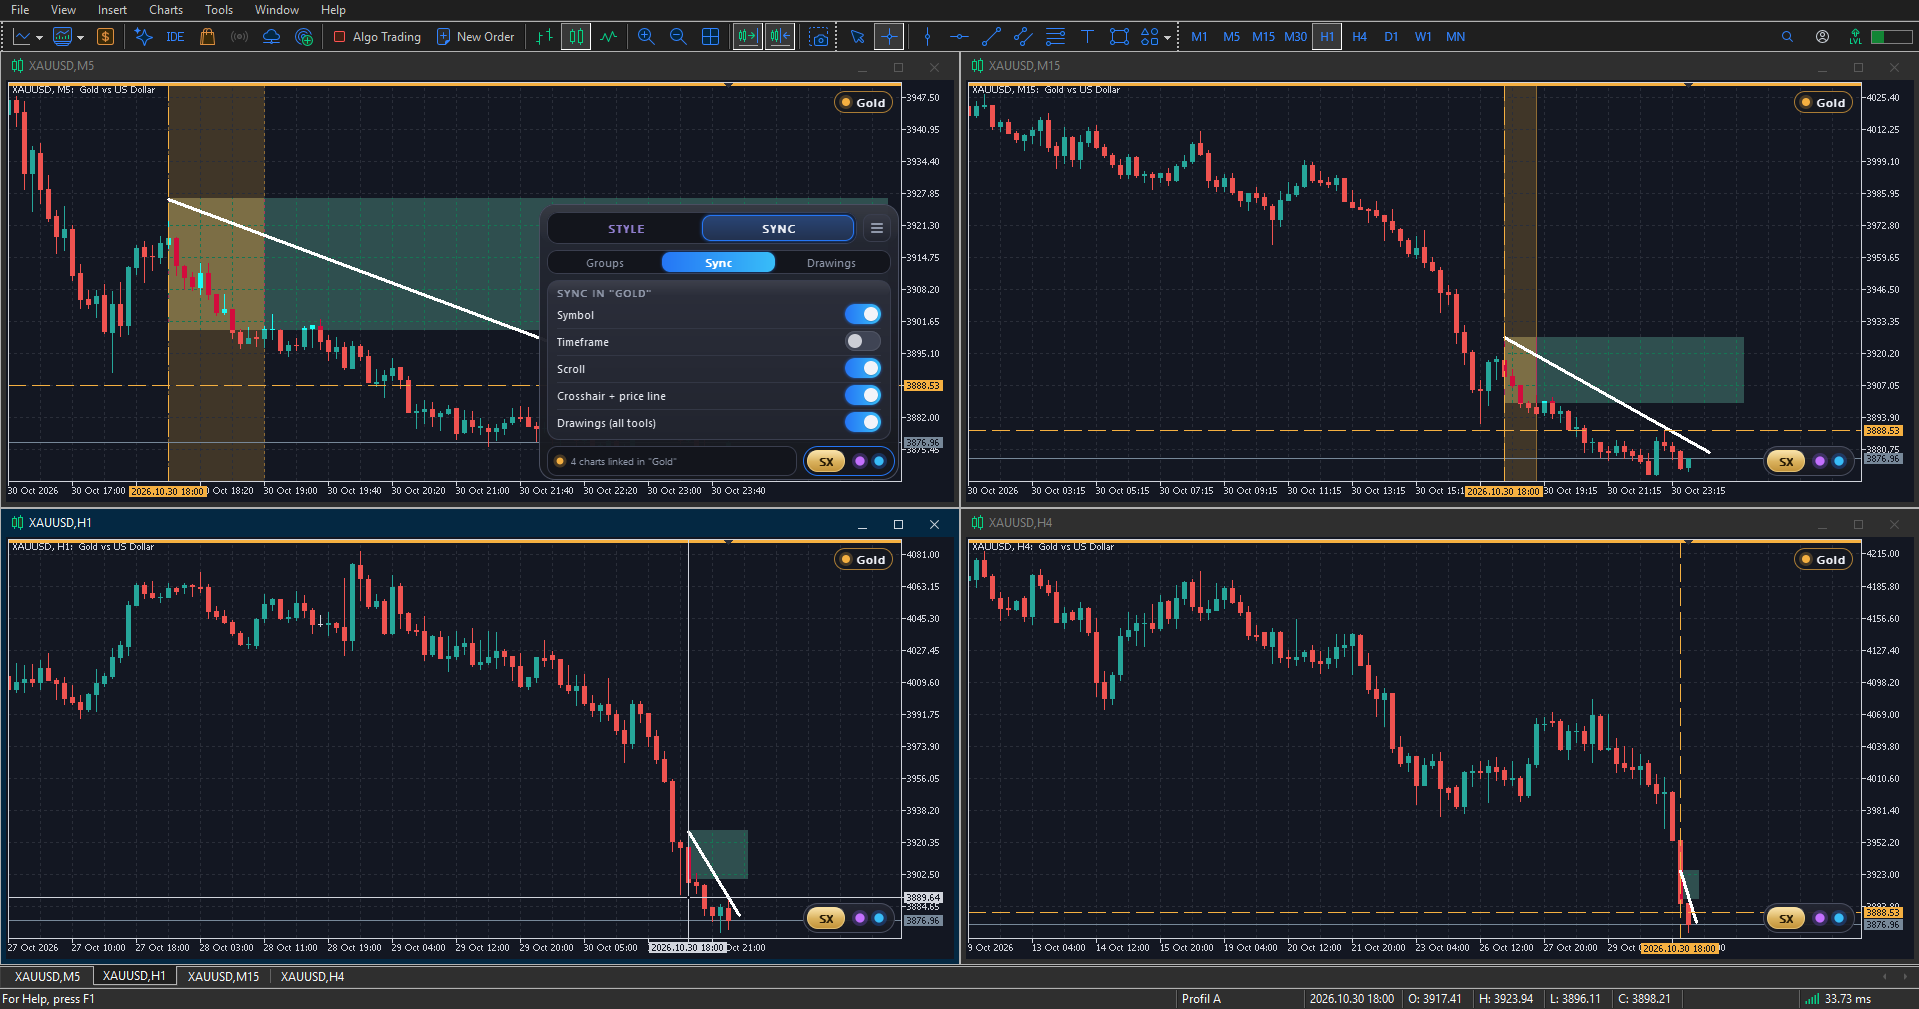
SX Chart Tools is one MetaTrader 5 indicator with two jobs. STYLE gives all your charts the look you want with one click. SYNC links charts into groups, so they change symbol, scroll, show the crosshair and share drawings together. Everything is done from one small panel on the chart. You can find it on the MQL5 Market: SX Chart Tools.
1. Getting started
- Buy or download SX Chart Tools from the MQL5 Market. You find it in the Navigator under Indicators → Market → SX Chart Tools.
- Drag it onto a chart and click OK.
- For STYLE, one copy is enough: it can style all your open charts. For SYNC, put a copy on every chart you want to link.
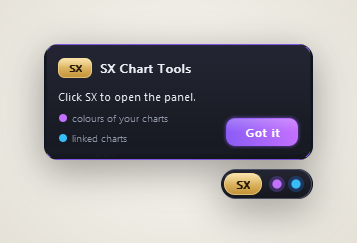
On the first start a short card shows you where to begin. The SX button sits in the corner of the chart:
- SX opens and closes the panel.
- The purple dot opens the STYLE tab. It is bright when a saved look is in use.
- The blue dot opens the SYNC tab. It is bright when the chart is in a group.
The panel
- When the panel is open, its bottom bar carries the SX button in the same place, so you close it where you opened it. The panel always stays in its corner: switching tabs or pages never moves it.
- A click on the chart closes the panel. Only one chart has an open panel at a time.
- On a small chart the panel switches to a compact view with short pages (Looks / Options on STYLE, Groups / Sync / Drawings on SYNC). The ≡ button switches it on or off by hand. The compact view is sized on purpose: even on an average laptop screen (Full HD) the panel opens on every chart of a 4-chart layout.
- If a chart is too small even for the compact view, the panel says so instead of being cut off. The Panel size input (75–100 %) makes the panel smaller.
2. STYLE – one look for all your charts

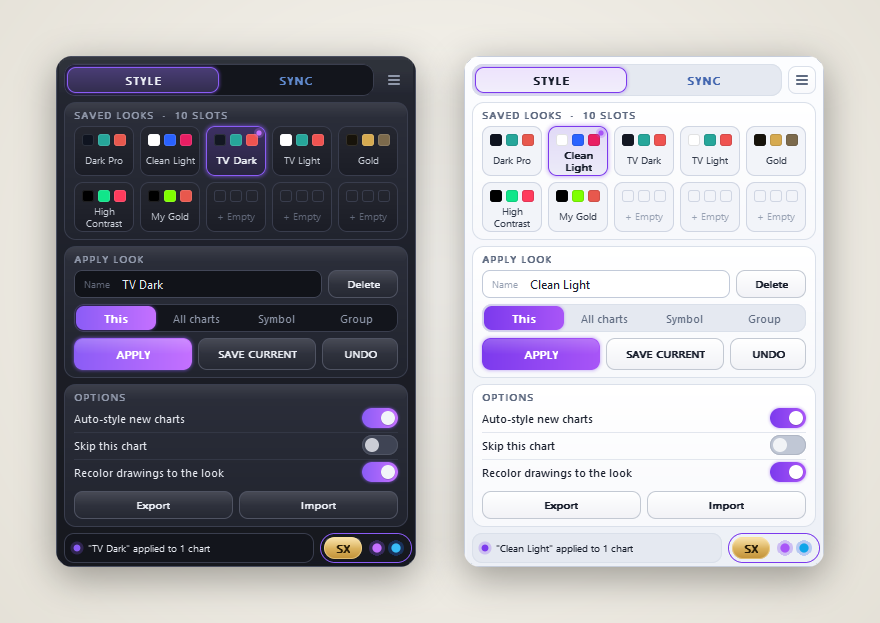
A look stores everything you see on a chart: all colours (background, grid, candles, lines, Bid/Ask), what is shown (chart type, grid, volumes, period separators, OHLC, price and date scale, trade levels, one-click trading) and, if you want, the zoom.
Saved looks
There are 10 slots: 6 ready-made looks (Dark Pro, Clean Light, TV Dark, TV Light, Gold, High Contrast) and 4 free slots for your own. Click a tile to select it. The small dot on a tile shows the look in use.
Apply look
- Choose where the look goes: This (this chart), All charts, Symbol (every chart with the same symbol) or Group (the charts of this chart's SYNC group). Then click APPLY.
- UNDO takes back the last Apply on every chart it changed.
- SAVE CURRENT saves the look of this chart into the selected slot. On a used slot it asks SURE? first – click again to replace it.
- Type a new name into the Name box and press Enter to rename a look. Delete empties the slot (click twice).
Your own look in 30 seconds: press F8, set the colours and options of the chart as you like, select a free slot and click SAVE CURRENT.
Options
- Auto-style new charts – a chart you open later gets the look in use automatically.
- Skip this chart – this chart is left out of All charts, Symbol, Group and Auto-style.
- Recolor drawings to the look – Apply also changes the colour of your drawings to match the look (UNDO brings them back).
- Export / Import – saves all looks to MQL5\Files\SXChartTools\looks_export.txt and reads them back, for example in another terminal.
3. SYNC – charts that move together
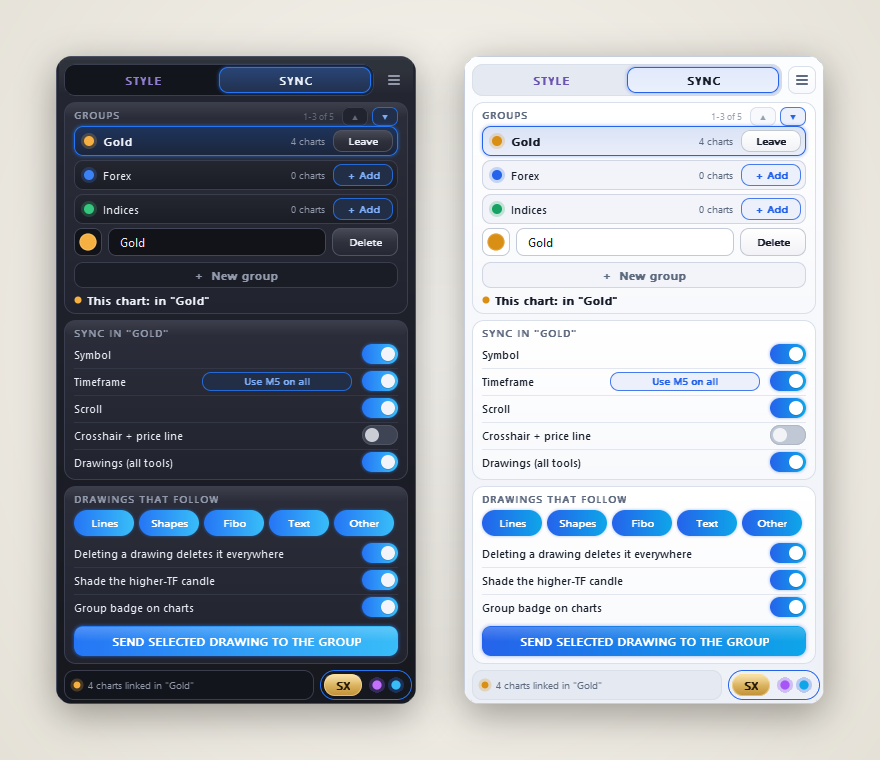
A group is a set of charts that work together. You can have up to 6 groups at the same time; they do not affect each other. A chart can be in one group at a time. Image 01 at the top shows a group in action: a coloured line and the group name on every chart, the same drawings everywhere, and the crosshair of the H1 chart on the others.
Groups
- + New group makes a new, empty group. Then click + Add on its row on every chart you want in it. Leave takes this chart out of its group.
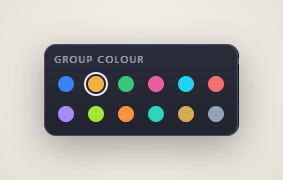
- Click a row to select a group. The row under the list belongs to the selected group: click the colour circle to choose its colour, type a new name and press Enter, or Delete it (click twice – its charts are simply not linked any more).
- The list shows 3 groups. With more, use the small ▲▼ arrows.
What the group follows
| Switch | What it does |
|---|---|
| Symbol | Change the symbol on one chart – the whole group follows. Each chart keeps its own timeframe. |
| Timeframe | Change the timeframe on one chart – the whole group follows (off by default). |
| Scroll | Scroll back on one chart – the others go to the same time. Press End to bring them all back to the latest bar. |
| Crosshair + price line | The others show a vertical line at the same time, and charts of the same symbol a horizontal line at the same price. |
| Drawings (all tools) | A drawing appears on the charts of the group with the same symbol – also on other timeframes. Moving or changing it changes it everywhere. |
If the charts of your group show different symbols or timeframes, a Use EURUSD on all (or Use H1 on all) button appears in that row. One click puts the whole group on this chart's symbol or timeframe.
Drawings
- Lines / Shapes / Fibo / Text / Other – choose which kinds of drawings follow the group.
- Deleting a drawing deletes it everywhere – or only on the chart where you delete it.
- Shade the higher-TF candle – point at a candle on the higher timeframe, and the lower-timeframe charts shade the candles inside it.
- Group badge on charts – the coloured line and the group name at the top of every chart.
- SEND SELECTED DRAWING TO THE GROUP – select a drawing and send it, even if its kind is switched off.
Built-in safety: loading a template or deleting many drawings at once on one chart is not passed on to the group. If a chart with another symbol joins a group that follows the symbol, the panel warns you. A chart that trades 24/7 (like BTC) does not jump back to Friday because a forex chart in the group is closed at the weekend.
4. Settings, tips and questions
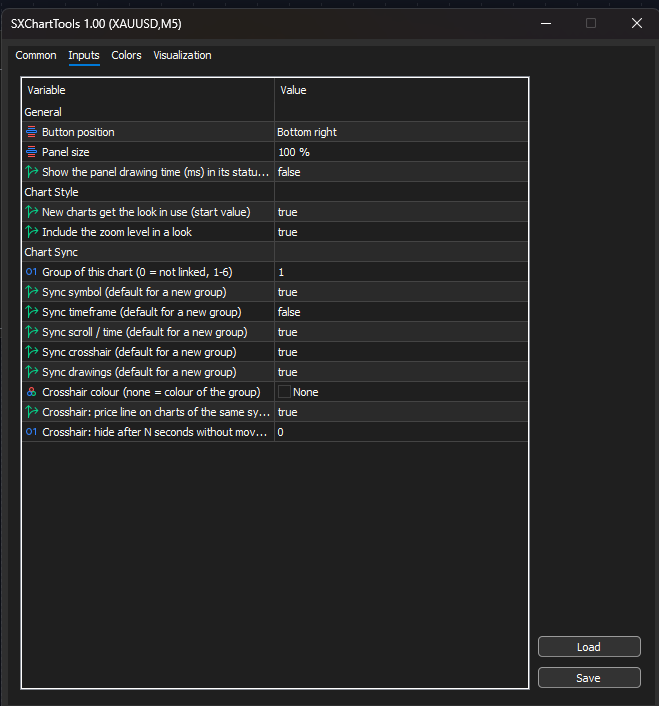
The inputs are only starting values – almost everything can be changed on the panel. Worth knowing: Button position (any corner of the chart), Panel size, Group of this chart (0 = not linked), the switches a new group starts with, and the crosshair colour, price line and hide time.
Three ready setups
- One instrument on 4 timeframes: Symbol, Scroll, Crosshair and Drawings on, Timeframe off.
- 4 instruments on one timeframe: Symbol off, Timeframe on – change the timeframe once for all four.
- Two groups at once: for example gold on 4 timeframes in one group and 4 forex pairs in another, each with its own colour.
Tip: Alt+R tiles all open charts. To tile only one instrument's charts, keep an MT5 profile for each instrument, or minimise the other charts first.
Trying the demo
The demo runs in the Strategy Tester in visual mode, where MetaTrader opens only one chart. There you can open the panel, try the looks on the STYLE tab, save your own and use UNDO. Renaming a look is not possible in the tester. The SYNC tab opens as well, but it needs at least two real charts, so it can only be tried in the live terminal.
Tip: move the speed slider of the tester down. At full speed the chart updates so fast that the panel hardly reacts to clicks.
Questions
My drawings are gone. Check the object list (Ctrl+B) – they are usually still there. If Scroll is on, the chart may be scrolled back in time: press End.
A drawing does not appear on another chart. Drawings go to charts in the same group with the same symbol, and only the kinds switched on under Drawings that follow.
A chart changed its symbol by itself. Its group has Symbol on: a symbol change on any chart of the group moves them all.
It feels slow with many charts. Switch off what you do not need in the group, for example the crosshair.
SX Chart Tools is available on the MQL5 Market: SX Chart Tools for MetaTrader 5. If you have a question or an idea, send me a private message.