Gravity Center Pro – User Guide (setup, auto-calibration, non-repaint channel, alerts, EA buffers)

Gravity Center Pro by Northline Algo — product page and free demo · real MT5 demo video
Contents
- Overview
- Installation and first launch
- Reading the channel
- The decision panel
- Auto-calibration (walk-forward)
- Classic vs non-repaint channel
- Alerts
- Input parameters
- Using it in an Expert Advisor (iCustom buffers)
- Troubleshooting
- Honest limits and support
1. Overview
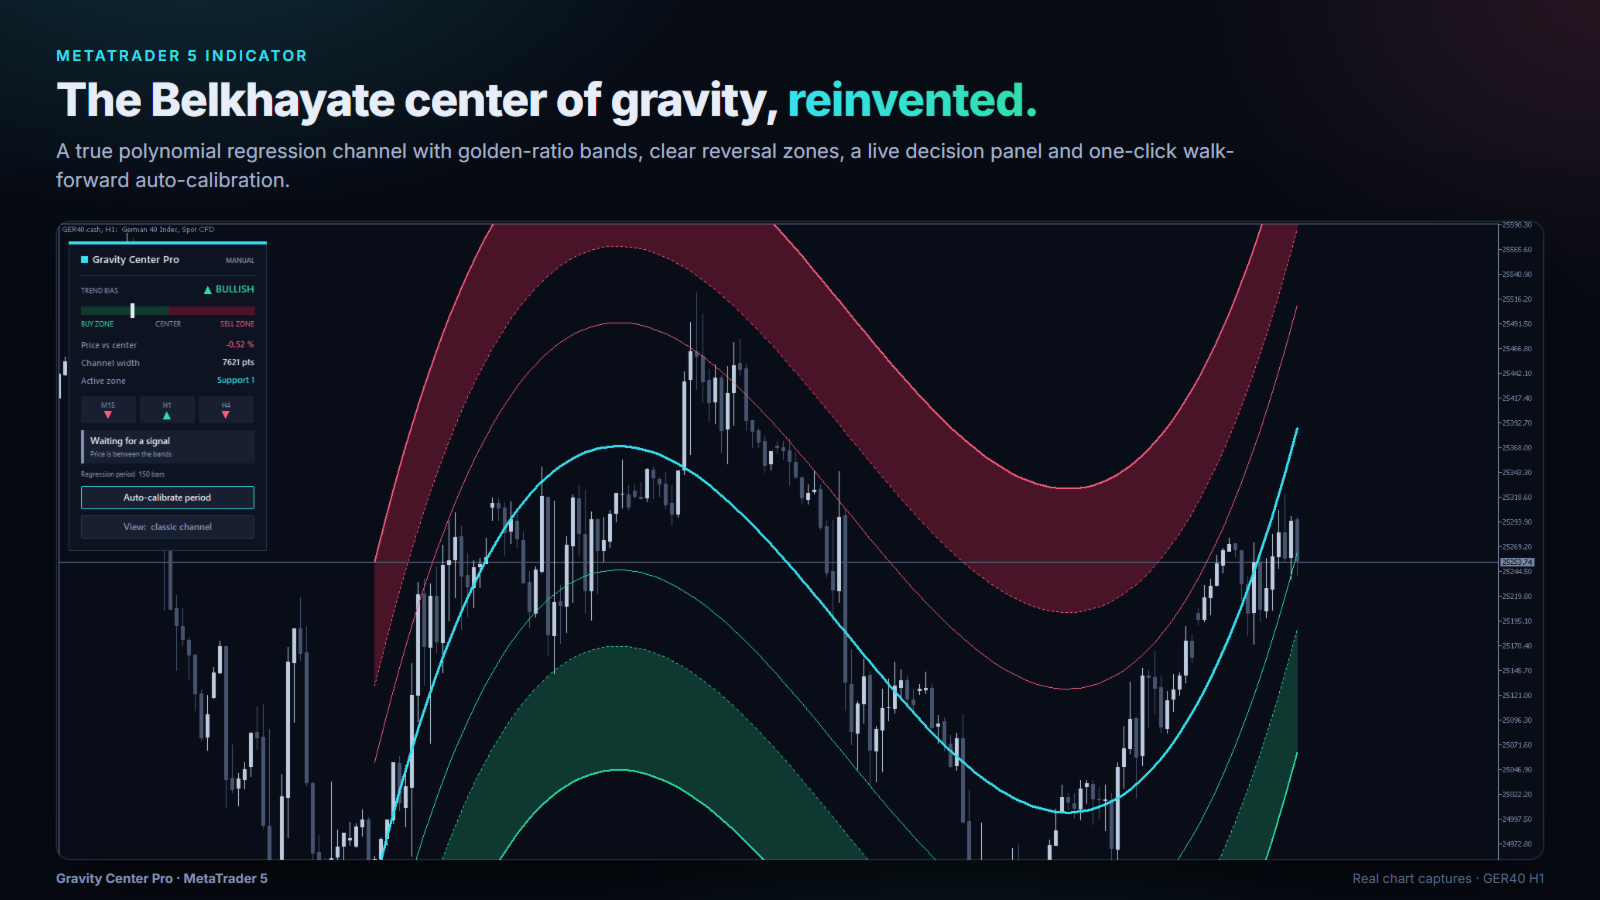
Gravity Center Pro is a from-scratch MetaTrader 5 implementation of the Belkhayate center of gravity: one smooth polynomial regression curve (the center) with three resistance and three support bands placed at golden-ratio distances (1.618, 2.618 and 4.236 standard deviations).
The idea is simple: price oscillates around its center of gravity. The outer zones show where price is stretched; from there it tends to come back toward the center. The bands follow the market's own volatility, so the same settings work on gold, forex, indices and crypto, on any timeframe.
What it adds to the classic method:
- Walk-forward auto-calibration: one click finds the most robust regression period and tells you honestly whether it held up out-of-sample.
- Classic or non-repaint channel, switchable with one click, or both at once.
- A live decision panel: trend bias, zone gauge, multi-timeframe bias, last signal.
- Trend-filtered alerts: one alert per move, sent on bar close.
2. Installation and first launch
- Buy or download the demo from the MQL5 Market. It appears in Navigator → Indicators → Market.
- Drag Gravity Center Pro onto any chart. Keep the defaults (period 150, degree 3); they are a sound starting point.
- The chart takes on the Aurora theme (or Gold if you selected it). Your original chart colors come back when you remove the indicator.
Tip: to try before buying, run the free demo in the Strategy Tester with Visual mode on. It is exactly the same indicator.
3. Reading the channel
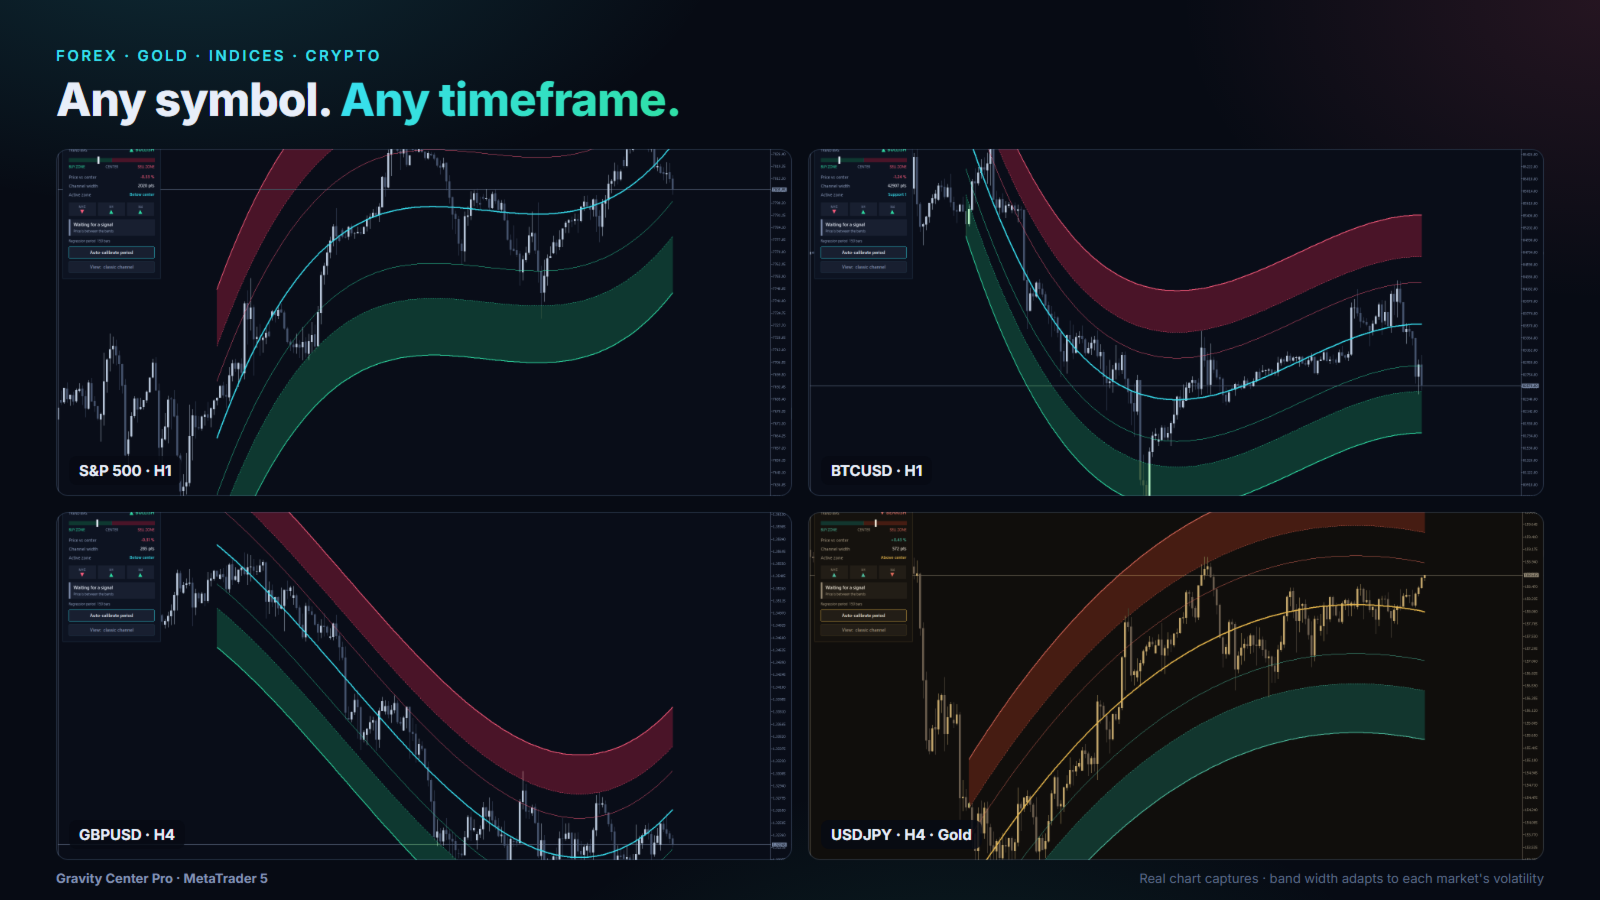
- Center (cyan line): the center of gravity, a degree-3 polynomial regression of the last N bars.
- R1 / S1: first resistance / support, 1.618 standard deviations from the center.
- Red zone (R2–R3): sell zone, where price is stretched upward.
- Green zone (S2–S3): buy zone, where price is stretched downward.
How traders typically use it:
- A touch of the buy zone points to a possible move back up toward the center; a touch of the sell zone to a possible move back down toward it.
- The center is the natural target of a mean-reversion move.
- Confirm with the trend bias and the higher timeframes (panel), and always manage your risk.
4. The decision panel
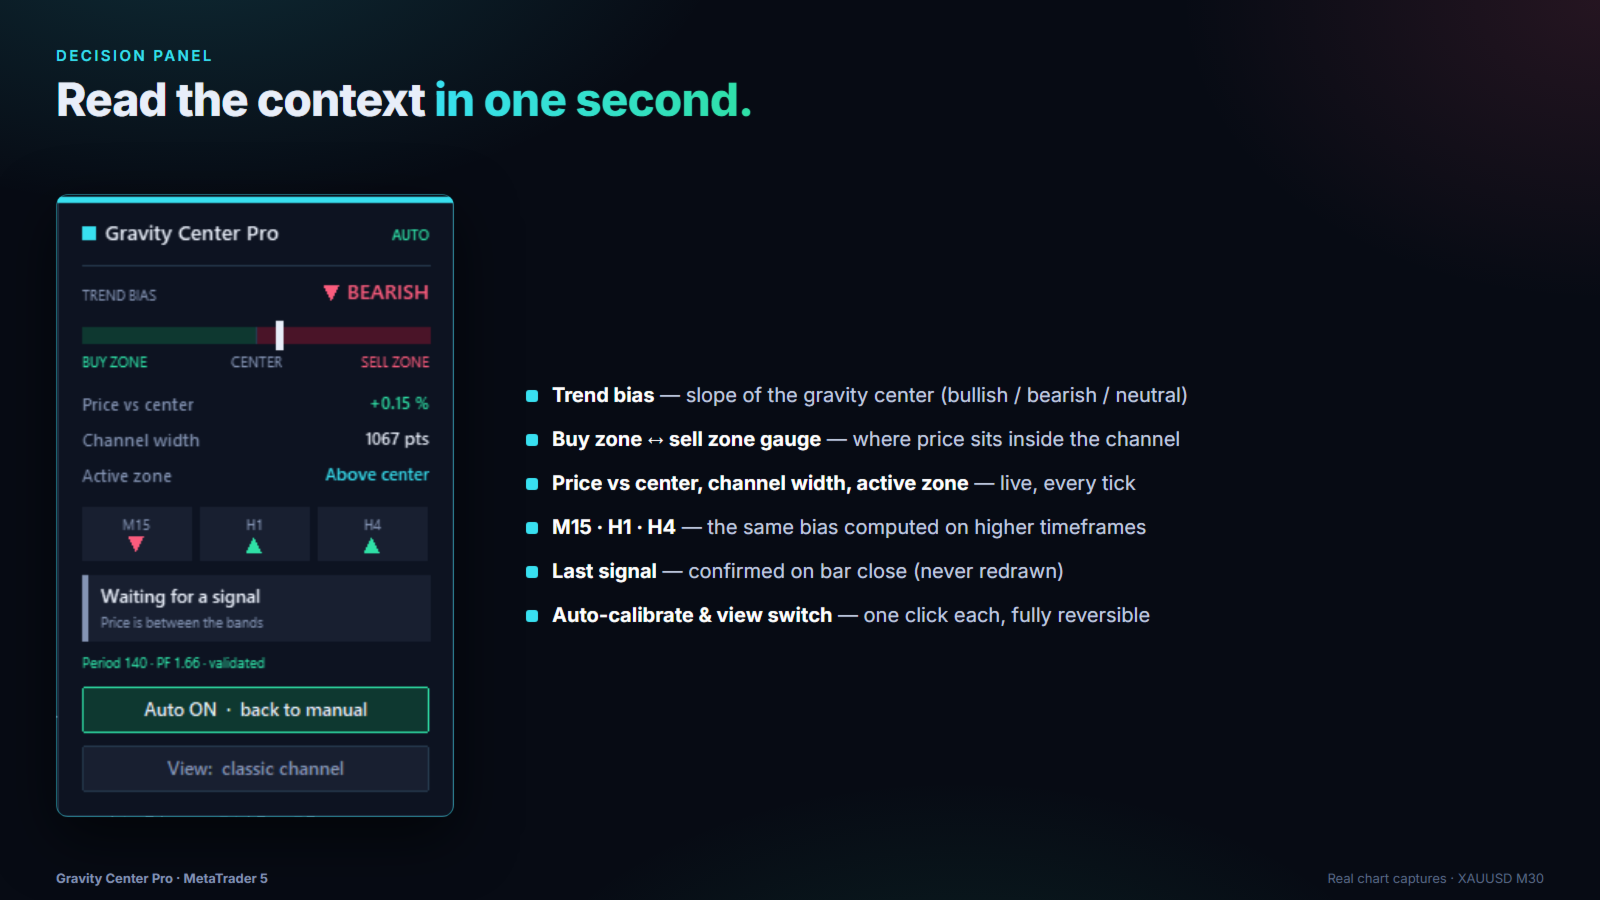
- Trend bias: BULLISH / BEARISH / NEUTRAL, from the slope of a linear regression (trend filter window).
- Gauge: where the price sits between the buy zone and the sell zone.
- Price vs center: distance from the center, in percent.
- Channel width: width of the channel in points (a volatility gauge).
- Active zone: Resistance 1–3, Support 1–3, above/below center.
- M15 / H1 / H4: the bias computed with the same method on three higher timeframes.
- Last signal: the last confirmed signal (buy zone / sell zone reached).
- MANUAL / AUTO badge: whether auto-calibration is active.
The panel can sit on the left or on the right (Panel on the left input), or be hidden.
5. Auto-calibration (walk-forward)
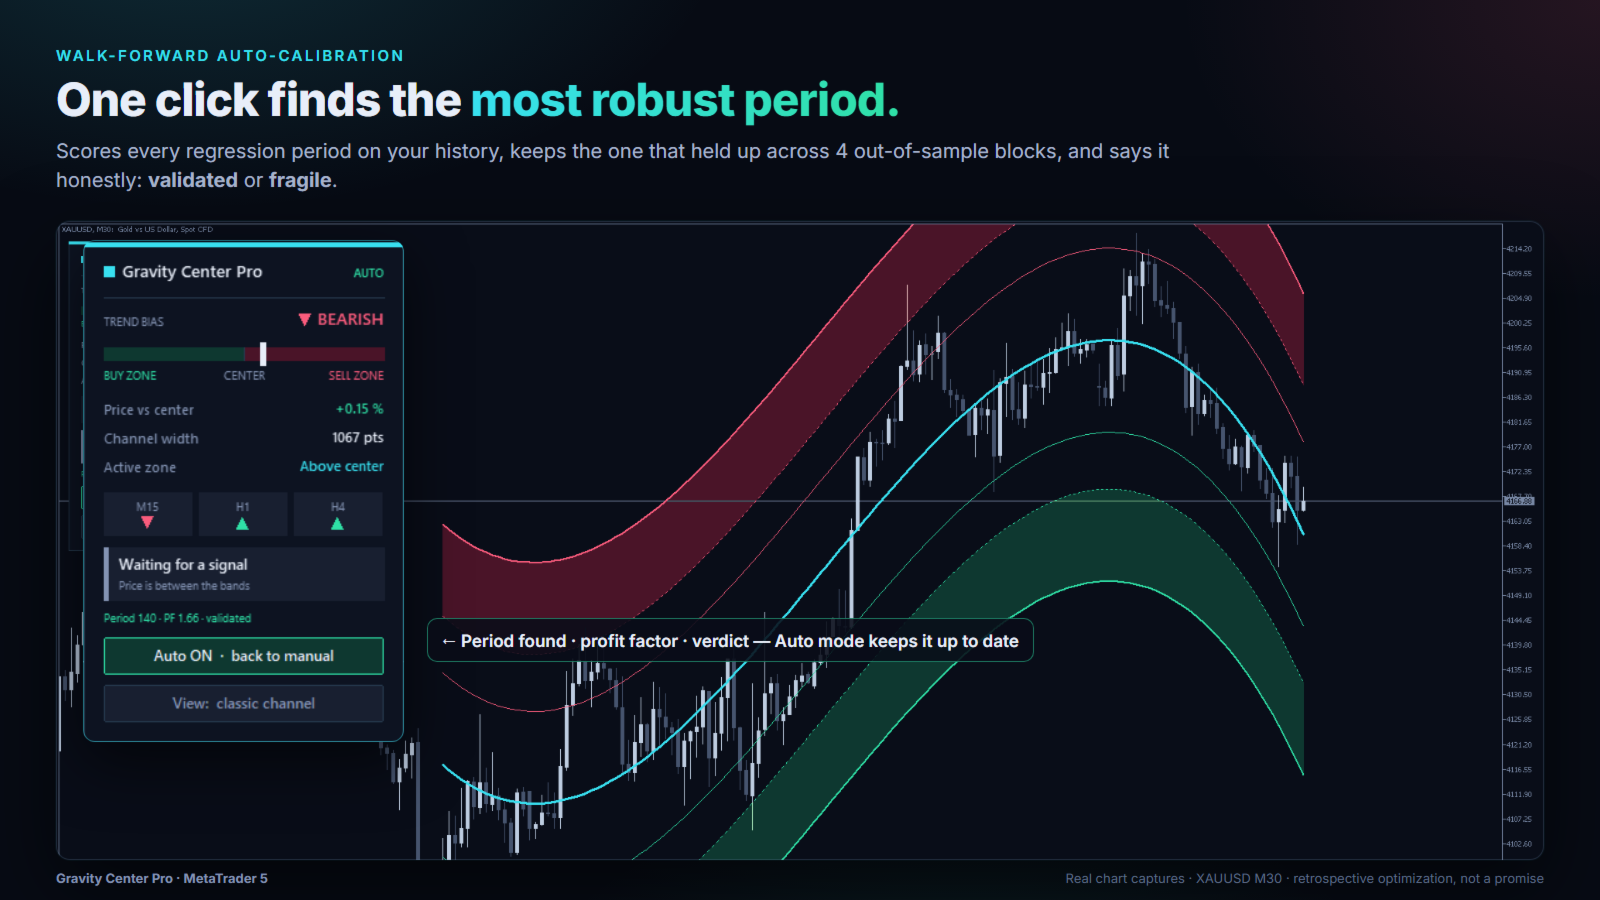
Click Auto-calibrate period. The indicator:
- Tests every regression period from 50 to 400 on up to 5000 bars of history.
- Scores each one on four separate out-of-sample blocks (walk-forward).
- Keeps the period whose results held up best, from the middle of a robust plateau rather than a lucky peak.
- Shows an honest verdict: validated (profitable in at least 3 of the 4 blocks) or fragile.
The button then reads Auto ON · back to manual. In auto mode the period is re-checked every 50 closed bars (Re-calibrate every N bars). Click the button again to return to your manual period.
Want auto mode from the start? Set Start with auto-calibration ON to true. It survives terminal restarts.
Important: calibration is a retrospective optimization. A "validated" period held up on past data; that is useful information, never a guarantee for the future.
6. Classic vs non-repaint channel
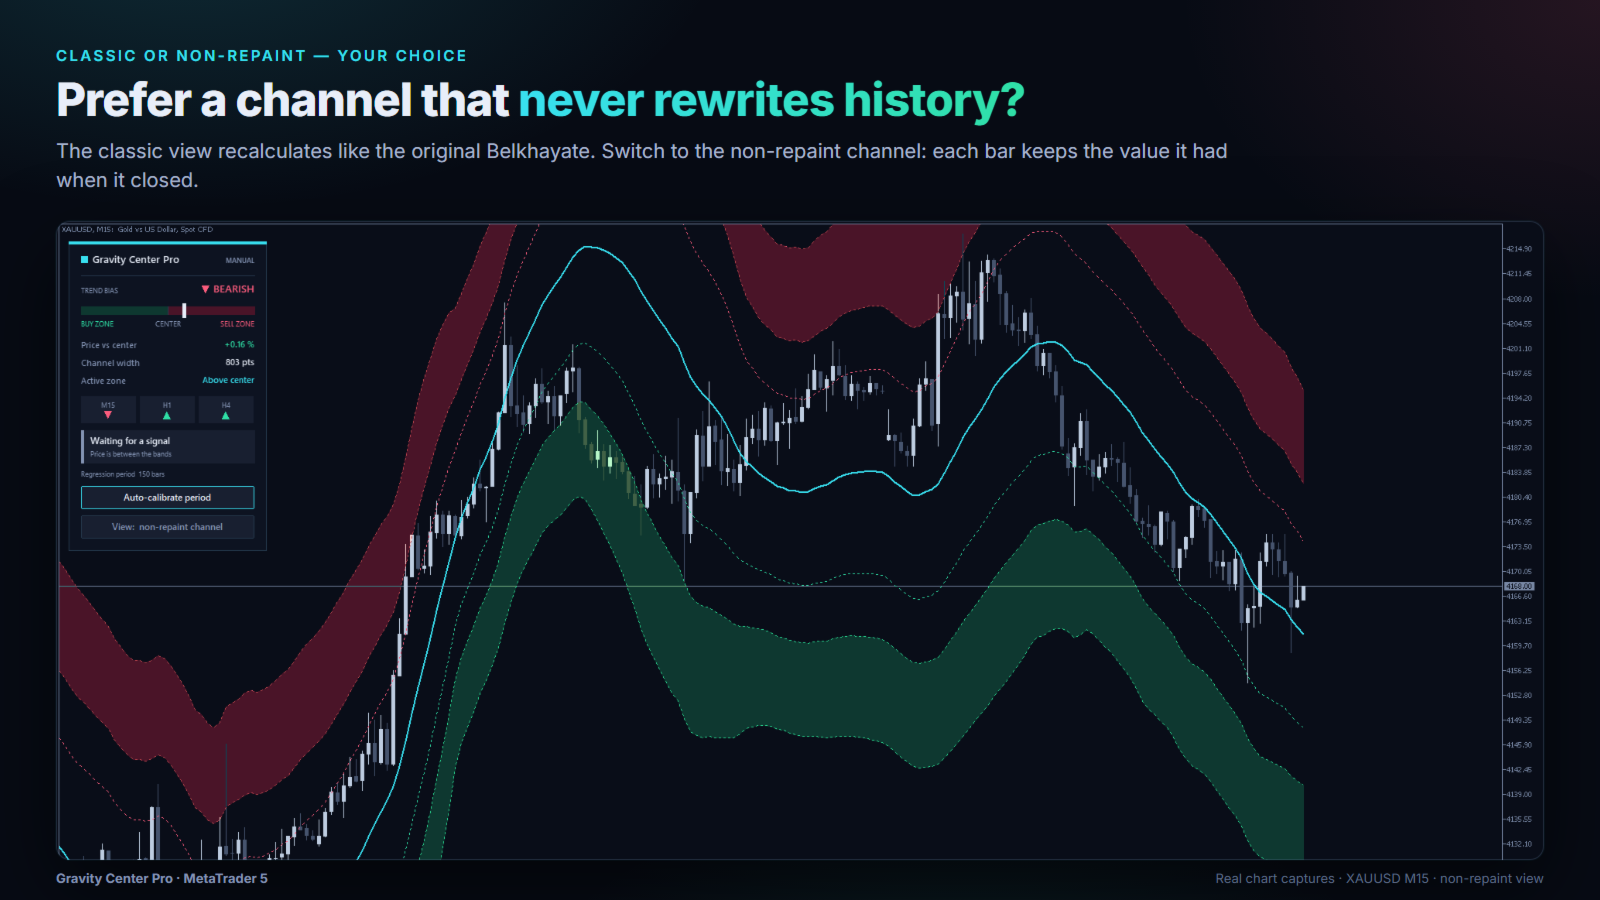
The classic channel is recalculated on every new bar, like the original Belkhayate method. This means its past values change: the curve "repaints". It always shows the best current fit, but you cannot read past signals from it as if they had been visible at the time.
The non-repaint channel stores, for every bar, the value the channel had when that bar closed. Its history never changes. What you see on old bars is exactly what was visible in real time.
Click View: … on the panel to switch between classic, non-repaint and both. You can also set the default view with the Channel display input. The demo video on the product page shows both side by side in a Strategy Tester replay.
7. Alerts
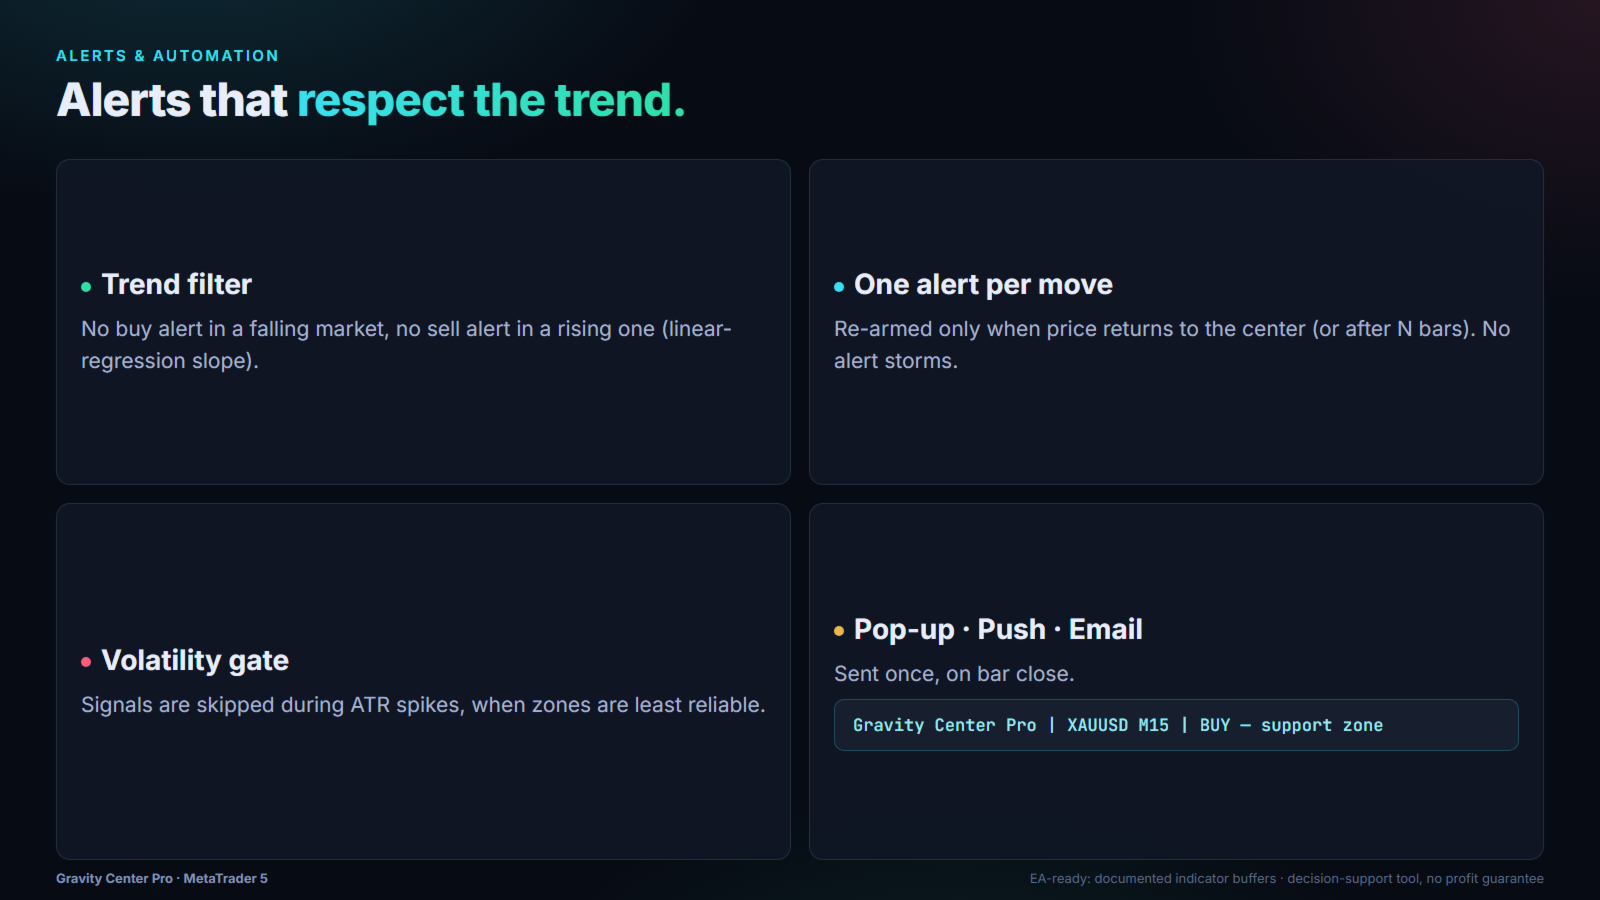
A signal fires when a closed bar enters the buy zone (low crosses S2) or the sell zone (high crosses R2).
Filters (each can be turned off):
- Trend filter: no buy signal in a falling market, no sell signal in a rising one.
- Volatility gate: no signal during an ATR spike (above 1.5 × median ATR by default).
- Anti-burst: one alert per move. The same side re-arms after 24 bars or when price returns to the center.
Delivery: pop-up with sound (on by default), push notification to the MetaTrader mobile app, email. Push and email need to be configured in Tools → Options → Notifications / Email.
No alerts are sent in the Strategy Tester.
8. Input parameters
| Input | Default | What it does |
|---|---|---|
| Visual theme | Aurora | Aurora (cyan/teal) or Gold |
| Apply matching chart style | true | Chart colors follow the theme, restored on removal |
| Regression window | 150 | Number of bars used for the channel |
| Polynomial degree | 3 | 2 to 4; higher = more curvature |
| Band 1 / 2 / 3 | 1.618 / 2.618 / 4.236 | Band distances in standard deviations |
| Trend filter | true | Skip counter-trend signals |
| LR trend window / slope lookback | 150 / 30 | Settings of the trend filter |
| Volatility gate / threshold | true / 1.5 | Skip signals during ATR spikes |
| Pop-up / Push / Email alert | true / false / false | Alert channels |
| Alert re-arm | 24 | Bars before the same side can alert again |
| Show panel / Panel on the left | true / true | Panel display |
| Show auto-calibration button | true | Show or hide the button |
| Start with auto-calibration ON | false | Auto mode from the first load |
| History bars for calibration | 5000 | Depth of the calibration test |
| Auto re-calibrate / every N bars | true / 50 | Refresh while auto mode is on |
| Channel display | Repaint | Classic, Non-repaint or Both |
| Auto-calibration target | Both | Which channel the calibrated period applies to |
| Non-repaint history depth | 5000 | Bars computed for the non-repaint channel |
9. Using it in an Expert Advisor (iCustom buffers)
| Buffer | Content |
|---|---|
| 4 | Gravity center (classic) |
| 5 / 6 / 7 | R1 / R2 / R3 (classic) |
| 8 / 9 / 10 | S1 / S2 / S3 (classic) |
| 11 | Non-repaint center |
| 12–14 / 15–17 | Non-repaint R1–R3 / S1–S3 (filled in non-repaint or both view) |
| 0–3, 18–21 | Zone fills (display only) |
Empty values are EMPTY_VALUE. When called from an EA, the indicator draws no panel and does not change the chart. For backtests, read the non-repaint buffers (11–17) on closed bars (shift ≥ 1).
10. Troubleshooting
- The panel does not appear: check Show panel; make sure the chart is wide enough; reattach the indicator.
- Calibration says "fragile": the market had no stable period on this symbol/timeframe. Try a higher timeframe, or keep the default period.
- No alerts: alerts only fire on closed bars and are filtered by trend and volatility; check that pop-up/push/email are enabled and configured.
- The channel moved on old bars: that is the classic (repainting) channel. Switch to the non-repaint view if you need a fixed history.
- Slow first load: the non-repaint channel and the calibration compute thousands of bars once; reduce Non-repaint history depth or History bars for calibration on slow machines.
11. Honest limits and support
Gravity Center Pro is an analysis and decision-support tool. It does not place trades and does not guarantee any profit. Past robustness never guarantees future results. Test on a demo account first and always use your own risk management.
Questions, settings advice or a feature request? Send a private message on MQL5. We answer quickly and keep the product updated.
Northline Algo sells only through the MQL5 Market. We never contact you first and never sell "special versions" on Telegram or in private.


