Recovery factor: how many times an account has already earned back its worst fall

Every signal page on MQL5 carries a small row called Recovery Factor. Most readers skip it on the way to the growth figure. It is one of the few rows on the page that puts the profit and the pain into one number, and it takes ten seconds to read properly.
What it is
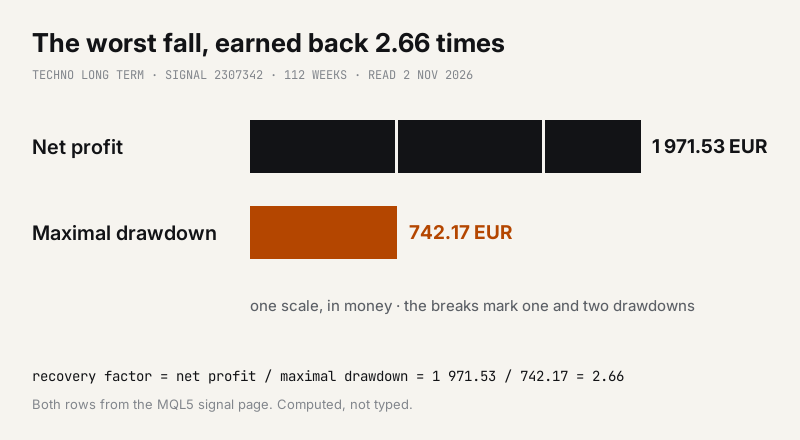
Recovery factor is the net profit divided by the largest fall the account has had, both in money. A recovery factor of 1 means the account has earned exactly as much as it once lost from a peak. A recovery factor of 3 means it has earned that worst fall back three times over.
Our own flagship signal, Techno Long Term, as its page reads this morning: a profit of 1 971.53 EUR and a maximal balance drawdown of 742.17 EUR. 1 971.53 divided by 742.17 is 2.66, which is the figure the page prints.
Why it is read in money
A drawdown in percent depends on the size of the account when the fall happened. The same page shows a relative drawdown by balance of 38.63%, and next to it the amount: 40.00 EUR, from the months when the account was still small. In money, the deepest fall was 742.17 EUR. Recovery factor uses the money, so a fall early in the life of a small account cannot make it look better or worse than it was.
Why it needs its window
The ratio only means something next to the time it took. Techno Long Term has run for 112 weeks. A recovery factor of 2.66 over two years says something different from the same number over two months, because a young account simply has not met its worst stretch yet. On a short history a high recovery factor is mostly a measure of luck.
How it moves
It falls in two ways: when profit shrinks, and when a new, deeper fall replaces the old maximum. This page is a fair example of the first. The monthly growth row reads -24.02% for the current month, and every euro of that comes out of the top of the ratio while the bottom stays where it was.
That is the useful part. A system that keeps its recovery factor through bad months is one whose bad months are smaller than the worst it has already shown. A system whose ratio collapses in one month has just met a fall it had not met before.
What it does not tell you
It does not tell you how deep the next fall will be. The maximal drawdown is the worst that has happened so far, not the worst that can happen, and it can only grow. Plan the account for a deeper fall than the page shows, not for the same one.
It also says nothing about how long the falls lasted. Two accounts with the same ratio can spend very different amounts of time below their last high. For that, look at the balance curve itself.
A check you can run on any signal page
1. Recompute it. Divide Profit by the Maximal drawdown in money. If your number and the page disagree, find out why before you trust either.
2. Put the weeks next to it. Under a year of history, treat any recovery factor as provisional.
3. Watch it after a bad month. A ratio that holds tells you the bad month stayed inside what the account had already survived.
The page used in this post, with every row named here, is Techno Long Term on MQL5. Past results, ours included, do not predict future ones.