Tick Volume in MT5: What It Measures and When You Can Trust It

This article is for informational and educational purposes only. It does not constitute financial advice or an investment recommendation. Trading in financial markets carries a high risk of loss.
Introduction
Volume is one of the key ideas in technical analysis: it shows how much interest there is behind a price move. But on most forex pairs and CFDs in MetaTrader 5, the volume you see is not the number of contracts traded. It is tick volume, and treating it as real volume, or comparing its values between brokers, leads to wrong conclusions.
This article is divided into three sections. The first explains what tick volume measures and what it does not. The second shows how to read it in a consistent and comparable way. The third covers a step-by-step example, how to check volume in MT5 and the most common mistakes.
1. What tick volume measures
Two kinds of volume in MT5
MetaTrader 5 works with two different volumes. In the Volumes indicator, you choose between them in the settings, and in MQL5 each bar stores both values (tick_volume and real_volume).
| Feature | Tick volume | Real volume |
|---|---|---|
| What it counts | Number of price updates in the bar | Number of contracts or shares traded |
| Where it is available | All symbols | Only exchange-traded symbols, if the broker provides it |
| Comparable between brokers | No | Yes, for the same exchange |
On forex and CFDs, real volume is usually zero or not available. Check it in your own terminal.
Why forex has no central volume
Spot forex is not traded on a single exchange. Each broker and liquidity provider only sees its own flow, so there is no official total of how much was traded. CFDs are similar: the DAX CFD on your broker is not the DAX future traded on the exchange, even though their prices move together. Tick volume is the closest measure of activity available on these markets.
Is tick volume a valid substitute?
The idea behind it is simple: when more participants are trading, price changes more often, so more ticks arrive in each bar. Comparisons between tick volume and the volume of the equivalent exchange-traded futures have generally found that both rise and fall together, although the match is not perfect.
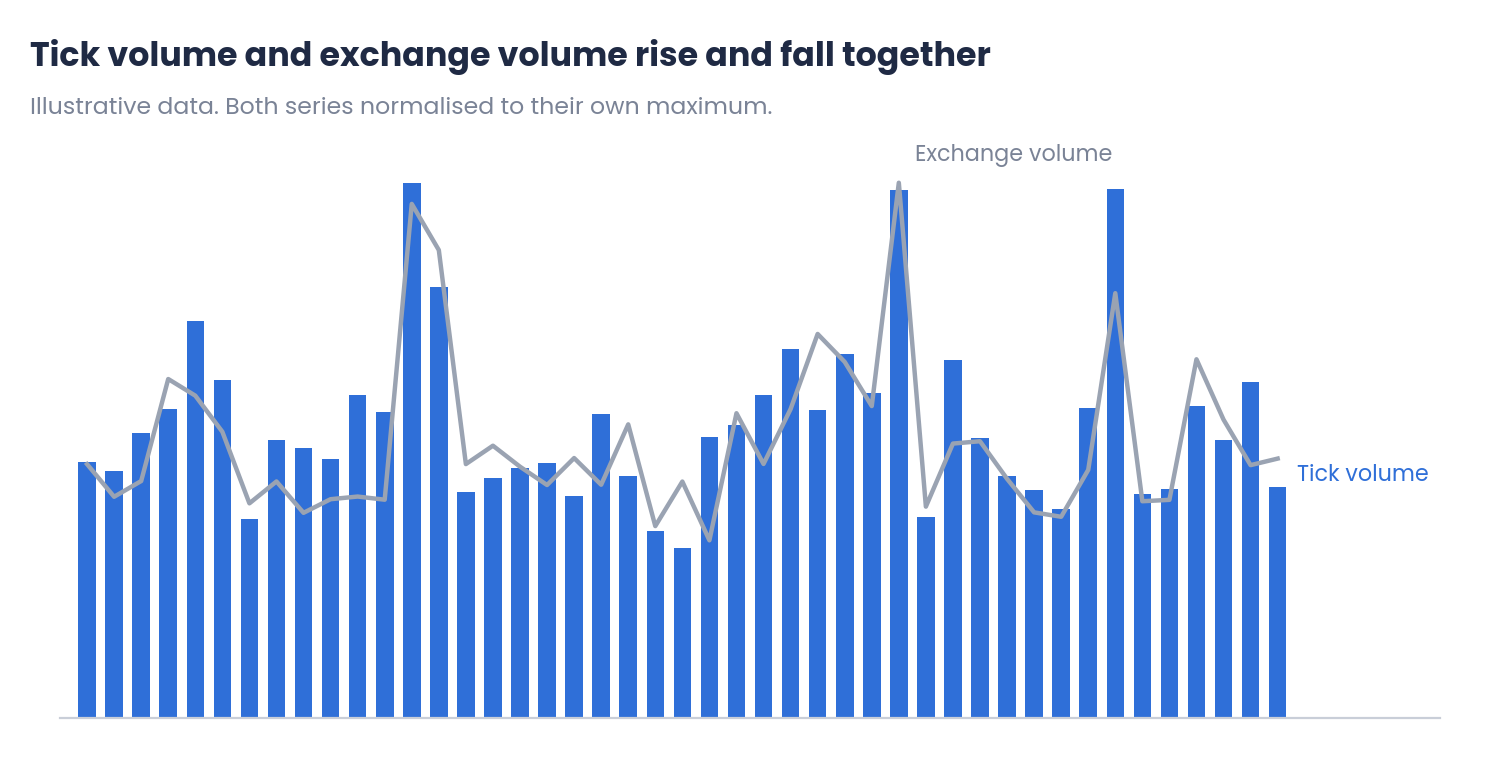
Figure 1. Tick volume and exchange volume on the same bars (illustrative data)
Tick volume is therefore useful as a measure of activity, not as a measure of the amount traded.
What tick volume does not tell you
- Size. A trade of 1 lot and a trade of 100 lots can produce the same single tick.
- Direction. It does not show whether buyers or sellers dominated the bar.
- Absolute level. A value of 2,000 ticks means nothing on its own: it depends on the broker, the symbol and the timeframe.
2. Reading tick volume consistently
Compare it with its own average
Since the absolute value is not reliable, the useful question is whether the current volume is higher or lower than usual for that symbol. The simplest way is relative volume:
Relative volume = Current tick volume ÷ Average tick volume (last N bars)
It is the same logic used for the volatility ratio in the article on ATR volatility: the value is read in relation to the asset's own history.
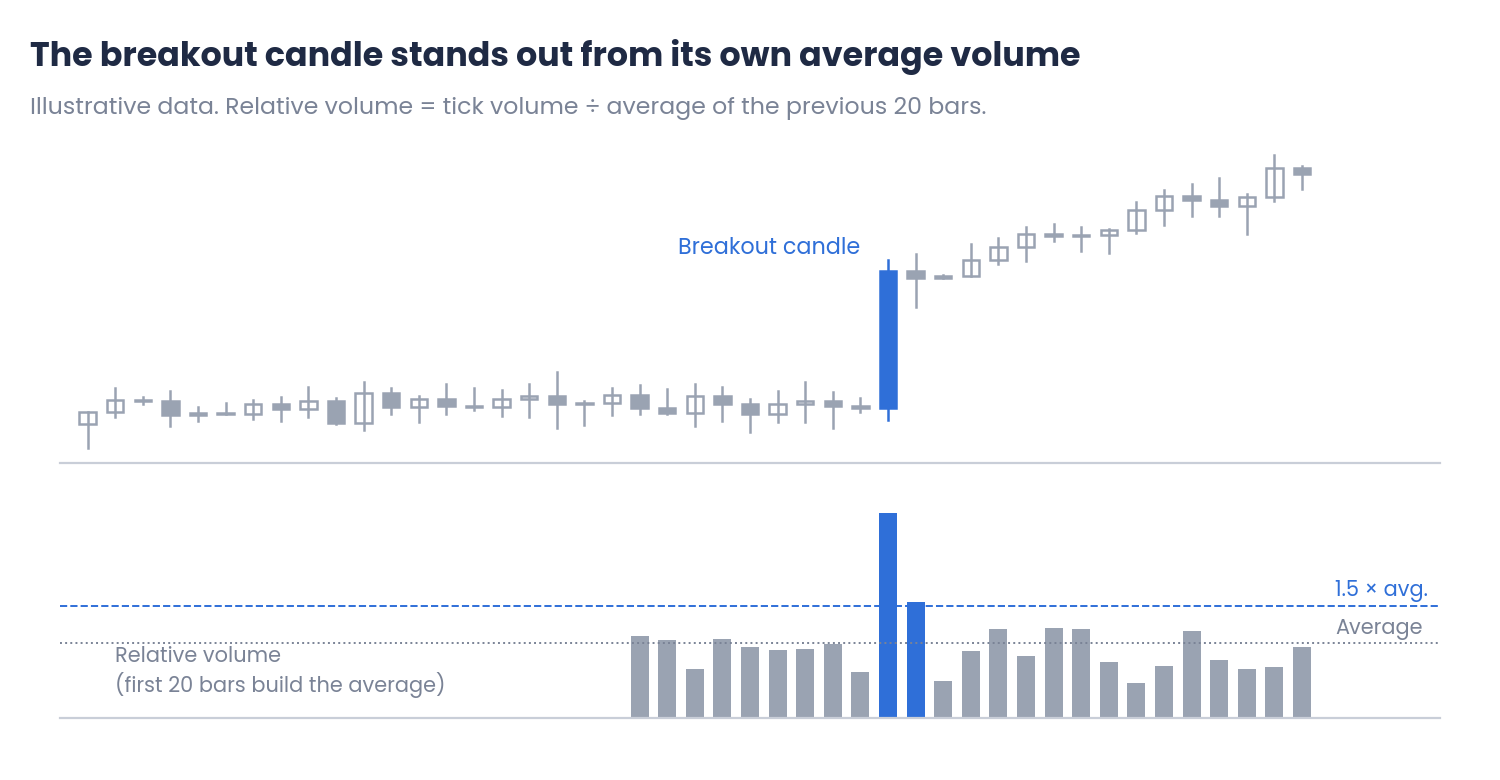
Figure 2. Relative volume on a breakout candle
A breakout with relative volume well above 1 shows more participation than normal. A breakout with volume below its average deserves more caution. Thresholds such as 1.5 are a reference for testing, not a rule.
Take the time of day into account
Tick volume follows the trading sessions. On many currency pairs it is low during the Asian session and rises sharply at the London open and during the overlap with New York.
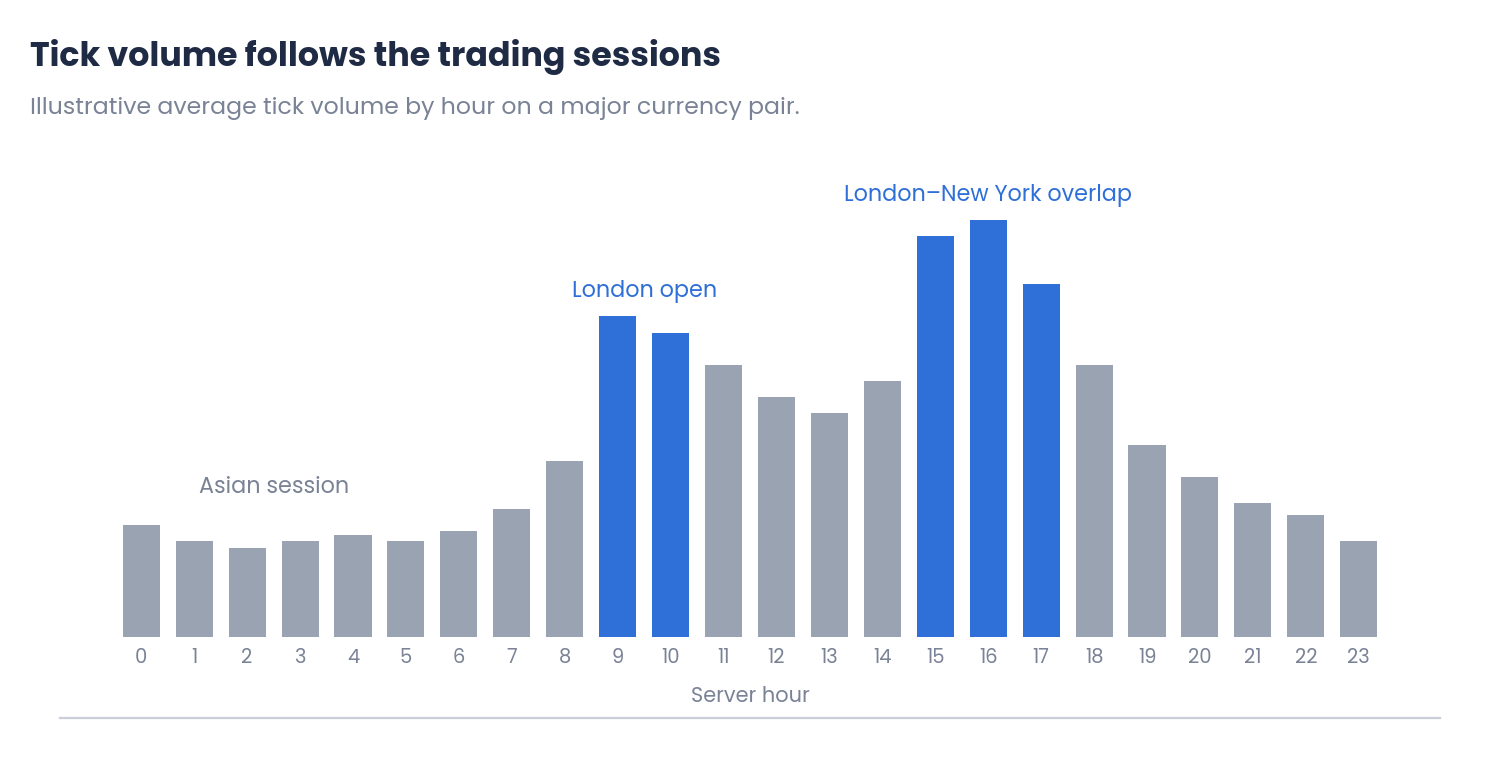
Figure 3. Average tick volume by server hour (illustrative)
On intraday charts, a bar at the London open will almost always have more volume than a bar at 3 a.m., without that meaning anything special. For a fairer comparison, compare each bar with the average volume of the same hour over the previous days.
Same market, different broker
Two brokers can show very different tick volume values on the same symbol, because each receives a different number of price updates and may filter them differently. The shape, however, is usually similar: activity rises and falls at the same moments.
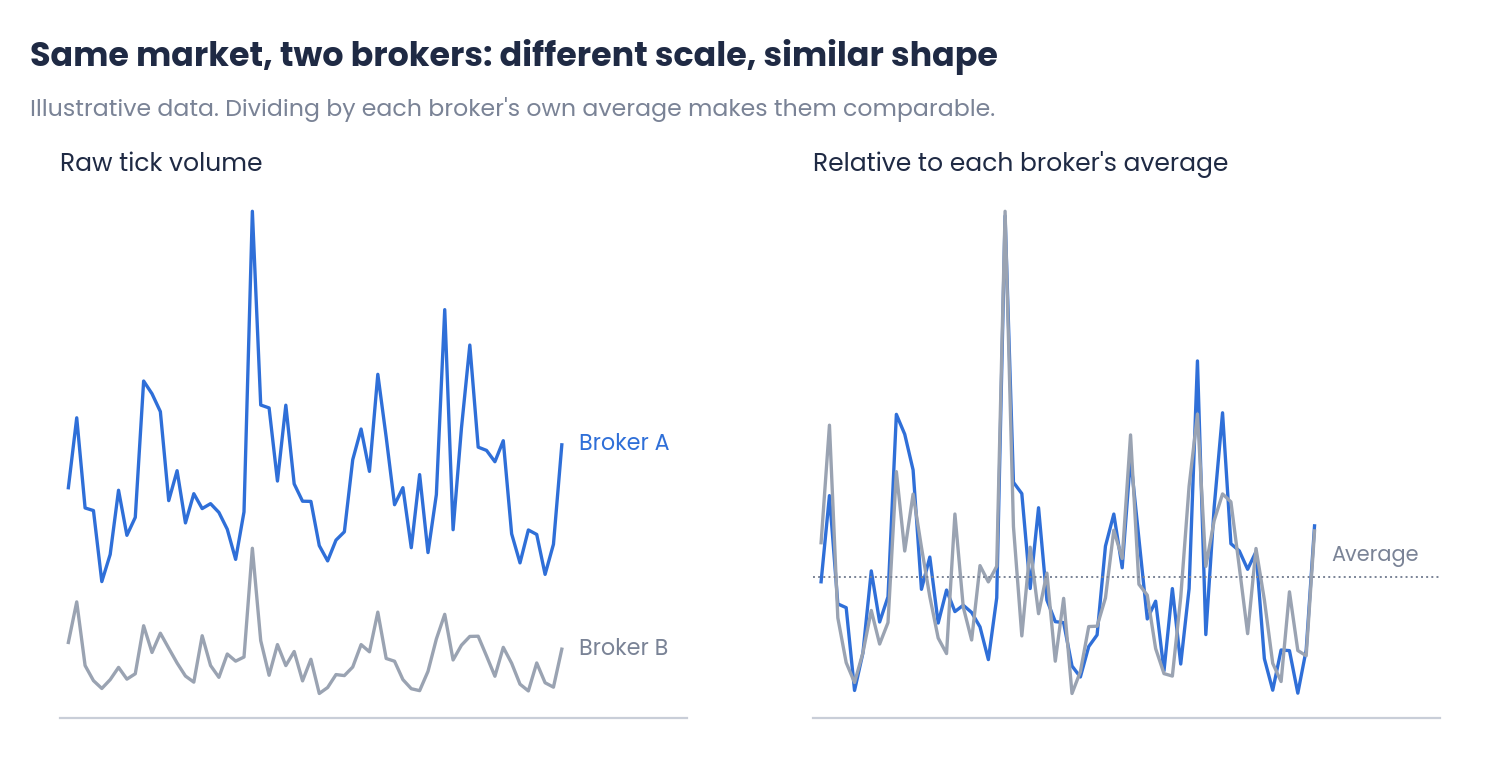
Figure 4. Raw and relative tick volume on two brokers (illustrative)
Once each series is divided by its own average, the two become comparable. This also matters when testing a strategy: a volume rule tested with one broker's data may behave differently on another.
3. Applying it in practice
Step-by-step example: is this breakout volume really high?
Suppose EURUSD breaks a range on H1 at the London open, and we want to know whether that bar shows unusual activity.
| Step | Value | Reading |
|---|---|---|
| 1. Tick volume of the breakout bar | 4,200 | The value on its own says nothing |
| 2. Average of the previous 20 bars | 2,800 | Mostly quieter Asian-session bars |
| 3. Relative volume (4,200 ÷ 2,800) | 1.50 | It looks clearly above average |
| 4. Average of the same hour, last 20 days | 4,000 | The London open is always busy |
| 5. Same-hour ratio (4,200 ÷ 4,000) | 1.05 | Normal activity for that hour |
Illustrative values. Tick volume depends on the broker, the symbol and the timeframe.
Compared with the previous bars, the breakout looks strong. Compared with the same hour on other days, it is an ordinary London open. Both readings are correct, but they answer different questions, and confusing them is one of the most frequent mistakes with intraday volume.
Checking volume in MetaTrader 5
- Volumes indicator: in its settings, choose Tick or Real. If you select Real on a forex pair or CFD and the histogram is empty, your broker does not provide real volume for that symbol.
- Data Window: it shows the exact tick volume of the bar under the cursor, which is useful for checking individual values.
- Strategy Tester: tests based on tick volume use the history of the broker you test with. Results can change on another broker's data.
Common distortions
- Daily rollover. Around the server's daily close, liquidity drops and spreads widen. Isolated ticks at that time can create misleading bars.
- News releases. A major release produces a burst of ticks that raises the average for the following bars.
- Weekend open and short sessions. The first bars of the week, and holidays, often show unusual activity.
Common mistakes
- Reading tick volume as contracts traded. It measures activity, not size.
- Comparing values between brokers or symbols. Only relative values can be compared.
- Ignoring the session. High volume at the London open is normal, not a signal in itself.
- Using volume on its own. Volume adds context to price; it does not replace price analysis.
Conclusions
- What tick volume measures: on forex and CFDs, MT5 shows tick volume, the number of price updates per bar. It reflects market activity and tends to move with exchange volume, but it does not show size or direction, and its absolute value depends on the broker.
- Reading it consistently: compare volume with its own average and take the time of day into account. Relative values make tick volume comparable across brokers and periods.
- Applying it in practice: check whether high volume is unusual for that hour, not only compared with the previous bars, and be aware of rollover, news and weekend opens. Real volume is only available on some symbols and brokers.
Tick volume does not reveal what large participants are doing, and it does not predict the market. It is a reference for judging whether a move has more or less activity than usual. Test any volume rule with your own data on demo or in the Strategy Tester, and combine it with disciplined risk management.
References
- Anna Coulling, A Complete Guide to Volume Price Analysis, 2013.
- MQL5 Reference: MqlRates structure, iVolumes, CopyTickVolume and CopyRealVolume (MetaTrader 5 documentation).
Disclaimer
This content is for informational and educational purposes only. It does not constitute financial advice or a recommendation to buy or sell any instrument. Tick volume describes past activity and is not a forecast. The charts are illustrative and do not represent real market data. Every asset and every broker is different, and the values and examples shown are for illustration only. Trading forex, CFDs and other leveraged products carries a high risk of loss. Every trading decision, and its outcome, is the sole responsibility of the reader. The author accepts no liability for any loss arising from the use of this information.