Does your signal beat random candles? Building an honest statistics table into an MQL5 indicator

Introduction
Almost every indicator on a trader's chart draws signals: an arrow where a fair value gap formed, a line where a swing high was broken, a box around a session. What it almost never shows is the one thing a trader needs before trusting it: how often did price actually do what the signal suggests, on this symbol and this timeframe, over the history that is already loaded on the chart?
The usual answer is a win rate, and a win rate alone is misleading. Markets drift. On a chart where gold rose for two years, almost any bullish arrow will look good, because price went up after most candles, with or without a signal. A bullish signal that is followed by a rise 58% of the time is worthless if a candle picked at random was followed by a rise 58% of the time too. The question is not "did price follow the signal?" but "did price follow the signal more often than it follows any candle, and by more than luck can explain?"
In this article we build a small, reusable module, SignalStats.mqh, that answers exactly this question inside an indicator, on every new bar, without repainting. It takes the list of signals an indicator finds, measures each one with a fixed rule, measures random earlier candles with the same rule, and draws a compact table on the chart with the difference and the range that luck alone could produce. As an example we plug it into StructureBreakStats.mq5, an indicator that marks market structure breaks (break of structure, BOS, and change of character, CHoCH), and look at what the table says on real gold and EURUSD charts.
Both files are attached. The module compiles for MetaTrader 5 and MetaTrader 4 from the same source; the example indicator is written for MetaTrader 5.
The question we ask every signal
A test needs a precise question that has a yes or no answer for every signal. We use a symmetric one, measured in the market's own volatility so that it means the same thing on gold H4 and EURUSD M15:
From the close of the candle that confirmed the signal, did price move N times ATR(14) in the signal's direction before it moved N times ATR(14) against it, within the next L candles?
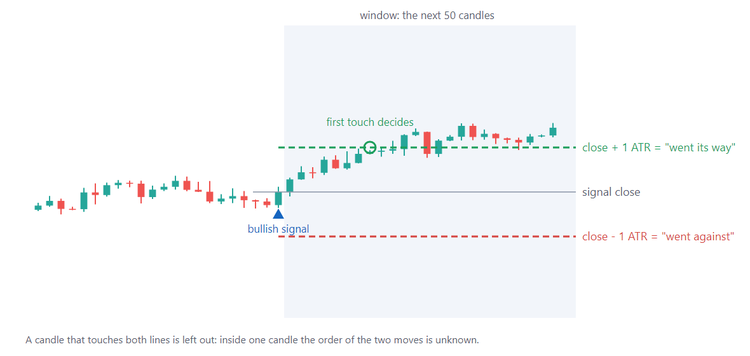
Figure 1. A bullish signal: two levels one ATR above and below its close; whichever is touched first decides
With N = 1 and L = 50 (the defaults) this is close to a trade with a one-ATR stop and a one-ATR target, held for at most 50 candles. Because the two distances are equal, a market with no memory would give about 50% in both directions, minus the effect of drift. Three details matter:
- Only closed candles. The signal is confirmed by a closed candle, and the outcome starts from that candle's close. Nothing that happened inside the signal candle after it was drawn is used.
- Ambiguous candles are left out. A candle can reach both levels. Inside one candle the order of the two moves is unknown from OHLC data, so instead of guessing (and guessing in the signal's favour is the classic way to fool yourself) we mark the case as undecided.
- Undecided cases are not counted. If neither level is reached within L candles, the signal does not enter the hit rate. The table still shows how many signals were found.
In code this is one small function. It returns 1 when price went the signal's way first, 0 when it went against it first and -1 when the case is undecided:
int CSignalStats::Outcome(const MqlRates &r[], const int n, const int start, const double dist, const bool bull) const
  {
   double p = r[start - 1].close;
   double good = bull ? p + dist : p - dist;
   double bad  = bull ? p - dist : p + dist;
   int end = MathMin(start + m_look, n);
   for(int k = start; k < end; k++)
     {
      bool g = bull ? r[k].high >= good : r[k].low <= good;
      bool b = bull ? r[k].low <= bad : r[k].high >= bad;
      if(g && b)
         return -1;
      if(g)
         return 1;
      if(b)
         return 0;
     }
   return -1;
  }
The rates array is filled with CopyRates and ordered oldest first (ArraySetAsSeries(false)), so start is the first candle after the signal, and n is the number of closed candles. The loop never reads the forming candle.
The baseline: random earlier candles
Now the important part. The hit rate of the signals means nothing on its own, so we ask the very same question from candles that are not signals. For each signal the module picks three random candles between 5 and 200 bars before it and asks: from this candle's close, did price move one ATR (that candle's own ATR) in the same direction as the signal before one ATR against it?
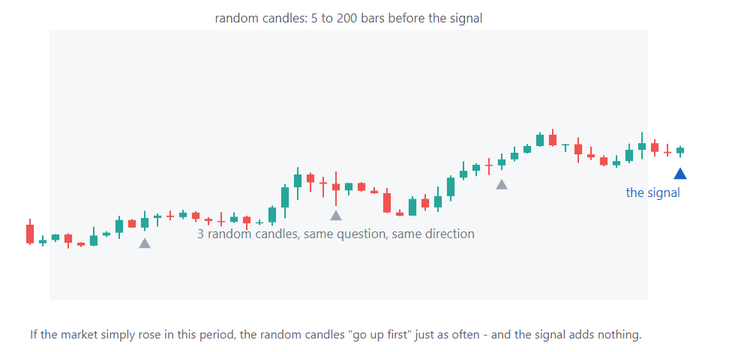
Figure 2. Each signal gets three random twins from the period just before it, tested in the same direction
Taking the random candles from the same period as the signal is deliberate. The baseline then contains the trend of that period, the volatility regime and the symbol's habits. If gold was in a strong uptrend, the random candles will "go up first" often too, and a bullish signal only gets credit for what it adds on top of that. Taking them from before the signal (and at least 5 bars before) keeps the twin's window from overlapping too much with the signal's own move.
The randomness needs care. A table that changes every time the chart is reloaded is useless, so the random numbers come from a fixed formula seeded by the signal. The obvious seed is the signal's bar index - and that is a trap we fell into ourselves. On a chart that is full (the number of bars has reached Max bars in chart), every new candle pushes the oldest one off the chart, so every index shifts by one. With an index seed, every signal gets new random twins on every new bar and the table wobbles by several points for no reason. The fix is to seed by the signal's time, which does not change:
void CSignalStats::Count(const MqlRates &r[], const double &atr[], const int n, const int from, const int to,
                         SStatsCount &c[]) const
  {
   int span = m_maxBack - m_minBack + 1;
   for(int s = from; s < to; s++)
     {
      int j = m_sig[s].bar, side = m_sig[s].bull ? 0 : 1;
      if(j < m_first || atr[j] <= 0)
         continue;
      c[side].signals++;
      int res = Outcome(r, n, j + 1, m_reach * atr[j], m_sig[s].bull);
      if(res >= 0)
        {
         c[side].decided++;
         c[side].hits += res;
        }
      //--- seeded by the signal's TIME, not its index: when old bars drop off a full chart,
      //--- every index shifts, but the time stays - so the random candles stay the same
      long t = (long)(r[j].time / 60);
      for(int f = 0; f < m_fakes; f++)
        {
         int m = j - m_minBack - (int)(Rand(t * 7 + f * 3 + side) * span);
         if(m < m_first || atr[m] <= 0)
            continue;
         int fr = Outcome(r, n, m + 1, m_reach * atr[m], m_sig[s].bull);
         if(fr >= 0)
           {
            c[side].rndDecided++;
            c[side].rndHits += fr;
           }
        }
     }
  }
The random function itself is a fixed linear congruential step applied twice. It is not a good random generator for simulations, but here we only need numbers that are spread evenly and are the same every time:
double CSignalStats::Rand(const long seed) const
  {
   long x = (seed * 1103515245 + 12345) & 0x7FFFFFFF;
   x = (x * 1103515245 + 12345) & 0x7FFFFFFF;
   return x / 2147483648.0;
  }
Is the difference real? The luck margin
After the counting we have two hit rates for each direction: the signals' rate p s out of n s decided signals, and the random candles' rate p r out of n r decided random candles. Their difference is what the signal adds. But even a signal that adds nothing will show a difference, because both rates are measured on a limited number of cases. How large can such a difference be by luck alone?
The standard answer is the two-proportion test. Under the assumption that the signal adds nothing, both groups share one true rate, estimated by pooling them: p = (hits s + hits r ) / (n s + n r ). The difference of the two rates then has a standard error of sqrt(p(1-p)(1/n s + 1/n r )), and in 95% of cases luck alone stays within 1.96 standard errors. That is the luck margin printed in the table:
void CSignalStats::Edge(const SStatsCount &c, double &diff, double &margin)
  {
   diff = 0;
   margin = 0;
   if(c.decided == 0 || c.rndDecided == 0)
      return;
   double ps = c.hits / (double)c.decided;
   double pr = c.rndHits / (double)c.rndDecided;
   double p  = (c.hits + c.rndHits) / (double)(c.decided + c.rndDecided);
   diff = ps - pr;
   margin = 1.96 * MathSqrt(p * (1 - p) * (1.0 / c.decided + 1.0 / c.rndDecided));
  }

bool CSignalStats::Beats(const SStatsCount &c, const int minCases)
  {
   double diff, margin;
   Edge(c, diff, margin);
   return c.decided >= minCases && diff > margin;
  }
A worked example from the gold H4 chart below: 176 decided bearish CHoCH signals hit 92 times (52.3%), and 523 decided random candles hit 226 times (43.2%). The pooled rate is 45.5%, the difference +9.1 points and the luck margin 8.5 points. The difference is larger than the margin, so the table colours it green.
Two practical rules follow from the formula. First, the margin shrinks only with the square root of the number of cases: four times more history halves it. On a chart with 2,000 candles a signal that fires 40 times has a margin of 15 points or more, which hides everything except huge effects. That is why the module requires at least 100 decided signals before it calls anything "beyond luck", and why it is worth raising Tools - Options - Charts - Max bars in chart before reading the table. MetaTrader 4 users should also scroll the chart back (Home key) so that the terminal loads more history.
Second, three random candles per signal make n r about three times n s , which shrinks the random side's share of the uncertainty; more twins add little, because the signal side then dominates the margin.
No repainting, and fast on every new bar
An indicator recalculates on every tick, and a statistics table that re-tests ten thousand signals on every tick would make the terminal crawl. Two observations keep it cheap. Signals are only confirmed on closed candles, so nothing has to be done inside a candle. And a signal whose whole window of L candles has closed can never change its outcome again. The module therefore keeps two sets of counters: m_fin for signals whose window is complete, counted once and never again, and m_all = m_fin plus the few recent signals that are still open, recounted on each new bar:
void CSignalStats::Update(const MqlRates &r[], const double &atr[], const int n)
  {
   int done = m_finUpTo, total = ArraySize(m_sig);
   while(done < total && m_sig[done].bar + 1 + m_look <= n)
      done++;
   if(done > m_finUpTo)
     {
      Count(r, atr, n, m_finUpTo, done, m_fin);
      m_finUpTo = done;
     }
   m_all[0] = m_fin[0];
   m_all[1] = m_fin[1];
   Count(r, atr, n, m_finUpTo, total, m_all);
  }
Repainting is avoided by the same discipline in the indicator. The example walks each new closed bar once, and on bar j it first checks whether that bar's close breaks a swing that was already known before bar j, and only then lets bar j confirm a new swing five bars back. A swing high is a bar whose high is above the five bars before it and not below the five bars after it, so it becomes known only when the fifth bar after it has closed. A break signal is therefore never based on information that did not exist when its candle closed:
void Breaks(const int n)
  {
   int S = InpSwing;
   for(int j = g_done; j < n; j++)
     {
      if(g_hiBar >= 0 && g_r[j].close > g_hiLvl)
        {
         Signal(j, true, g_trend == -1);
         g_trend = 1;
         g_hiBar = -1;
        }
      if(g_loBar >= 0 && g_r[j].close < g_loLvl)
        {
         Signal(j, false, g_trend == 1);
         g_trend = -1;
         g_loBar = -1;
        }
      int i = j - S;
      if(i < S)
         continue;
      bool sh = true, sl = true;
      for(int k = i - S; k < i && (sh || sl); k++)
        {
         if(g_r[k].high >= g_r[i].high) sh = false;
         if(g_r[k].low <= g_r[i].low)   sl = false;
        }
      for(int k = i + 1; k <= j && (sh || sl); k++)
        {
         if(g_r[k].high > g_r[i].high) sh = false;
         if(g_r[k].low < g_r[i].low)   sl = false;
        }
      if(sh) { g_hiBar = i; g_hiLvl = g_r[i].high; }
      if(sl) { g_loBar = i; g_loLvl = g_r[i].low; }
     }
   g_done = MathMax(g_done, n);
  }
A CHoCH is a break against the current structure (a close above the last swing high while the structure was bearish, or the opposite); a BOS is a break in the direction of the structure. The indicator passes the signals it wants to test to the module with a single call:
void Signal(const int j, const bool bull, const bool choch)
  {
   if(InpKind == KIND_ALL || (InpKind == KIND_CHOCH) == choch)
      g_stats.Add(j, bull);
  }
Everything else in OnCalculate is plumbing: copy the rates, extend the ATR array for the new bars, find the new breaks, update the statistics, redraw. When the first loaded candle changes (history was added at the start, or the chart switched symbol), everything is reset and calculated again from scratch:
int OnCalculate(const int rates_total, const int prev_calculated, const datetime &time[],
                const double &open[], const double &high[], const double &low[], const double &close[],
                const long &tick_volume[], const long &volume[], const int &spread[])
  {
   if(rates_total < FIRST + 2 * InpSwing + 2)
      return 0;
   ArraySetAsSeries(time, false);
   if(prev_calculated > 0 && time[rates_total - 1] == g_last)
      return rates_total;                     // signals use closed bars only: nothing new inside a bar
   ArraySetAsSeries(g_r, false);
   int got = CopyRates(_Symbol, _Period, 0, rates_total, g_r);
   if(got < FIRST + 2 * InpSwing + 2)
      return 0;
   int n = got - 1;                           // g_r[n] is still forming
   if(g_r[0].time != g_anchor || n < g_done)  // history changed: start again
      Reset(g_r[0].time);
   g_last = time[rates_total - 1];
   Atr(n);
   Breaks(n);
   g_stats.Update(g_r, g_atr, n);
   Arrows(n);
   Table();
   return rates_total;
  }
Drawing the table on the chart
The table is a grid of OBJ_LABEL objects on an OBJ_RECTANGLE_LABEL background. Two details make it look right on any screen. The column widths come from the real width of the text in the chosen font (TextSetFont + TextGetSize), so long labels never overlap the numbers. And the numbers are right-aligned under their header with ANCHOR_RIGHT_UPPER. The table is redrawn on CHARTEVENT_CHART_CHANGE, so it stays in its corner when the chart window is resized. Keep each line under 63 characters: longer label text is cut off by the terminal.
Colour is used for one thing only. A difference is green when it is positive, larger than the luck margin and based on at least 100 decided signals. Everything else stays white or grey. A table full of colours invites the eye to find patterns; a single colour that means "this passed the test" does not:
for(int s = 0; s < 2; s++)
  {
   SStatsCount c = st.Result(s);
   double diff, margin;
   CSignalStats::Edge(c, diff, margin);
   g[1][s + 1] = IntegerToString(c.signals);
   g[2][s + 1] = StatsPct(c.hits, c.decided);
   g[3][s + 1] = StatsPct(c.rndHits, c.rndDecided);
   g[4][s + 1] = (c.decided > 0 && c.rndDecided > 0) ? StringFormat("%+.1f", diff * 100) : "-";
   g[5][s + 1] = (c.decided > 0 && c.rndDecided > 0) ? StringFormat("%.1f", margin * 100) : "-";
   for(int r = 0; r < 6; r++)
      gc[r][s + 1] = (r == 0 || r == 3 || r == 5) ? gray : clrWhite;
   if(CSignalStats::Beats(c))
     {
      gc[4][s + 1] = clrLime;
      int k = ArraySize(notes);
      ArrayResize(notes, k + 1);
      ArrayResize(noteCol, k + 1);
      notes[k] = StringFormat("%s: beyond luck (luck alone: up to %.1f)", s == 0 ? "Bullish" : "Bearish", margin * 100);
      noteCol[k] = clrLime;
     }
  }
The same file compiles in MetaEditor for MetaTrader 4: MqlRates, CopyRates, ZeroMemory, TextGetSize and the object functions exist there too. One MQL4 detail: its compiler warns about "possible use of uninitialized variable" for a two-dimensional color array filled in loops. Declaring the grid as int and filling it with ArrayInitialize avoids the warning; the value is cast back to color where the label is drawn.
Results on real charts
We attached StructureBreakStats to live MetaTrader 5 charts (broker data, all history the terminal had loaded: XAUUSD H4 15,034 bars, XAUUSD H1 52,611 bars, EURUSD H1 94,606 bars) with the default settings: swings of five bars on each side, breaks on the close, 1 ATR in 50 candles. The table below is copied from the indicator's own table; "inside luck" means the difference is smaller than the luck margin.
| Chart | Signals | Side | Found | Signal went its way | Random candle | Difference | Luck alone | Verdict |
|---|---|---|---|---|---|---|---|---|
| XAUUSD H4 | CHoCH | bullish | 177 | 59% | 51% | +8.4 | 8.6 | inside luck |
| XAUUSD H4 | CHoCH | bearish | 178 | 52% | 43% | +9.1 | 8.5 | beyond luck |
| XAUUSD H1 | CHoCH | bullish | 607 | 55% | 50% | +4.3 | 4.7 | inside luck |
| XAUUSD H1 | CHoCH | bearish | 608 | 45% | 49% | -4.1 | 4.6 | inside luck |
| EURUSD H1 | CHoCH | bullish | 1108 | 48% | 49% | -1.0 | 3.4 | inside luck |
| EURUSD H1 | CHoCH | bearish | 1109 | 50% | 50% | +0.1 | 3.4 | inside luck |
| XAUUSD H4 | every break | bullish | 385 | 58% | 51% | +7.2 | 5.8 | beyond luck |
| XAUUSD H4 | every break | bearish | 354 | 52% | 46% | +6.5 | 6.1 | beyond luck |
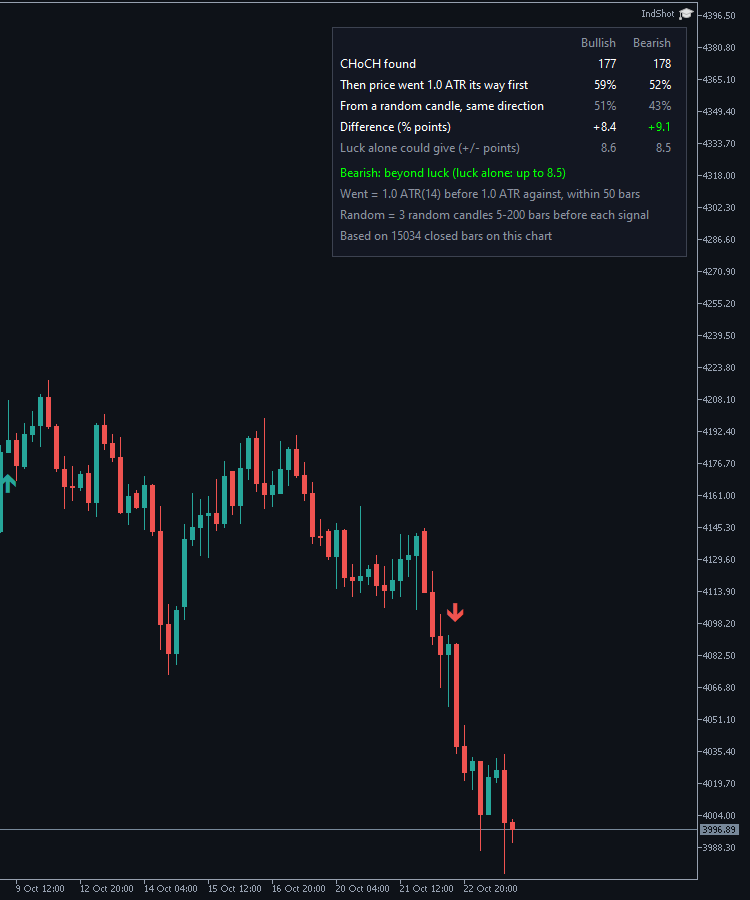
Figure 3. CHoCH signals and the statistics table on XAUUSD H4
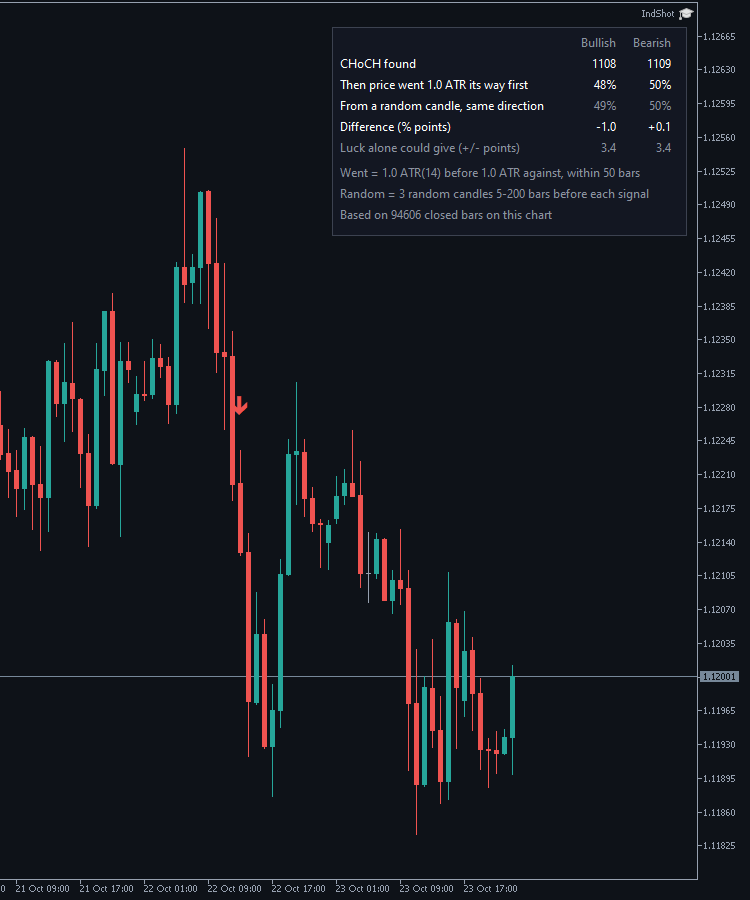
Figure 4. The same indicator on EURUSD H1
The gold H4 row is the clearest illustration of why the baseline matters. Bearish CHoCH signals went one ATR down before one ATR up in 52% of the decided cases - on its own that looks like a coin flip, and a trader judging by the hit rate would drop the signal. But gold rose strongly over these years, and random candles in the same (bearish) direction went down first only 43% of the time. Against that baseline the bearish CHoCH added +9.1 points, more than the 8.5 points luck could explain.
The bullish side shows the opposite trap: 59% looks attractive, yet random candles already reached 51%, and the +8.4 points stay just inside the 8.6-point margin.
On H1 the same rules produce many more signals (607 bullish CHoCH), so the margin is much narrower, and neither side passes. EURUSD H1, with 1,108 signals per side, sits almost exactly on its random baseline in both directions: hit rates around 50% and random candles around 50%. Counting every break on gold H4 (BOS and CHoCH together) roughly doubles the number of signals; both sides then pass, with differences of +7.2 and +6.5 points. Without the random column none of this would be visible: the raw hit rates of 45-59% say very little on their own.
Three things to keep in mind when reading such tables, ours or anybody else's:
- Many tables, some green by chance. A 95% margin means that one test in twenty passes by luck. Test ten charts in two directions and one green cell is exactly what luck predicts. A result becomes believable when it repeats: on the neighbouring timeframe, on the other half of the history, on a related symbol.
- Beyond luck is not the same as profitable. A few points above the random candles is a statistical statement about direction. Spread, commission, swap and the exact entry and exit rules decide whether it survives as a trading rule. The table measures the idea, not a strategy.
- Settings are part of the result. Changing the swing size, the distance or the window and keeping the best combination is fitting, not finding. Decide the settings first, then read the table.
Using the module in your own indicator
SignalStats.mqh does not know what a signal is; it only needs the bar index and the direction. To add the table to an indicator of your own:
- Include the file and declare one CSignalStats object; call Init(reach, look) in OnInit.
- Keep a MqlRates array (oldest first) and an ATR array of the same length for the closed bars.
- Whenever your logic confirms a signal on a closed bar j, call Add(j, bullish). Signals must be added in time order, once each.
- After processing the new bars, call Update(rates, atr, closedBars) and DrawStatsTable(stats, prefix, name, reach, look, closedBars, corner).
- On a history reset, call Reset() and process all bars again.
The module tests every signal it is given. If an indicator shows only the last few signals, the statistics should still be fed with all of them; the table is only as honest as the list it receives.
Conclusion
An indicator that prints its own track record against random candles changes how it is used. Instead of a win rate that mostly reflects the trend, the trader sees the difference the signal makes on the chart in front of them, with the range that luck alone could produce. The checklist we arrived at:
- Ask one yes-or-no question of every signal, measured in ATR so that it travels across symbols and timeframes
- Use only what was known at the signal candle's close, and leave out candles whose outcome is ambiguous
- Compare with random earlier candles in the same direction, so that the trend of the period is in the baseline
- Seed the random choice by candle time, not by bar index, or the table will change when old bars drop off
- Report the luck margin next to the difference, and require enough cases before calling anything real
- Count finished cases once and keep them; recount only the open ones
- Use colour for one meaning only: passed the test
- Remember that one green cell in twenty is luck, and that a statistical edge is not yet a trading strategy
Ready-made version. The free ICT Market Structure Honest Stats indicator (MT4 version) draws the same breaks with HH / HL / LH / LL labels, higher-timeframe structure and alerts, with this table built in. ICT Pro All in One adds eight more ICT ideas (order blocks, fair value gaps, premium / discount and OTE, liquidity sweeps, killzones, SMT) into one score with a multi-symbol scanner - try it free with the Free Demo in the Strategy Tester.
Questions or a signal you want tested this way? Write in the comments.
Attached files (source code)
| File | Description |
|---|---|
| SignalStats.mqh | The module: outcome test, random baseline seeded by time, luck margin, incremental update, chart table (MQL5 and MQL4) |
| StructureBreakStats.mq5 | Example indicator: market structure breaks (BOS / CHoCH) with the statistics table |