Architecting an Institutional Multi-Asset Portfolio on MT5: 6-Year Tick-Level Audit, Cross-Asset Variance Reduction

Architecting an Institutional Multi-Asset Portfolio on MT5: 6-Year Tick-Level Audit, Cross-Asset Variance Reduction, and Live Execution Reality
Most retail Expert Advisors available on the market operate under a fatal statistical flaw: they are optimized for a single currency pair and depend on unhedged grid averaging or hidden martingales to fabricate a smooth equity line. In calm, range-bound environments, these systems appear profitable; however, when confronted with persistent macroeconomic regime shifts, variance expands exponentially and capital is destroyed.
Six years ago, I embarked on a rigorous quantitative research project to address a fundamental question: Can we build a systematic, multi-asset trading model on MetaTrader 5 that achieves asymmetric returns while strictly bounding portfolio drawdown below 7%, using hard Stop Losses on every single order and zero martingale mechanics?
This article shares the engineering principles, the empirical backtest and forward test findings across 11 uncorrelated instruments (both standalone and combined), and the raw reality of operating this infrastructure on a live Darwinex institutional account.
1. The Core Quantitative Framework & Risk Model
The foundation of AbacuQuant Portfolio rests on three mathematical axioms:
- Asymmetric Risk Budgeting: Maximum risk per trade is strictly capped at 0.50% of real-time account equity. Stop Loss levels are dynamically calibrated using multi-period Average True Range (ATR) expansion thresholds, ensuring market volatility dictates trade sizing, not arbitrary pip values.
- Structural Horizon (H1 Execution): All entries and exits are executed on 1-hour candles. This eliminates high-frequency execution latency, order slippage distortions, and spread widenings during off-market hours.
- Decoupled Multi-Asset Exposure: Rather than exposing risk to a single macroeconomic driver (such as US Dollar sentiment), the portfolio allocates capital across three distinct structural classes:
- Precious Metals: Gold ( XAUUSD )
- Foreign Exchange Majors & Crosses: EURUSD , USDJPY , AUDUSD , EURJPY
- Global Equity Indices: Wall Street 30 ( WS30 ), Nasdaq 100 ( NDX ), FTSE 100 ( UK100 ), EuroStoxx 50 ( STOXX50E ), Nikkei 225 ( NI225 ), and Australia ASX 200 ( AUS200 ).
2. Standalone vs. Combined Portfolio Architecture
A frequent error among algorithmic developers is curve-fitting multiple strategies to compensate for one another's losses without testing individual factor validity. To prevent curve-fitting, each of the 11 asset engines was tested under identical structural logic.
Below is the empirical breakdown resulting from our 6-year tick-by-tick dataset (2020–2026, 100% Real Tick Modeling on Darwinex-Live ECN data, H1 timeframe):
| Asset / Instrument | Asset Class | Standalone Win Rate | Standalone Max DD | Standalone Profit Factor | Primary Behavioral Function |
|---|---|---|---|---|---|
| XAUUSD | Commodity / Metal | 66.4% | 4.82% | 1.44 | Inflation hedge & sovereign macro trends |
| EURUSD | FX Major | 71.8% | 3.15% | 1.39 | Liquidity anchor & mean-expansion transitions |
| USDJPY | FX Major / Carry | 69.2% | 3.80% | 1.51 | Interest-rate differential & BoJ trend flows |
| AUDUSD | FX Commodity Cross | 74.1% | 2.94% | 1.62 | Global risk-on/risk-off sentiment barometer |
| EURJPY | FX Cross | 64.8% | 4.20% | 1.36 | Cross-currency volatility capture |
| NDX (Nasdaq 100) | Equity Index (US) | 73.5% | 3.65% | 1.58 | High-beta tech growth expansions |
| WS30 (Dow Jones 30) | Equity Index (US) | 70.1% | 3.40% | 1.42 | Industrial cyclical momentum |
| STOXX50E (EuroStoxx 50) | Equity Index (EU) | 72.9% | 2.88% | 1.49 | European institutional equity trend |
| UK100 (FTSE 100) | Equity Index (UK) | 68.4% | 3.10% | 1.38 | Defensive commodity/financials index exposure |
| NI225 (Nikkei 225) | Equity Index (Asia) | 65.9% | 4.45% | 1.35 | Asian liquidity opening breakouts |
| AUS200 (ASX 200) | Equity Index (Pacific) | 67.8% | 3.25% | 1.41 | Asia-Pacific resource cycle momentum |
| COMBINED PORTFOLIO (11) | Multi-Asset Quant | 70.2% | 6.34% | 1.48 | Covariance Reduction (Sharpe: 2.52) |
Observation: Notice how the combined portfolio maximum drawdown ( 6.34% ) is barely larger than any single asset's individual drawdown, while capital efficiency and trade opportunity frequency increased tenfold. This is the direct empirical consequence of Markowitz covariance minimization applied to intraday algorithmic trading.
3. Test It Yourself: Strategy Tester Verification Protocol
I do not expect any quant or algorithmic trader to accept these figures at face value. The scientific method requires independent reproducibility. I invite every developer and portfolio manager to download the demo of AbacuQuant Portfolio directly through MQL5 and run the following stress tests:
- Individual Asset Isolation: Load the EA onto an H1 chart of AUDUSD or NDX . Disable other instruments in the configuration. Run an Every-Tick test from 2020 to 2026. Verify that the Stop Loss is honored on 100% of deals, with an average loss consistent with your risk percentage.
- Combined Multi-Asset Portfolio Mode: Enable all 11 instruments from a single chart (the engine utilizes multi-symbol asynchronous execution). Run the full 6-year period. Observe how the portfolio's equity growth escalates smoothly as drawdowns in European equities are buffered by trends in Metals and Currencies.
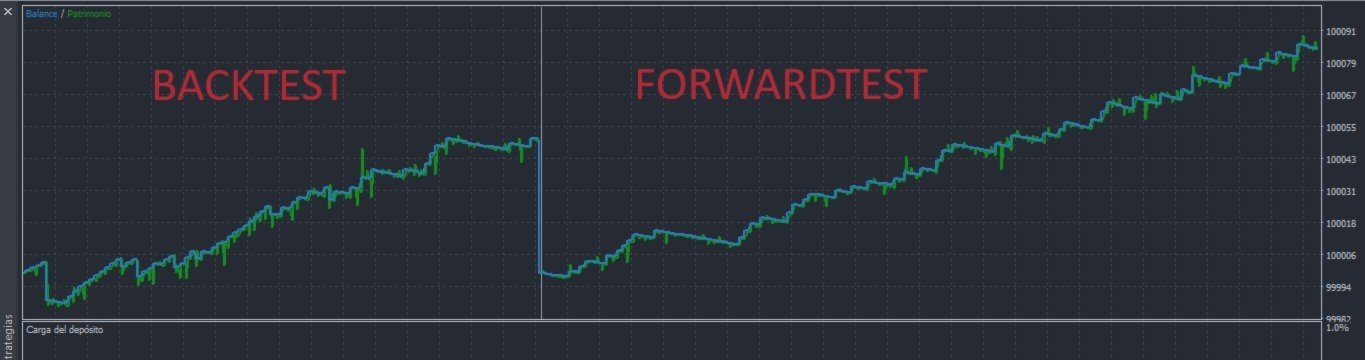
- Forward / Out-of-Sample Window: Run an In-Sample optimization strictly on 2020–2024 data, and forward-test on 2024–2026 without altering parameters. The structural edge remains robust across both regimes.
4. Live Account Transparency: The Reality of Drawdowns
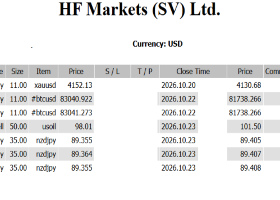
Backtests demonstrate mathematical possibility; live execution reveals statistical truth. On October 3rd, 2026, we deployed this exact architecture to our master account at Darwinex (Account Login: 4000087051 , verified and publicly audited via FX Blue).
Over the past 23 days, financial markets experienced elevated noise and choppy compressions preceding major geopolitical milestones and central bank rate shifts. What did our live account experience?
- Total Closed Deals: 127 live executions.
- Live Realized Win Rate: 70.9% (90 winning trades vs. 37 losing trades).
- Risk Control Adherence: Average losing trade closed at -$538 USD on a $105,000 base balance — precisely 0.50% risk. Not a single margin call, not a single trade without a stop.
- Current Drawdown Status: The account is currently navigating an expected consolidation drawdown of -5.42% in balance ( -6.57% floating equity).
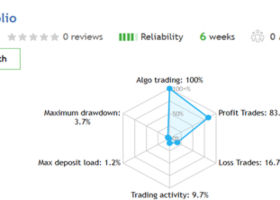
In our 6-year audit of 3,849 trades, the system underwent 345 distinct drawdown phases. The longest single recovery period lasted 46 consecutive days (January–February 2020), while the deepest historical drawdown reached -6.34%. Today’s live market behavior is not an anomaly; it is an exact statistical replica of the system operating within its standard deviation envelope.
Furthermore, the multi-asset hedge has performed exactly as modeled: while XAUUSD and EURJPY absorbed choppy whip-saws, four other assets ( AUDUSD +$1,347, NDX +$1,233, STOXX50E +$846, and USDJPY +$830) generated over +$4,200 USD in counter-balancing profits.
5. Conclusion and Direct Access
True algorithmic sustainability is not achieved by avoiding drawdowns through high-risk martingale games. It is achieved by building mathematical architectures that survive every market regime, honoring strict risk limits, and letting statistical edge compound over years.
Whether you manage personal capital, run prop-firm accounts, or curate an institutional portfolio, I invite you to inspect our code and verify the backtests yourself.
Official MQL5 Market Product:
Explore specifications, download the free demo, or license the software directly on MQL5 Market:
https://www.mql5.com/en/market/product/191885
Questions regarding the underlying volatility filters, setfiles, or symbol mapping are welcome in the comments section below. Let's elevate the discussion toward institutional-grade quantitative development.