
Every signal list has already been filtered: survivorship in plain numbers

Open any list of trading signals sorted by return and you are looking at the result of a filter you never saw. Nobody applied it on purpose. Failure did. The accounts that blew up, stopped trading or were closed are not on the list. The ones on it are the ones still standing.
That sounds obvious, and it still changes every number you read off a ranking. Here is how much, in plain numbers.
Twenty start, four are listed
Take a simple field. The numbers are made up to keep the arithmetic visible, but the shape is the ordinary one. Twenty signals start on the same day. Sixteen of them hit minus 100% at some point and disappear. Four last the whole window and finish at +40%, +25%, +18% and +12%.
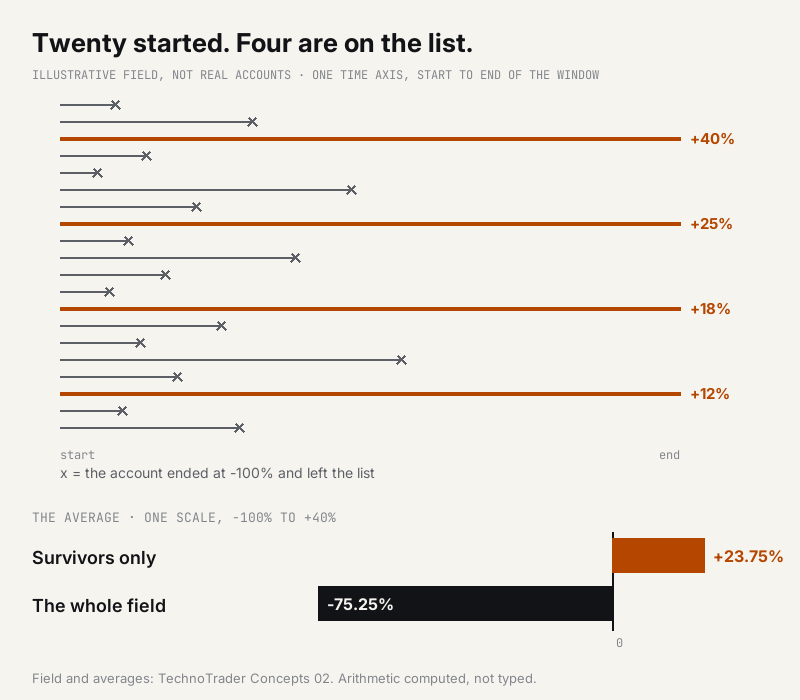
A list built at the end of the window shows four signals. Their average is +23.75%. The average of the twenty that actually started is -75.25%. Same field, same window, same rules. The list did not lie about any one signal. It simply left out sixteen.
The gap between those two averages is the price of reading only the survivors. A ranking tells you who lasted. It does not tell you what was likely when they started, and that is the only question that matters to someone choosing today.
Most records do not end with a bang
Very few signals end in a margin call. Most end quietly. The provider stops posting. The account is closed. The price goes up and the subscribers leave. Each of those takes a record off the list, and the records that leave are mostly the ones that were going badly. Nobody needs to hide anything for the list to look better than the field did.
Our own list is filtered too
This applies to us, so here it is. Our MQL5 profile shows 4 signals this morning. Since late August we have closed three: Techno Foundation, Techno Composite and Techno SteadyFlow. Each closure went into our monthly review with its final numbers and the reason. But a reader who arrives today and looks only at the profile sees the four that are left, not the three that are gone.
The same happened on the robot side last week. One of our Expert Advisors came off the Market list after its live account fell behind its own test. The profile now says 11 products. A year from now, anyone judging our line by what is on it will be judging the survivors, unless we keep saying what was removed and why.
A two-minute check before you copy
1. Sort by age, not by return. On any signal list, the oldest accounts are the ones that have already lived through more than one kind of market. A high return over four months tells you very little next to a modest one over three years.
2. Count how many are old. See how many signals on the list are older than two years. That share is roughly the survival rate you are buying into, and it is usually smaller than the list makes it feel.
3. Ask the provider what they closed. A provider with a long history and nothing ever closed is either very good or very quiet. One who names what was closed, with numbers, has given you the part of the field the list leaves out.
The same filter inside one product
Survivorship is not only a property of lists. A backtest you are shown is often the survivor of many settings that were tried and dropped. The question is the same: how many started, and what happened to the rest? A seller who can answer it has measured something. A seller who cannot has shown you the winner of a contest you were not told about.
A ranking of survivors tells you who lasted, not what is likely. Read it with the field in mind, ours included: our MQL5 profile, signals and products as they stand today. Past results, ours included, do not predict future ones.