

EA Risk X-Ray — Northline Algo · product page · real MT5 demo video
Contents
- Overview
- Installation and first audit
- Auditing a Strategy Tester report (before you buy an EA)
- Reading the panel
- How the verdict is decided
- The HTML report and the CSV file
- Open risk on a live account
- Input parameters
- Messages and troubleshooting
- Strategy Tester and demo
- Honest limits and support
1. Overview
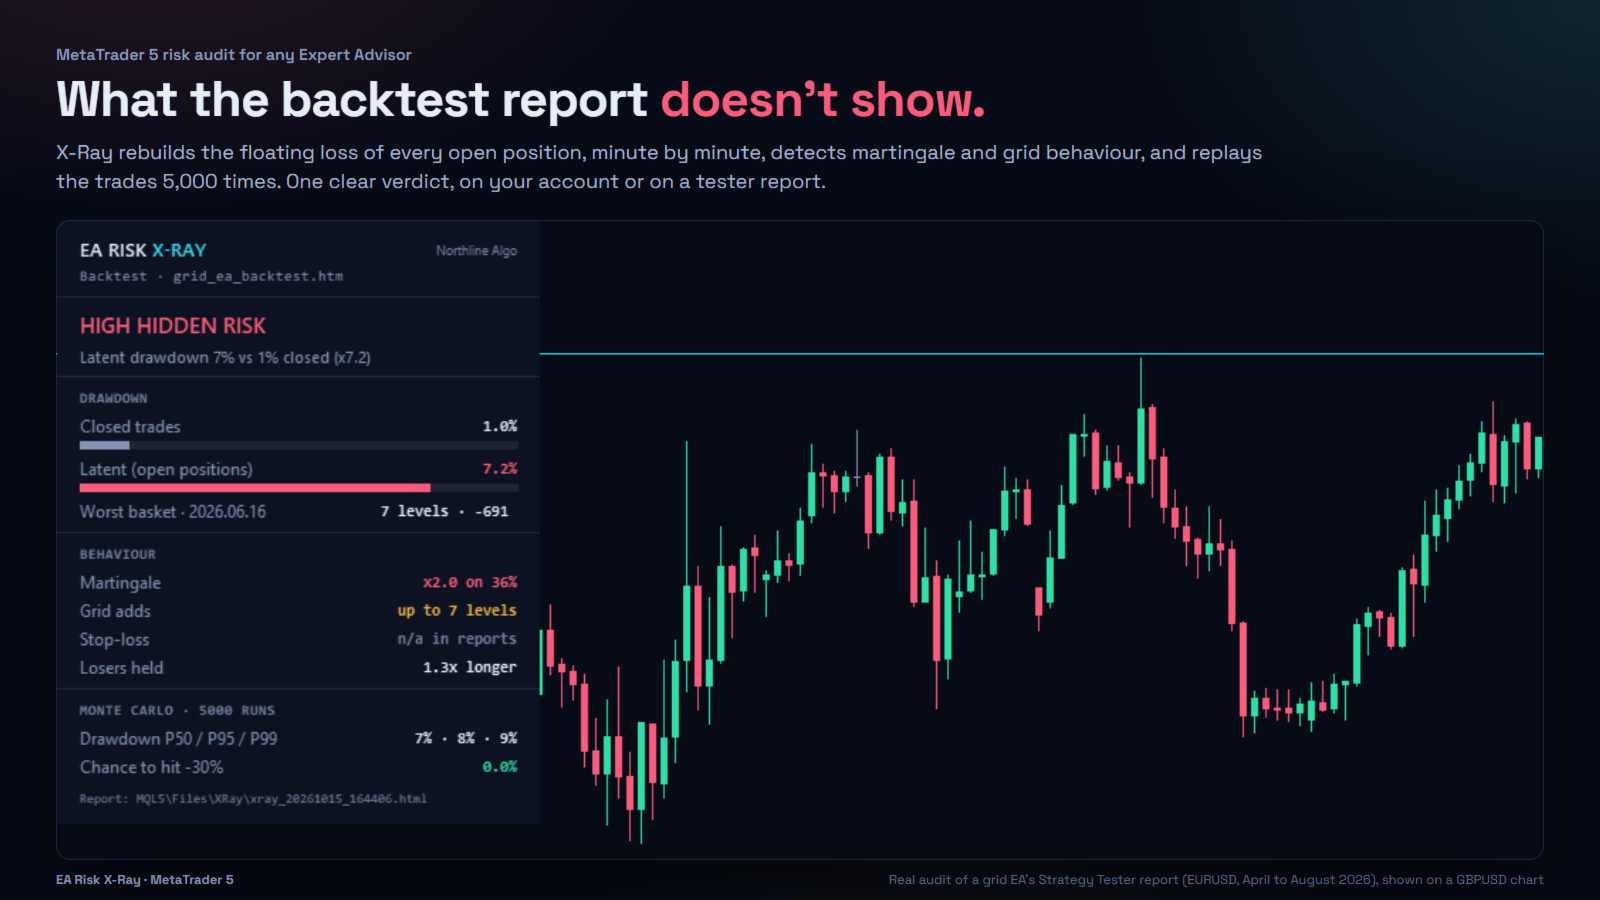
Most drawdown figures are computed when trades close: the Strategy Tester report, most account monitors, most statistics tools. A grid or martingale EA can hold a deep floating loss for weeks, close the whole basket in profit, and show a smooth balance curve. The risk was real; it never appeared in the numbers.
EA Risk X-Ray measures what the closed trades hide:
- it groups the positions an EA opened together into baskets (a grid and its levels form one basket);
- for every basket it replays the M1 price history and records the worst floating loss reached while the positions were open: the latent drawdown;
- it detects martingale and grid behaviour, trades without a stop-loss, and losers held longer than winners;
- it replays the baskets 5,000 times in a random order (Monte Carlo) to show the drawdown you could have had with the same trades;
- on a live account, it measures how far the open positions are from the margin call and from your loss threshold.
You get one verdict per EA (low, moderate or high hidden risk) with its reason in numbers, a panel on the chart, an HTML report and a CSV file.
The tool gives no trading signal and makes no forecast. It measures how an EA behaved.
2. Installation and first audit
- After purchase or rental, EA Risk X-Ray appears in Navigator → Expert Advisors → Market.
- Open any chart. The symbol of the chart does not matter: X-Ray audits the account or the report, not the chart.
- Drag EA Risk X-Ray onto the chart. Keep Source = Account history and Magic number = all, then press OK.
- After a few seconds the panel shows one line per EA found in the account (one per magic number, the riskiest first) and the details of the riskiest one.
To audit one EA only, type its magic number instead of all . Manual trades have magic number 0 .
On a live chart X-Ray never opens, modifies or closes a position. Algo Trading does not need to be enabled.
3. Auditing a Strategy Tester report (before you buy an EA)
This is how you audit the free demo of an EA before you pay for it:
- Run a backtest of the EA in the Strategy Tester, on the symbol and period you want.
- In the Backtest tab, right-click → Report → HTML (Internet Explorer) and save the file.
- Open File → Open Data Folder, go to MQL5\Files , create a folder named XRay if it does not exist, and copy the report into it.
- Attach X-Ray to any chart with Source = Strategy Tester report and Report file = the file name (for example report.htm ).
The report can come from MT5 in any language: the deals table is recognised by its column names or, failing that, by the fixed order of its columns.
If the backtest was run on symbols that your broker names differently (for example EURUSD.r ), fill Symbol map: EURUSD=EURUSD.r;XAUUSD=GOLD . X-Ray needs the M1 history of those symbols to rebuild the latent drawdown.
Tip: stop the backtest at different dates. A grid EA often looks clean right before a bad month; the latent drawdown shows how close it already was.
4. Reading the panel
- Header: the source (account or report file), the magic numbers and the period.
- EA list (account, magic = all): one line per magic number with its symbols and its verdict. The details below are for the first line.
- Verdict: LOW, MODERATE or HIGH HIDDEN RISK, with the reason in numbers.
- Drawdown:
- Closed trades: the drawdown of the balance, what most reports show;
- Latent (open positions): the drawdown with the floating loss of open positions, minute by minute;
- Worst basket: its date, its number of levels and its worst floating loss.
- Behaviour: martingale (median lot ratio and share of baskets), grid adds (maximum number of levels), stop-loss (share of trades opened without one; not available in tester reports), losers held (how much longer losing positions stay open than winning ones).
- Monte Carlo · 5000 runs: the drawdown reached by 50%, 95% and 99% of the runs, and the share of runs that cross your loss threshold.
- Open risk (live account, when positions are open): see section 7.
- Report: the name of the HTML report.
5. How the verdict is decided
The verdict uses the first rule that applies:
| Verdict | Rule |
|---|---|
| HIGH | latent drawdown ≥ 3 × the closed drawdown, and ≥ 5% |
| HIGH | 10% or more of the Monte Carlo runs cross your loss threshold |
| HIGH | martingale on 20% or more of the baskets |
| MODERATE | latent drawdown ≥ 1.5 × the closed drawdown, and ≥ 3% |
| MODERATE | 2% or more of the Monte Carlo runs cross your loss threshold |
| MODERATE | the EA adds grid levels |
| LOW | none of the above |
With fewer than 30 baskets the Monte Carlo is flagged "(weak sample)". When the M1 history of a basket cannot be loaded, that basket is counted with its closed result only (its floating loss is unknown), and the verdict says "(estimated: price history missing for N% of baskets)".
6. The HTML report and the CSV file
Each audit saves two files in File → Open Data Folder → MQL5 → Files → XRay:
- an HTML report that opens in any browser, on a computer or a phone: verdict, key figures, balance against latent equity, Monte Carlo distribution, the 10 deepest baskets and the rules that triggered;
- a CSV file with one line per basket (open and close time, symbol, side, levels, worst floating loss, result), for your own analysis.
File names contain the date and time, so successive audits never overwrite each other. On a live account, the latest report is also saved as xray_latest.html .
7. Open risk on a live account
When the audited EA has open positions, the panel adds an Open risk section for its most exposed basket:
- Margin call in: how far the price can move against the basket before the margin call level of your broker;
- -30% threshold in: how far before the equity falls by your loss threshold;
- If the EA adds N more levels: the same distance if the EA keeps averaging down the way it did in its history (its usual grid step and lot multiplier).
Distances are shown in points and in ATR(14) of the chart. A distance larger than the price itself is shown as "beyond a 100% move". The open risk is refreshed every minute, and the whole analysis after new trades (at most every 5 minutes).
8. Input parameters
| Input | Default | Description |
|---|---|---|
| Source | Account history | Account history, or Strategy Tester report (HTML) |
| Magic number | all | all = one line per EA; or one magic number ( 0 = manual trades) |
| Symbol filter | empty | Only this symbol (empty = all) |
| Period: last N days | 180 | 0 = whole history (account source) |
| Report file | report.htm | File name in MQL5\Files\XRay (tester report source) |
| Symbol map | empty | Broker names of the report symbols, e.g. EURUSD=EURUSD.r;XAUUSD=GOLD |
| Loss threshold for Monte Carlo (%) | 30 | Used by the Monte Carlo and the open risk |
| Martingale: lot increase ratio | 1.3 | A lot at least this much larger than the previous one counts as martingale |
| Spread in points | -1 | Used for the latent drawdown; -1 = average from history |
| Panel X / Y position | 12 / 24 | Position of the panel on the chart |
9. Messages and troubleshooting
- "Report file not found in MQL5\Files: …": the report must be inside MQL5\Files\XRay (File → Open Data Folder) and the name typed exactly, with its extension.
- "Deals table not found: export the tester report as HTML …": the file is not an MT5 tester report in HTML. Save it again with right-click → Report → HTML.
- "No trades found for magic …" / "No trades found in the last N days …": check the magic number, or set the period to 0 (whole history). On a live account X-Ray checks again every minute, so it starts as soon as the EA trades.
- "(estimated: price history missing for N% of baskets)": MT5 could not load the M1 history of some symbols. Open a chart of those symbols once, or use the Symbol map for a report from another broker.
- "Symbol not available at this broker: …" (in the Experts log): fill the Symbol map.
- The panel says "Loading M1 price history": the first audit of a long history downloads M1 bars from your broker; later audits are fast.
10. Strategy Tester and demo
The Strategy Tester has no account history to audit. In the tester (and therefore in the free demo of the Market), X-Ray opens its own small demonstration grid on the tested symbol (0.01 lot, up to 4 levels, magic number 909090) and audits it live on the panel. Run it in visual mode to watch the panel fill in.
This demo only shows how the panel works. To audit an EA you are considering, use its own backtest report (section 3) with the full version, or rent it for one month.
11. Honest limits and support
- The results describe the past on the audited period. A low verdict means the hidden risk measured on that history was low; it is not a promise about the future.
- The latent drawdown is computed with M1 bars and an average spread: the exact tick-by-tick worst point can be slightly deeper.
- Deposits and withdrawals are not part of the drawdown.
- The Monte Carlo replays baskets one after another; baskets that overlapped in reality are not stacked, so a run can show less than the historical latent drawdown.
Questions, a report that does not load, a message that is not clear: write to me through my MQL5 profile. I answer every message.


