Trading Robots Without Magic: A Probabilistic Approach, Risk, and Uncertainty

Author: Mansur Gilmullin | MQL5 Author Profile | Fuzzy Technologies
Our first experiments with trading automation began back in 2015. The idea seemed straightforward: if price movements could be modeled mathematically, part of the decision-making process could be automated—collecting data, analyzing it, generating forecasts, and acting according to explicitly defined rules.
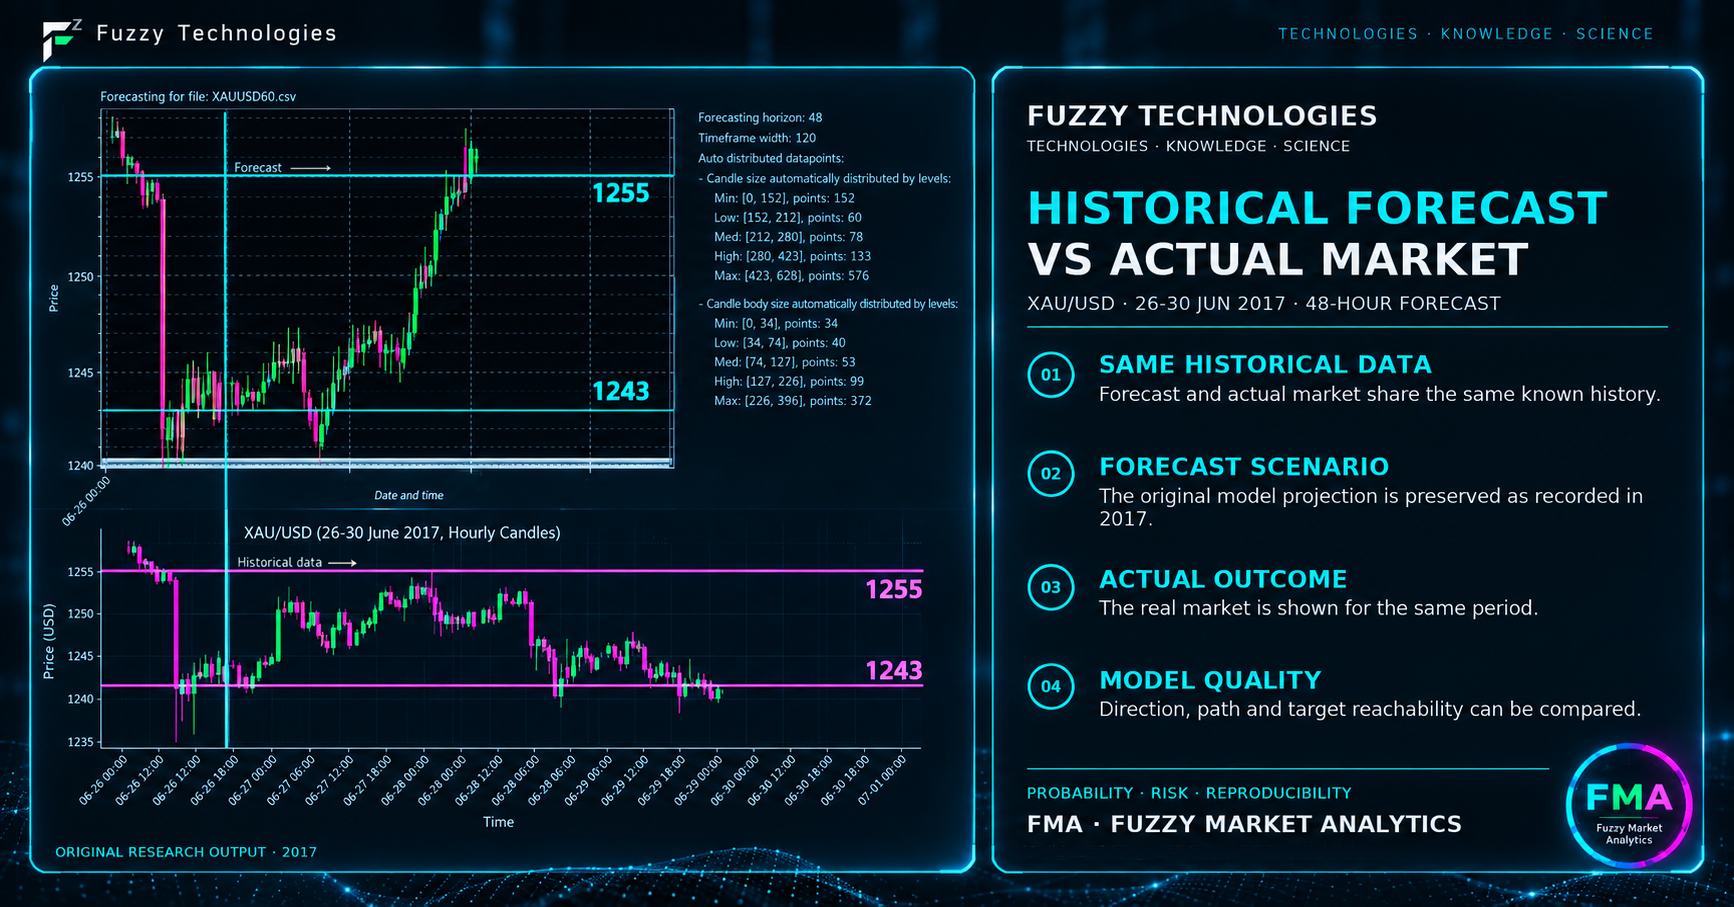
In 2017, we conducted one of our early experiments forecasting gold price movement 48 hours ahead. The slope, levels, and overall shape of the forecast turned out to be quite similar to the subsequent real price movement. The result looked promising. It created the impression that the main problem was almost solved: the only remaining step was to turn a successful forecast into a trading algorithm.
However, this was exactly where the fundamental problem emerged. Even getting the direction right does not tell us how far the price may move, how long the move may take, whether the scenario can withstand a temporary pullback, or how to respond when new data no longer support the original hypothesis.
A beautiful forecast and a working trading system are not the same thing.
For the background to these experiments, see “Through Thorns to the Stars: How We Developed a Trading Algorithm”
Can Price Movement Be Predicted Exactly?
In mathematics, there are many problems where initial data uniquely determine the result. If the sides of a rectangle are known, its area can be calculated. If an object moves at a constant speed for a known amount of time, the distance traveled can be calculated.
Financial markets are more complicated. The observed market price is formed through the interaction of many participants who have different information and make decisions at different times. A chart reflects completed transactions, but it does not fully reveal future order flow, changes in liquidity, new economic data, or the actions of other trading systems.
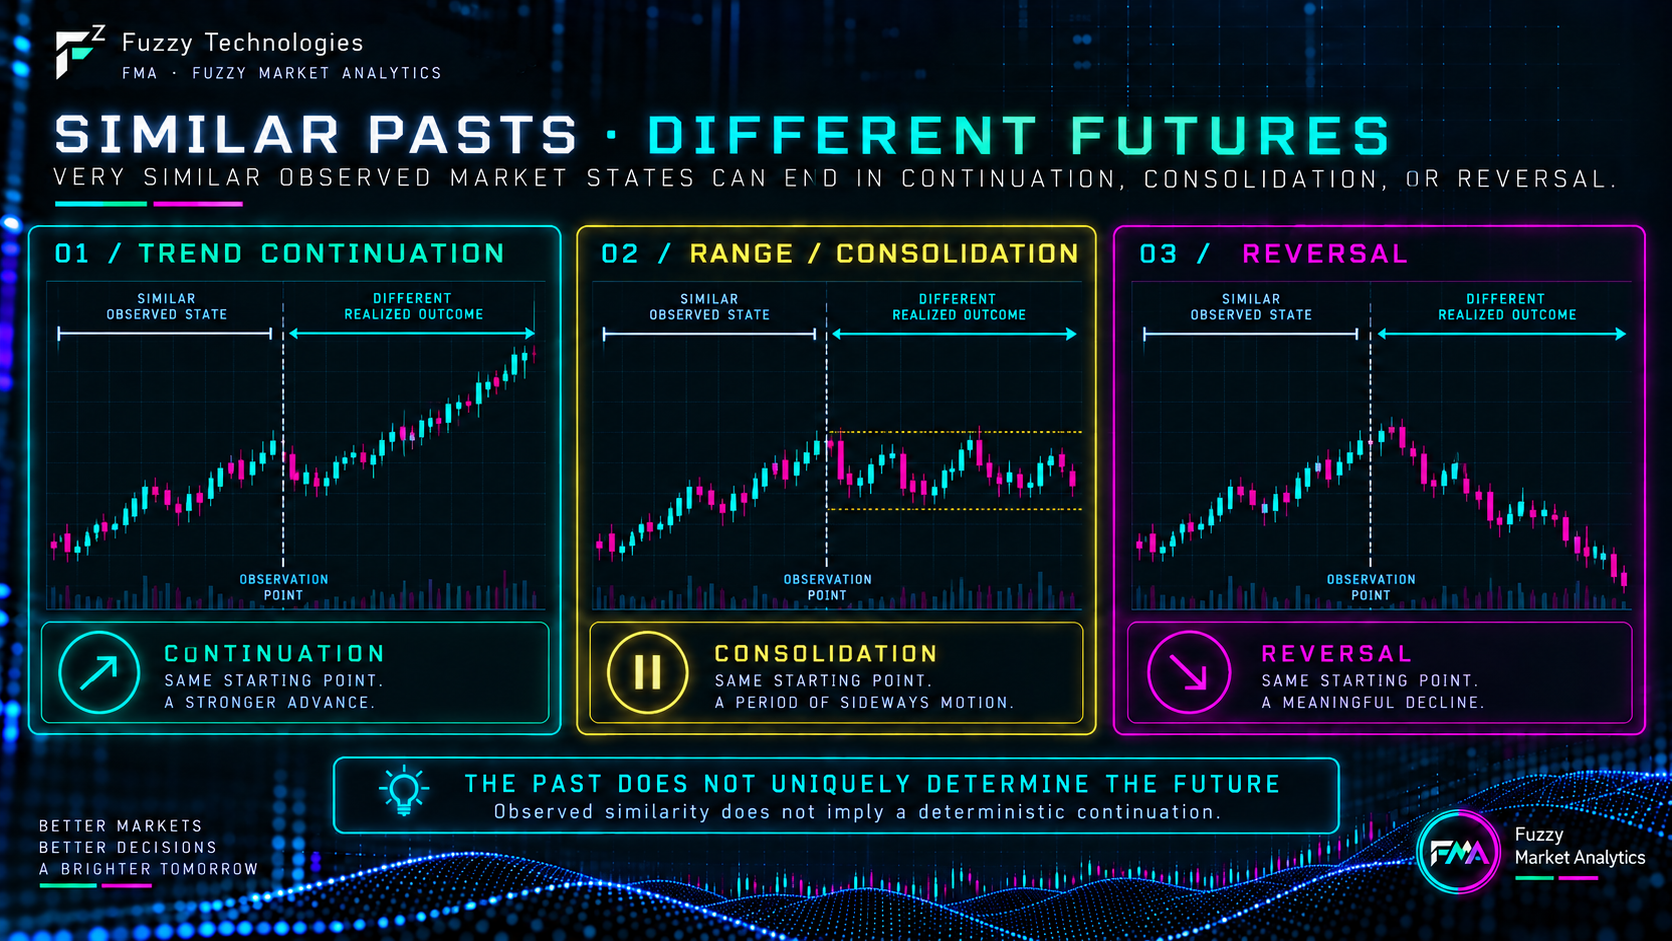
Therefore, very similar segments of a price series can have different continuations. After a rapid movement, the market may continue a trend, move into a range, or reverse. The fact that a certain historical state often led to a specific outcome does not make the next outcome deterministic.
Price series also contain noise, anomalous observations, outliers, and potential errors in price quotes. A single anomalous observation can affect estimates of average price changes, volatility, and other statistical measures. Therefore, the quality of input data is part of the model itself, not a technical detail that can be checked sometime later.
For a trading system, asking “Where exactly will the price go?” is too restrictive. The more useful questions are which scenarios are currently plausible, how well the available data support them, and whether there is enough evidence to act.
From Direction to Scenario Probabilities
For practical trading, it is not enough to say that the price will probably rise or fall. It is important to define the scenario itself: where the target level is located, what time horizon is being considered, and how well the observed market state corresponds to such a movement.
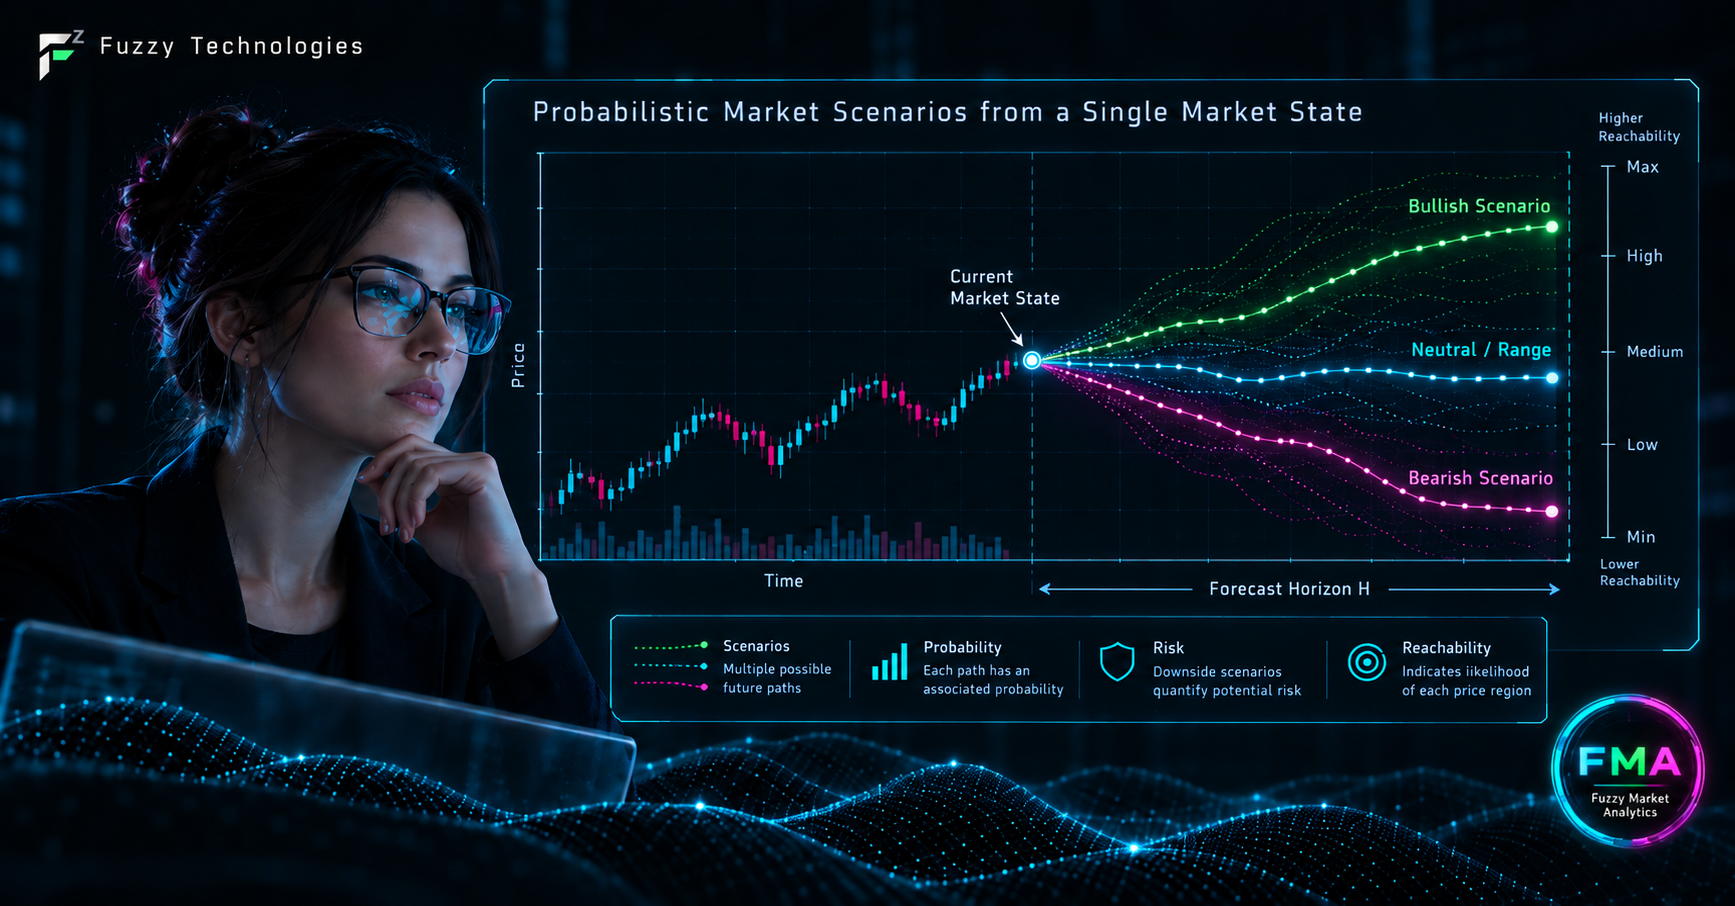
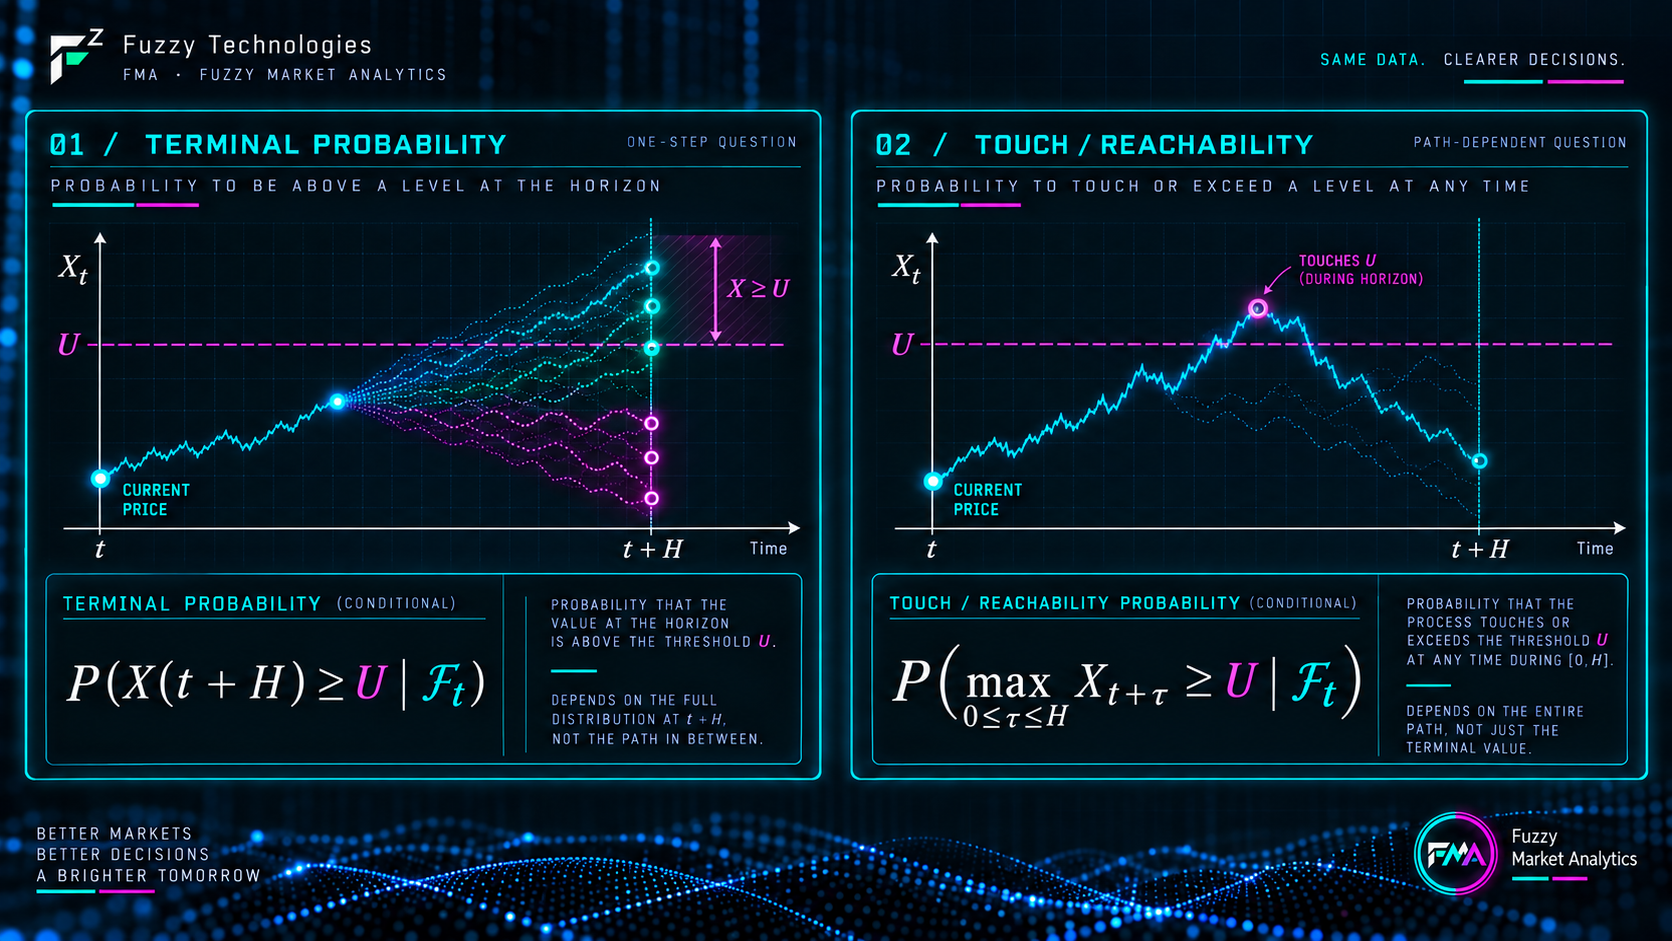
In the basic probabilistic formulation, we consider the current moment t, the horizon H, and a target level. For the upper target U, we can estimate the probability that at the end of the horizon the price will be at level U or above:
P↑ = P(X(t + H) ≥ U | ℱₜ)
For the lower target D, the analogous formulation is:
P↓ = P(X(t + H) ≤ D | ℱₜ)
Here, X(t + H) is the price at the end of the forecast horizon, and ℱₜ represents the information available to the model at time t.
The distinction matters: terminal probability concerns whether the price is at or beyond the target level at the end of the forecast horizon. Touch probability concerns whether the price touches or crosses that level at any time during the horizon, regardless of where it ends.
| Formulation | What is assessed |
|---|---|
| Terminal probability | The price at the end of the horizon t + H. |
| Reachability / touch | Whether the price reaches the specified level at least once within the horizon. |
Both formulations are useful in a trading system, but they answer different questions. For the same target, horizon, and price process, the probability of touching or crossing the level within the horizon is at least as high as the probability of ending at or beyond it. In real market data, the difference between these values can be significant. We therefore distinguish the end-of-horizon probability estimate from the practical assessment of target reachability, rather than treating them as interchangeable.
More about the basic probabilistic formulation: “Will the Price Reach the Target: Probability Estimation Instead of Guessing”
Our early Fuzzy Market Analytics (FMA) research included probability estimates based on price data across multiple timeframes. We filtered anomalous outliers before calculating log returns, average price changes, volatility, and standardized deviations.
As FMA evolved, the analytical context expanded. Today, probability estimation is supplemented by analysis of multiple time horizons, market state, and consistency between different features. At the same time, an individual diagnostic indicator should not by itself become a command to open a trade: it only strengthens or weakens the overall picture.
- On handling anomalous observations: “Detecting Anomalies in Numerical Data Without Complex Models: The Hampel Method”
- A detailed study of the modified Hampel method
Why a Number Is Not a Promise
An estimate such as 74.3% may look more authoritative than a qualitative description such as “high probability.” But neither the number nor its decimal precision, by itself, establishes the model’s reliability.
The result depends on the selected historical interval, data quality, current volatility, market regime, and model assumptions. When the market structure changes, the statistical properties of the observed process may also change. Therefore, a calculated probability is an estimate under specific initial conditions, not a property of a future event known in advance.
In practice, a probabilistic model should be evaluated across a sufficiently large set of comparable observations. An event assessed as highly probable may not occur in a particular case. Conversely, a low-probability scenario may still occur. A model should be assessed not on a single successful trade, but on whether it continues to distinguish stronger from weaker scenarios across a large sample and new evaluation periods.
Therefore, in FMA, numerical probability is an important but not the only element of decision-making.
When “Yes” and “No” Are Not Enough
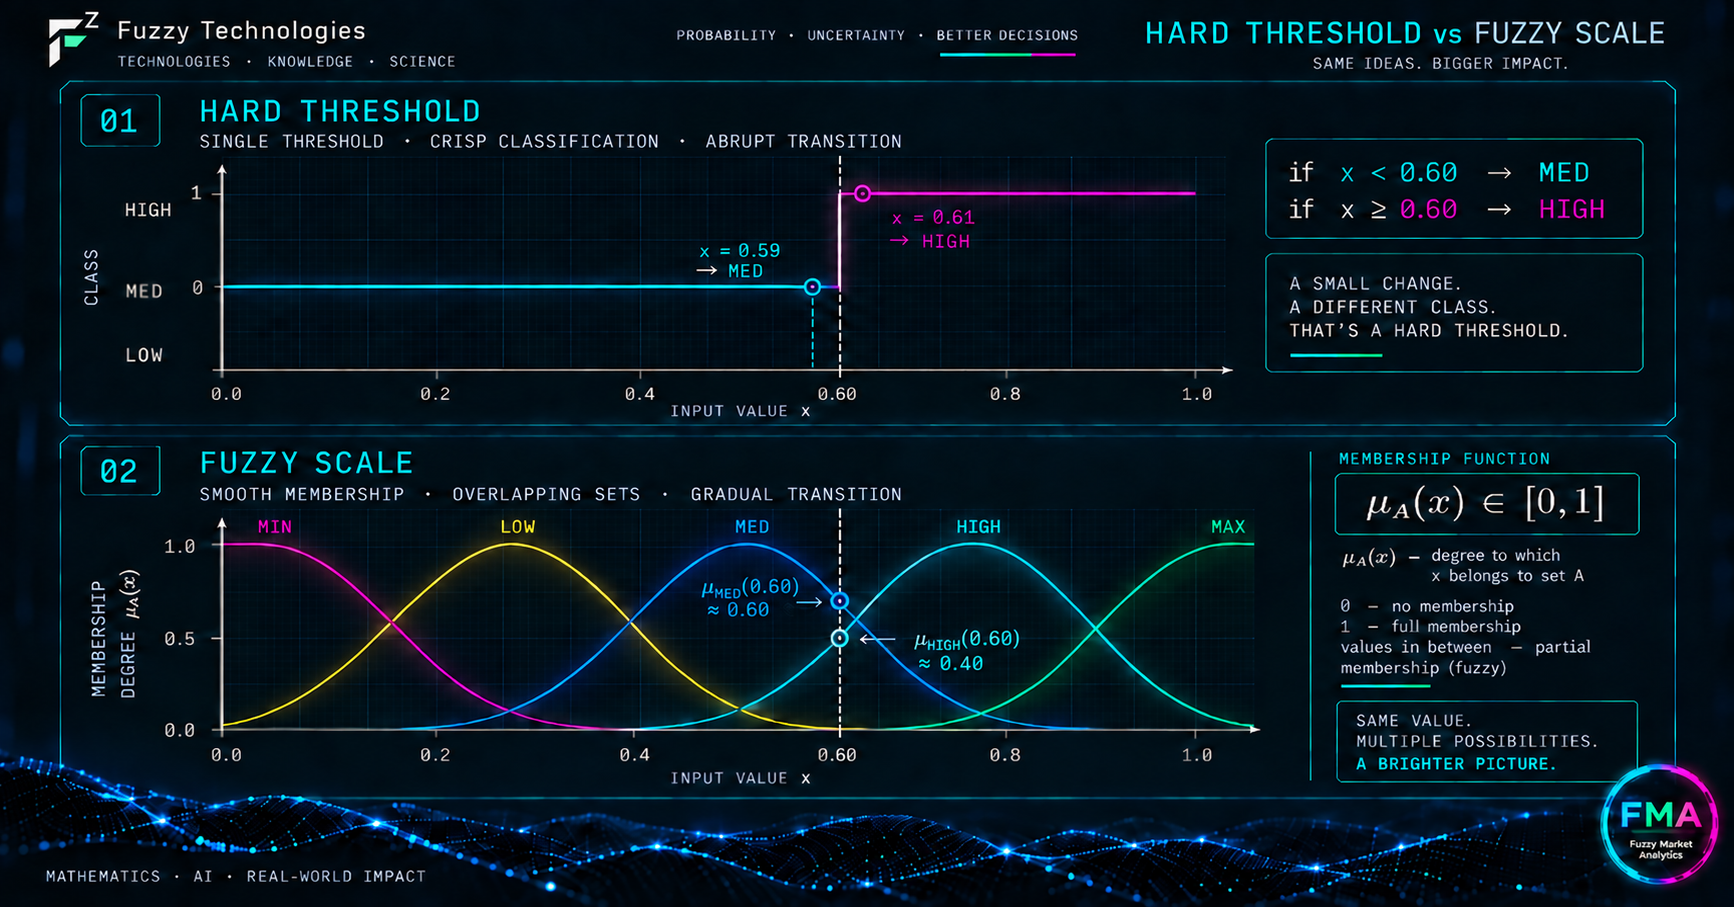
Classical threshold logic is convenient because of its simplicity. If a value is above a certain boundary, one decision is made; if it is below, another decision is made. However, near the boundary such a scheme starts behaving unnaturally: two almost identical values may fall into different categories.
For illustration, suppose the threshold between Med and High is set at 0.60. The values 0.59 and 0.61 differ only slightly, yet a hard threshold assigns them to different categories.
A fuzzy scale allows a smooth transition between states. For a fuzzy set A, the membership degree of a value x is written as:
μ_A(x) ∈ [0, 1]
A single value can have nonzero membership in more than one neighboring fuzzy set. For example, it may have a higher degree of membership in Med while retaining partial membership in High. This is why FMA uses the levels Min, Low, Med, High, and Max: they provide a unified language for probability, reachability, risk, and decision quality.
This is not simply a replacement of a numerical value with a verbal label. In fuzzy logic terms, Min, Low, Med, High, and Max are values of a linguistic variable connected to a numerical domain through membership functions. This representation formalizes qualitative assessments and gradual transitions between categories without imposing artificial precision on boundaries that are not sharply defined.
More details: “When ‘Yes’ and ‘No’ Are Not Enough: How Fuzzy Scales Work”
Why Probability Alone Is Not Enough for a Trade Decision
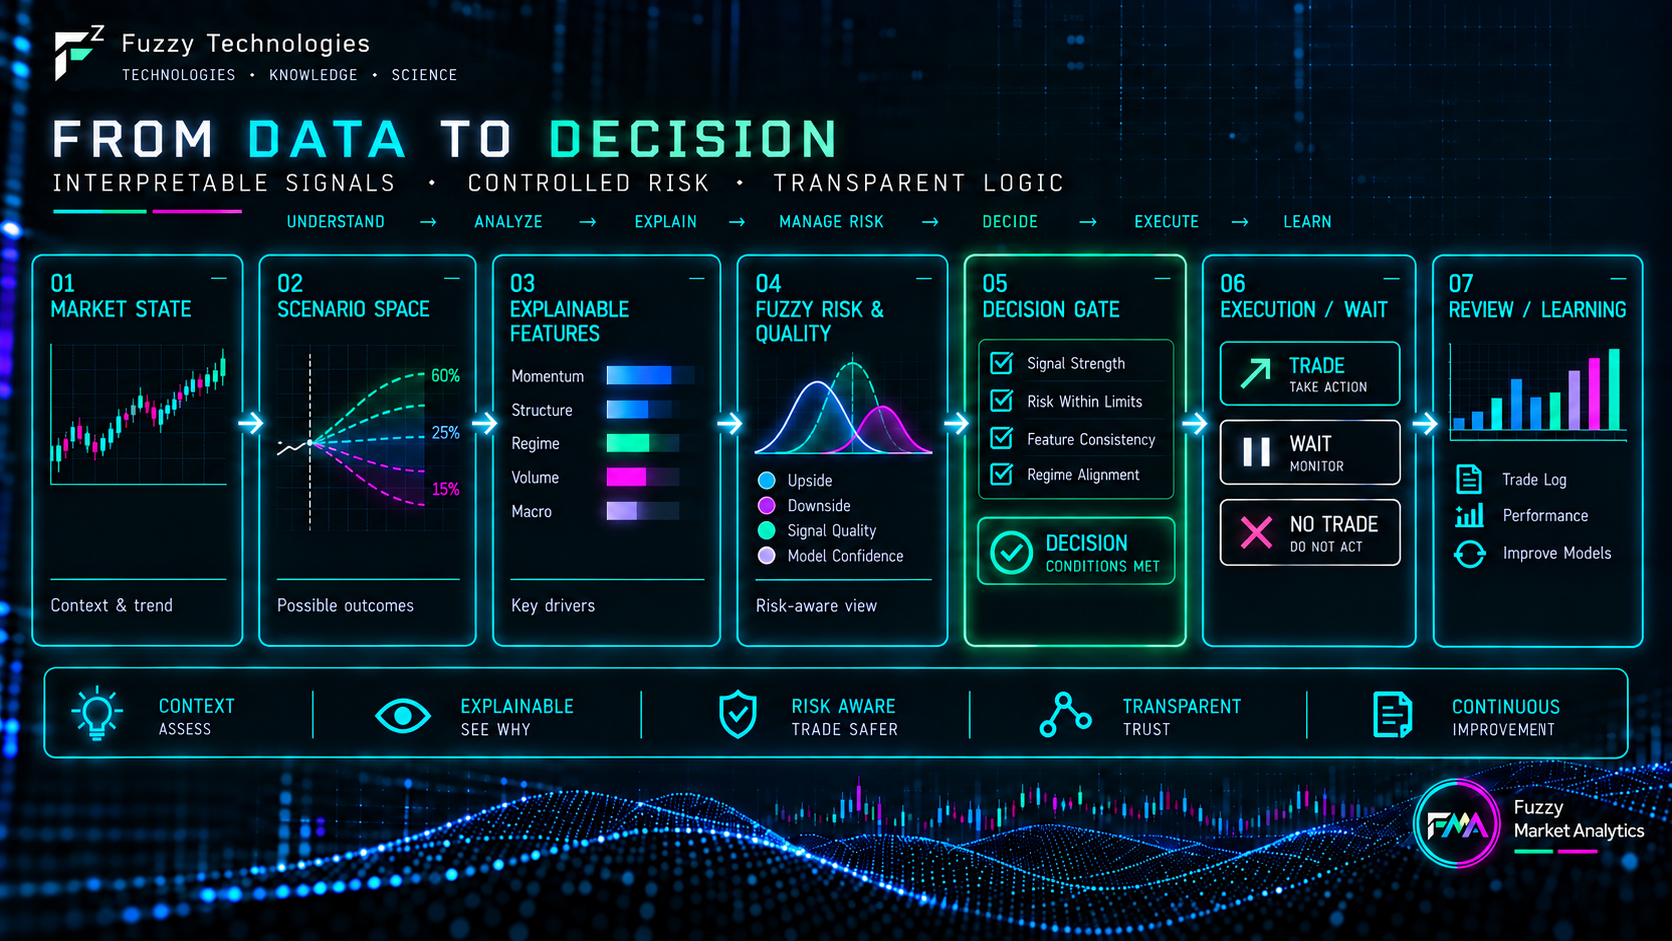
Even a high probability of a favorable scenario does not mean that a position should be opened immediately. Several distinct stages separate a statistical estimate from a trading action.
First, we need to verify that the input data are suitable for analysis. Then we consider the target, direction of movement, and consistency across different time horizons. After that, we take into account market state, confidence in the scenario, risk, execution costs, and the existing capital exposure.
| Analysis layer | What is checked |
|---|---|
| Data | Whether the input data are suitable for analysis. |
| Scenario | Target, direction of movement, and consistency across different time horizons. |
| Context | Market state and confidence in the scenario. |
| Constraints | Risk, execution costs, and existing capital exposure. |
Modern FMA is built precisely as a sequence of such checks. Some features are used to evaluate a scenario, others determine its quality, and others limit risk. A single strong indicator should not automatically override all other constraints.
In earlier versions of our system, probability and risk were combined using fuzzy decision matrices. One axis represented target reachability assessment, while the other represented risk assessment, and their combination determined whether an action was acceptable.
As FMA evolved, it incorporated more analytical factors and safeguards, but the core principle remained unchanged: a trading signal must be considered together with the probability of the underlying scenario, the market state, and the associated risk.
Important: this publication describes an earlier generation of the system; the modern FMA architecture has been significantly expanded
Not Trading Is Also a Decision
A trading robot’s activity is most visible when it opens and closes positions. If an Expert Advisor (EA) goes for a long time without placing a trade, it is natural to wonder whether it is working or missing obvious market moves.
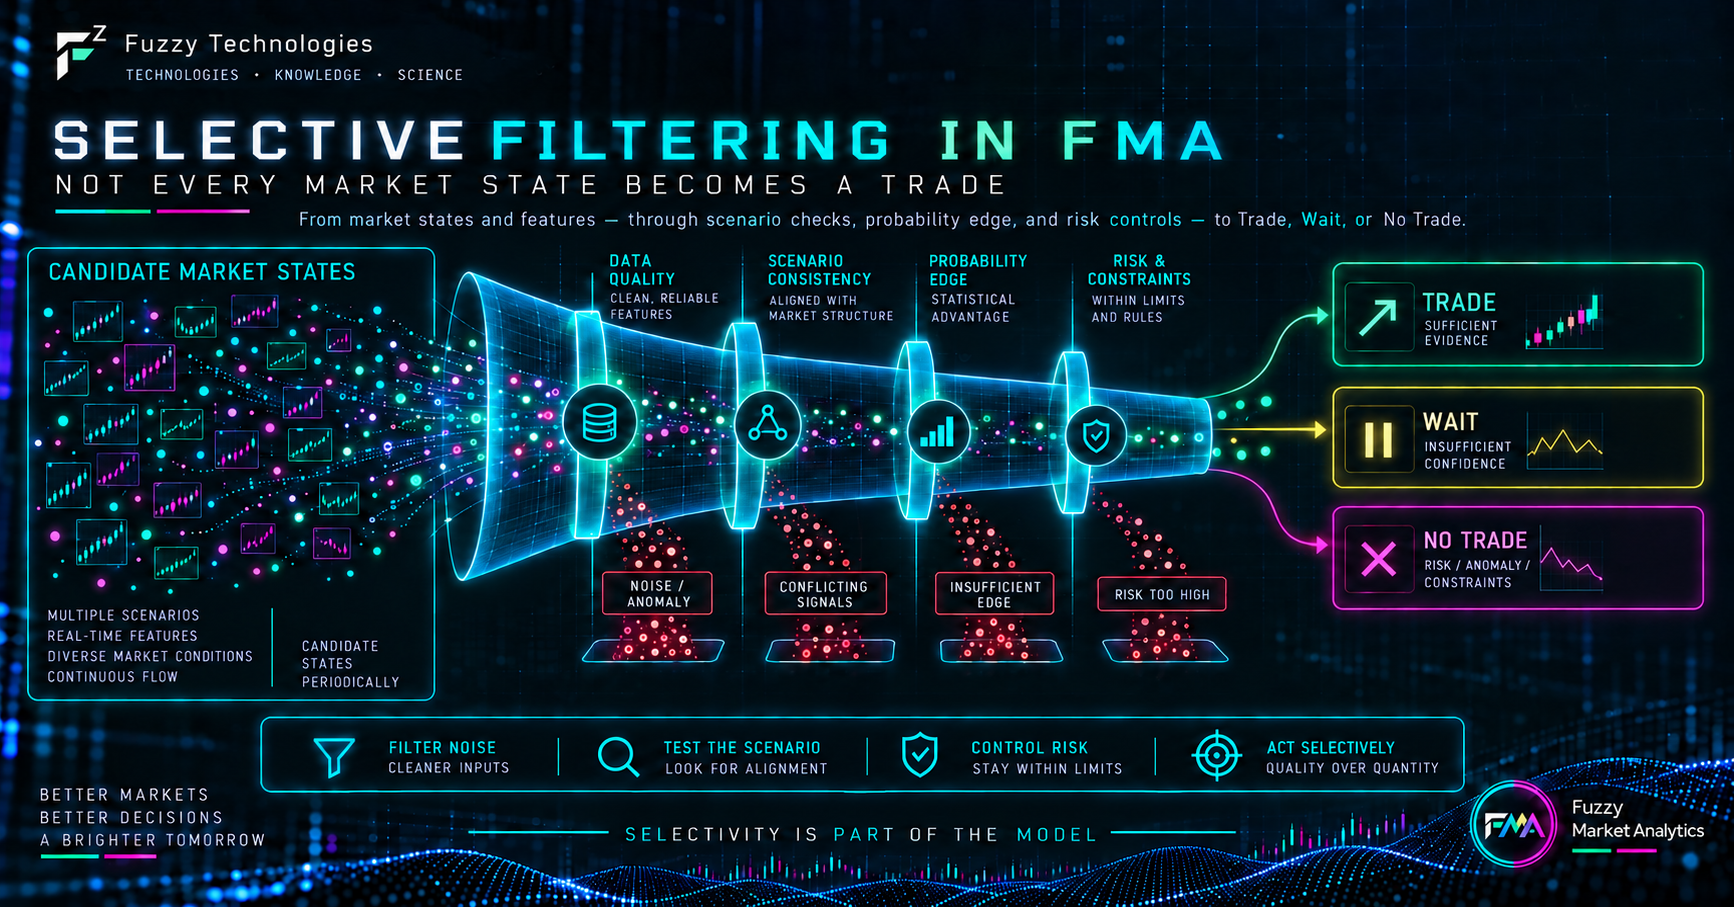
For a selective system, the absence of a trade can be a meaningful result of analysis.
The assessments of two directions may be too close. A scenario may look statistically interesting, but the potential movement may not justify trading costs. Individual features may contradict each other. Finally, the model may judge current market conditions unsuitable for taking on additional exposure.
In such situations, the model need not choose between “Buy” and “Sell.” It can also select “Wait.”
The number of trades itself is not a measure of trading system quality. Sometimes the best way to reduce poor decisions is simply not to participate in every noticeable market movement.
Opening a Position Is Only the Beginning
There is another fundamental point that is often overlooked when discussing trading algorithms: opening a position is only the beginning of its lifecycle. Many simple signal-based algorithms stop at a rule such as “If indicator X exceeds threshold Y, take action Z,” without addressing the next question: “How should the open position be managed?”
The market continues to evolve, so the initial scenario must be reassessed and updated as new data become available. The price may approach the target, move away from it, or stall, while the market itself may shift into a different regime. The assessment of the original forecast also changes.
Therefore, modern FMA treats an open position as a dynamic object with its own state and lifecycle. The system tracks its age, movement in favorable and unfavorable directions, the status of the original target, and changes in market context and dynamics. Depending on these factors, acceptable risk and position management rules may change. In addition, open positions form a portfolio, which means that both each individual trade and the aggregate portfolio risk must be considered.
We deliberately do not treat a good entry as a sufficient condition for a good trading system. A forecast must not only initiate an action, but also survive continuous validation against the real market.
An Engineering Approach: Decisions Must Be Reproducible
For a research system, it is not enough to know that a trade produced a profit or a loss. We need to understand why the trade was initiated in the first place.
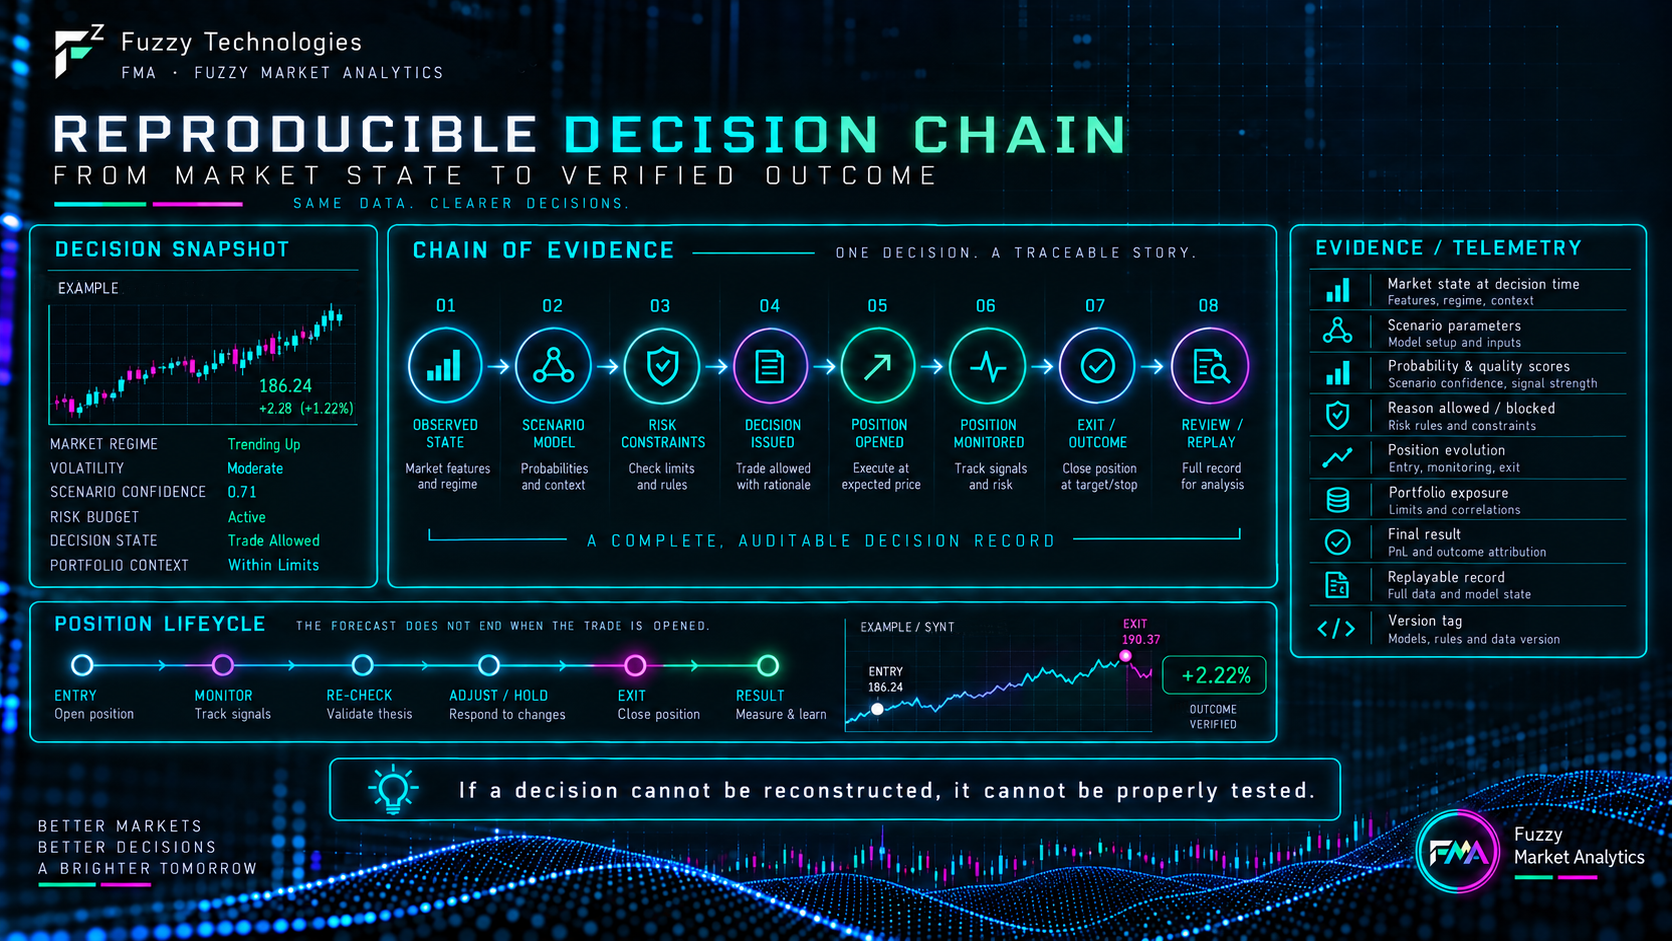
Therefore, every significant decision should leave a verifiable trace: the time and market state, scenario parameters, probabilistic and qualitative assessments, the reason why the action was allowed or rejected, the subsequent development of the position, and the final outcome.
Such telemetry allows us to analyze not only trades that were executed, but also decisions that were blocked or remained research hypotheses. It helps us compare algorithm versions, test new ideas, and distinguish genuine improvements from results that merely happen to look good over a particular historical period.
A decision that cannot be reconstructed after an experiment is completed has significantly lower research value. Therefore, reproducibility for us is not an addition to trading logic — it is one of its fundamental engineering characteristics.
Tests, Not Stories
A good result on a single historical interval does not prove algorithm reliability. The more model variants, parameter settings, and rules we test, the easier it is to find a combination that fits the known historical data by chance—the familiar problem of overfitting.
We therefore look beyond total profit. We also examine drawdowns, stability over time, behavior across different historical periods, the distribution of trades, and whether the system retains its characteristics on data not used for calibration.
The same applies to the boundaries of applicability. A marketing statement such as “works on any market and under any conditions” is practically impossible to validate meaningfully. It is more useful to specify the data on which the system was evaluated, the risks considered acceptable, and the conditions outside its intended operating scope.
This may be less eye-catching than promises of a robot that works everywhere or a 500% return, but it is much closer to engineering practice.
Working With Uncertainty, Not Guessing the Future
A trading robot does not know the future (and nobody does). It does not turn the financial market into a problem with a single predetermined answer and cannot guarantee the result of an individual trade.
Its value lies elsewhere. An algorithm can consistently verify data, evaluate multiple scenarios, compare different time horizons, consider market conditions, limit risk, and refuse to act when there is insufficient justification. After opening a position, it should continue checking the original hypothesis, and after the trade is completed, preserve the information required to analyze the result.
Our research in Fuzzy Market Analytics has gradually led us toward this kind of system.
Our goal is not merely to produce “Buy” or “Sell” signals more often or more quickly. We aim to build a system that evaluates scenarios, refrains from acting without sufficient justification, controls risk, manages the consequences of its own errors, and records enough information to reconstruct why each decision was made.
Probability · Risk · Reproducibility
A probabilistic model does not eliminate uncertainty. Risk management does not make every trade successful. Reproducibility does not guarantee that a hypothesis is correct. Together, however, they allow us to turn a trading idea into a system that can be formalized, tested, critically evaluated, and progressively improved.
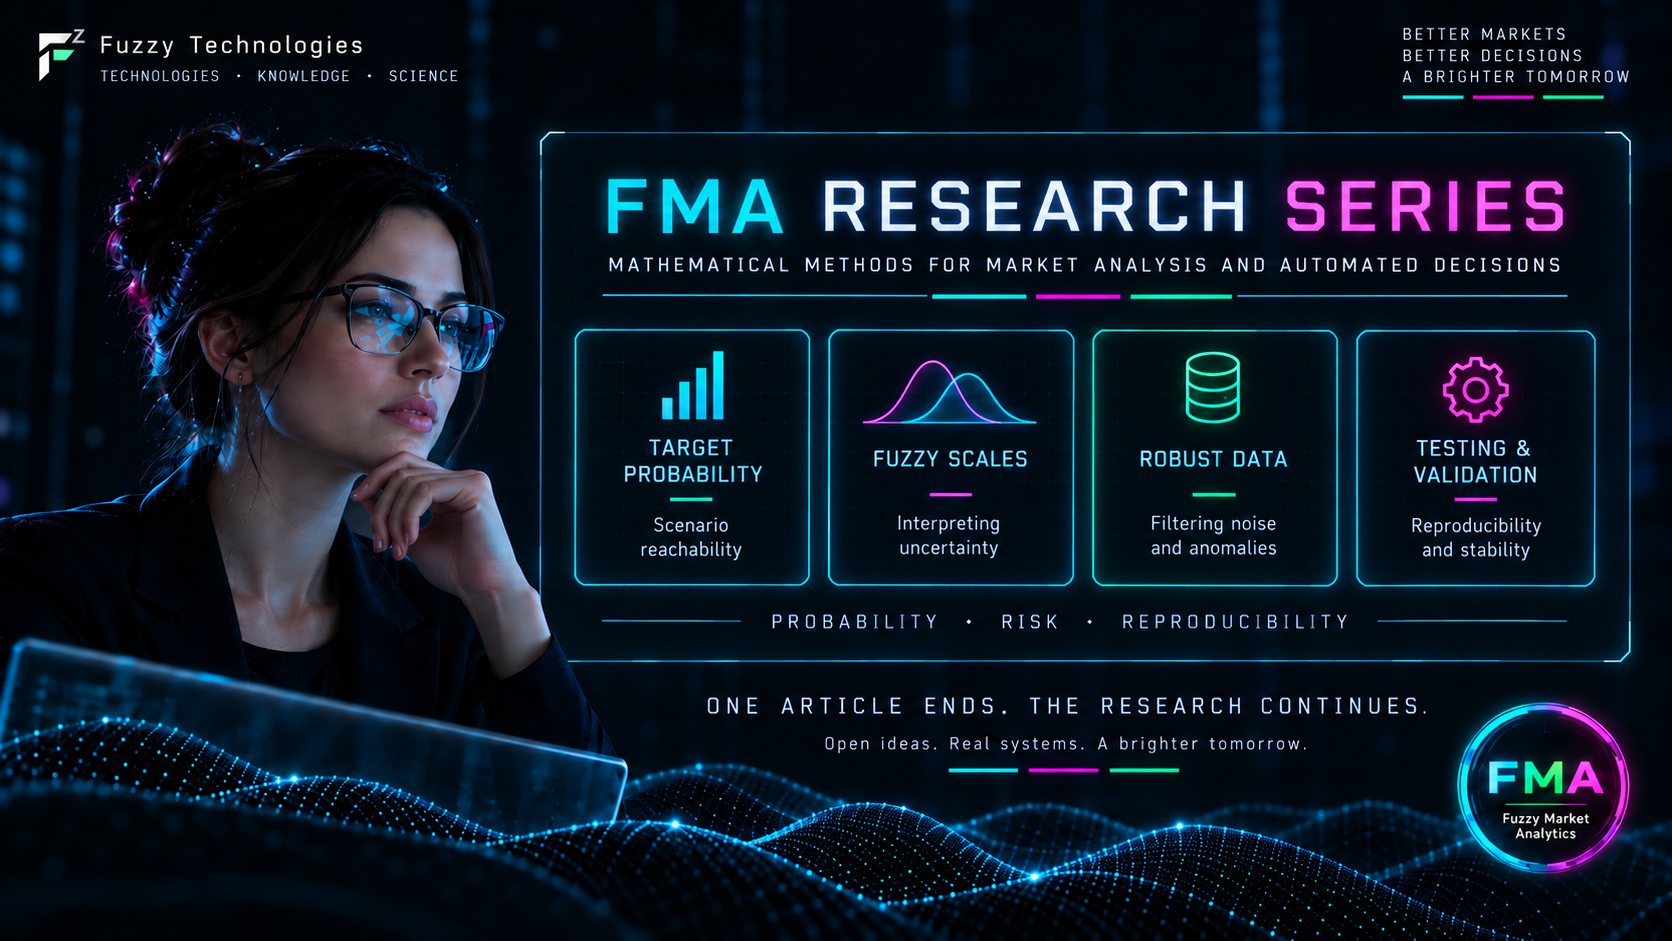
This publication opens a series of articles about mathematical methods for market analysis and automated decision-making. In upcoming articles, we will examine each of these components in turn: probabilistic assessment of price targets, fuzzy measurement scales, robust anomaly filtering, and methods for testing trading algorithms.
Related articles
- probabilistic assessment of price targets
- fuzzy scales
- Hampel method
- algorithm development history
- Fuzzy Market Analytics — news, research, and project development
Technologies · Knowledge · Science