

Multi Divergence MT5
RSI, CCI, MACD, OBV, Stochastic & AO
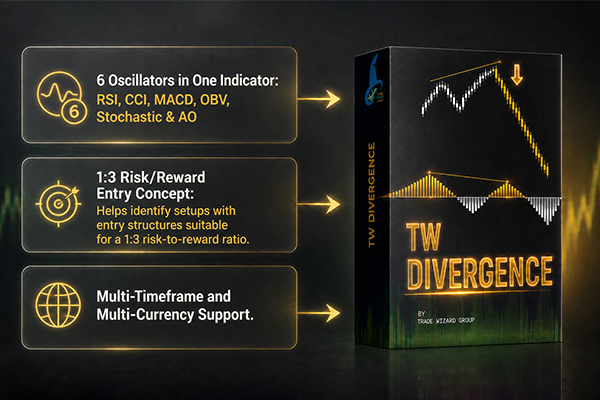
TW Multi Divergence MT5 is an advanced Forex divergence indicator for MetaTrader 5 designed for traders who want to analyze price divergence across multiple technical oscillators from a single chart.
Instead of switching between several separate indicators, TW Multi Divergence combines RSI, CCI, MACD, OBV, Stochastic, and Awesome Oscillator (AO) into one multi-divergence trading tool. Each oscillator can analyze divergence independently, while multiple divergence signals can be viewed together to help traders evaluate potential market turning points and momentum changes.
The indicator also includes divergence slope visualization, flexible display filters, multi-timeframe analysis, and multi-currency analysis, giving Forex traders a more structured way to study divergence without filling the chart with multiple indicator windows.
Whether you trade major currency pairs, minor pairs, gold, or other instruments available in MetaTrader 5, TW Multi Divergence can be used as part of a broader technical analysis and risk-management workflow.
What Is Divergence in Forex Trading?
Divergence occurs when the movement of price and the movement of a technical indicator do not fully agree.
For example, in a traditional bullish divergence, price creates a lower low while the oscillator creates a higher low. This can indicate that bearish momentum is weakening even though price has moved to a new low.
In a bearish divergence, price creates a higher high while the oscillator forms a lower high. This may indicate that bullish momentum is weakening.
MQL5 educational material describes divergence as a discrepancy between price movement and an indicator or oscillator, and discusses indicators such as RSI, Stochastic, CCI, and MACD as tools that can be used to analyze these relationships.
However, divergence should not automatically be treated as a standalone buy or sell signal. Market structure, trend direction, support and resistance, volatility, price action, and risk management can all affect the outcome of a divergence setup.
This is where a multi-oscillator approach can become useful: instead of looking at only one oscillator, traders can compare divergence information from several different momentum and volume-based tools.
Why Use a Multi Oscillator Divergence Indicator?
One of the challenges of divergence trading is that different oscillators can react differently to the same price movement.
RSI may highlight a momentum discrepancy while MACD shows a different momentum structure. Stochastic can identify changes in momentum around overbought or oversold conditions, while OBV provides a volume-based perspective.
MQL5 educational resources have explored the use of multiple indicators and oscillators for divergence analysis, including RSI, CCI, Stochastic, MACD and other tools.
TW Multi Divergence MT5 brings six of these tools together:
- RSI
- CCI
- MACD
- OBV
- Stochastic
- Awesome Oscillator (AO)
This allows traders to investigate divergence from multiple perspectives while keeping the main chart more organized.
Key Features of TW Multi Divergence MT5
1. 6 Oscillators in One Indicator
TW Multi Divergence combines six popular technical oscillators in a single MT5 divergence indicator:
- RSI – Relative Strength Index
- CCI – Commodity Channel Index
- MACD – Moving Average Convergence Divergence
- OBV – On Balance Volume
- Stochastic Oscillator
- AO – Awesome Oscillator
Instead of opening multiple indicator windows and manually comparing them, traders can monitor these six divergence sources through one tool.
The combination is particularly useful for traders who use RSI divergence, MACD divergence, CCI divergence, OBV divergence, Stochastic divergence, and AO divergence as part of their Forex analysis.
The MQL5 Market product page confirms that the indicator is designed around these six oscillators and displays their divergence information directly on the chart.
2. Separate Oscillator Analysis
Each oscillator analyzes divergence independently.
This is important because every oscillator measures a different aspect of market behavior. A momentum oscillator and a volume-based indicator may not produce identical signals at the same time.
With separate oscillator analysis, traders can see which individual indicator is producing the divergence instead of receiving only one combined signal.
This makes it easier to answer questions such as:
- Is the divergence coming from RSI?
- Is MACD also showing divergence?
- Is Stochastic confirming the same price structure?
- Is OBV showing a different volume relationship?
- Is AO confirming a momentum change?
The result is a more transparent divergence-analysis workflow rather than treating all indicators as a single black-box signal.
3. Multi-Divergence Confirmation
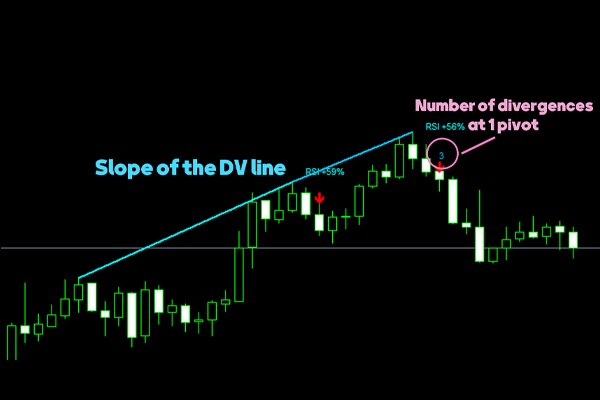
One of the main advantages of TW Multi Divergence is the ability to observe multiple divergences occurring around the same market area.
For example, price may form a new low while RSI creates a higher low. At approximately the same area, CCI, MACD, or Stochastic may also show divergence.
When several oscillators identify divergence around a similar price structure, traders can use this as multi-indicator confluence for further analysis.
The MQL5 product specifically describes this feature as identifying when multiple oscillators detect divergence in the same area.
This does not mean that multiple divergences guarantee a reversal. Instead, the information can be used as an additional confirmation layer together with market structure, price action, support and resistance, and the trader's own entry rules.
4. 1:3 Risk/Reward Entry Concept
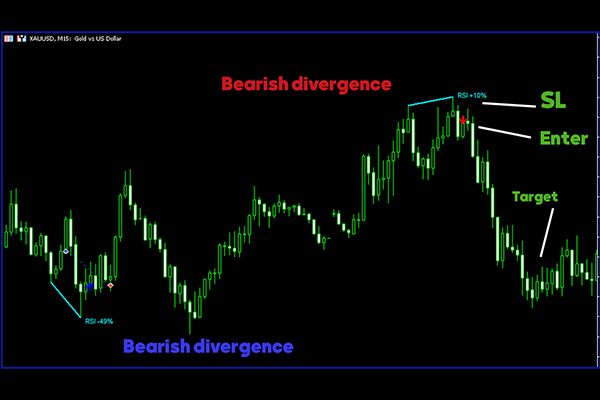
TW Multi Divergence includes a 1:3 Risk/Reward entry concept to help traders structure potential setups around a predefined risk-to-reward framework.
For example, a trader may identify a potential divergence-based entry and then plan a setup where the potential reward is approximately three times the predefined risk.
The indicator does not guarantee a 1:3 result and does not determine whether a trade will be profitable. Instead, the concept can be incorporated into the trader's own risk-management methodology.
A practical workflow could be:
Divergence → Confirmation → Entry → Stop Loss → 1:3 Risk/Reward Planning
This allows traders to combine technical analysis with disciplined trade planning rather than entering a position solely because a divergence has appeared.
5. Divergence Slope Display
TW Multi Divergence also provides a visual representation of the divergence line slope as a percentage on the chart.
The slope can provide an additional way to examine the direction and characteristics of the divergence line.
Instead of simply asking whether a divergence exists, traders can also observe the visual structure and slope of the connecting divergence line.
This can be useful when comparing different divergence setups and evaluating whether the price/oscillator relationship is relatively steep or shallow.
Slope-based analysis has also been explored in MQL5 divergence tools as an additional way of evaluating divergence structures and filtering potential signals.
6. Flexible Display Filters
A common problem with multi-indicator analysis is chart clutter.
Displaying every divergence from every oscillator at the same time can make a chart difficult to read, especially on lower timeframes.
TW Multi Divergence addresses this with flexible display filters.
Traders can enable or disable individual visual elements and divergence features according to their preferred analysis style.
For example, a trader may choose to focus primarily on:
- RSI and MACD divergence
- All six oscillators
- Only bullish divergence
- Only bearish divergence
- Multiple-confluence areas
- A cleaner chart with fewer visual elements
This flexibility allows the same indicator to be adapted to different trading styles, instruments, and timeframes.
7. Bullish & Bearish Divergence
TW Multi Divergence detects and displays both bullish divergence and bearish divergence.
Bullish Divergence
Bullish divergence generally occurs when:
Price → Lower Low
Oscillator → Higher Low
This type of divergence can indicate that bearish momentum is weakening despite price reaching a lower level.
Bearish Divergence
Bearish divergence generally occurs when:
Price → Higher High
Oscillator → Lower High
This can indicate that bullish momentum is weakening while price continues to move higher.
MQL5 educational examples describe these relationships as classic bullish and bearish divergence structures and use them as potential indications of weakening momentum or possible market reversals.
TW Multi Divergence allows traders to monitor these relationships across six different oscillators from the same indicator.
8. Multi-Timeframe & Multi-Currency Analysis
Forex traders rarely analyze only one timeframe or one currency pair.
A setup that appears on a lower timeframe can have a completely different context when viewed on a higher timeframe.
TW Multi Divergence supports multi-timeframe and multi-currency analysis, allowing traders to incorporate divergence analysis across different timeframes and currency pairs.
For example, a trader can use a higher timeframe to understand the broader market context and then move to a lower timeframe to study a potential entry.
A simple workflow could be:
Higher Timeframe → Market Context
Middle Timeframe → Divergence Confirmation
Lower Timeframe → Entry Planning
The same concept can be applied across multiple Forex pairs.
Instead of focusing exclusively on one chart, traders can compare divergence conditions across instruments and timeframes as part of their broader market-scanning process.
Understanding the Six Oscillators
RSI Divergence
RSI is one of the most widely used momentum oscillators in technical analysis.
When price and RSI move in different directions, the relationship can create a potential RSI divergence setup.
Traders commonly use RSI divergence to study momentum weakness and possible changes in market direction.
CCI Divergence
The Commodity Channel Index can be used to study the relationship between price movement and oscillator movement.
CCI divergence may provide another perspective when price reaches a new high or low but the oscillator does not confirm the same momentum.
MACD Divergence
MACD is widely used to analyze trend and momentum.
MQL5 educational material specifically discusses MACD as an indicator that can be used to track discrepancies between price movement and momentum.
MACD divergence can therefore provide another layer of confirmation when combined with other oscillators.
OBV Divergence
On Balance Volume introduces a volume-based perspective into divergence analysis.
Rather than focusing exclusively on price momentum, OBV helps traders examine the relationship between price movement and volume flow.
MQL5 material on divergence discusses OBV as one of the indicators that can be incorporated into divergence analysis.
Stochastic Divergence
The Stochastic Oscillator is frequently used to analyze momentum and overbought/oversold conditions.
When price forms a new extreme but Stochastic does not confirm that movement, traders can investigate the resulting divergence as part of their technical analysis.
Awesome Oscillator Divergence
The Awesome Oscillator, developed by Bill Williams, is a momentum indicator based on the relationship between short-term and longer-term moving averages of median price. MQL5 documentation and educational articles also describe AO as a tool that can be used for divergence analysis.
AO divergence can therefore add a different momentum perspective to the other five oscillators.

TW Multi Divergence is designed as an analysis and confirmation tool, rather than a complete standalone trading strategy.
A trader could use the following workflow:
Step 1 – Identify the Market Context
Start with the higher timeframe and determine whether the market is trending, ranging, or approaching an important support or resistance area.
Step 2 – Look for Divergence
Check whether price is forming a new high or low while one or more oscillators fail to confirm the same movement.
Step 3 – Check Multiple Oscillators
Look at RSI, CCI, MACD, OBV, Stochastic, and AO.
If several oscillators identify divergence in approximately the same area, the trader can investigate the setup further.
Step 4 – Analyze the Divergence Slope
Use the displayed divergence slope as an additional visual reference when studying the structure of the divergence.
Step 5 – Define the Trade Risk
Before entering a position, determine the invalidation level and stop-loss location according to the trading strategy.
Step 6 – Apply the 1:3 Risk/Reward Concept
If appropriate for the strategy, structure the trade around a potential 1:3 risk-to-reward relationship.
Step 7 – Confirm With Price Action
Finally, combine the divergence information with the trader's preferred confirmation method, such as market structure, support and resistance, candlestick behavior, or another technical filter.
This approach keeps divergence as one component of a broader trading plan.
Why Multi-Divergence Can Be Useful for Forex Traders
The Forex market operates across multiple sessions, currency pairs, and timeframes. This creates a large amount of market information for traders to process.
Using several individual divergence indicators can quickly make a trading workspace difficult to manage.
TW Multi Divergence provides a centralized approach:
This combination can help traders organize divergence analysis while keeping their workflow inside MetaTrader 5.
The main benefit is not simply having more indicators. The objective is to make it easier to compare different sources of technical information and identify areas where several signals may be pointing toward a similar market condition.

TW Multi Divergence MT5 – Built for Structured Divergence Analysis
TW Multi Divergence MT5 brings six popular oscillators together in one dedicated Forex divergence indicator.
With RSI, CCI, MACD, OBV, Stochastic, and AO, traders can study bullish and bearish divergence from multiple perspectives without manually switching between separate indicators.
Its multi-divergence confirmation, divergence slope display, 1:3 risk/reward concept, flexible visual filters, and multi-timeframe and multi-currency capabilities make it suitable for traders who want a more organized divergence-analysis workflow.
Use TW Multi Divergence as part of a complete trading process that includes market structure, price action, confirmation, position sizing, and risk management.
Analyze the divergence. Compare the oscillators. Confirm the market structure. Plan the risk.
View TW Multi Divergence MT5 on the MQL5 Market