
Audit Your MT5 Strategy’s Execution Logic: Top economist says it's 'panic season' in markets and…

What Happened—and What the Source Actually Says
In a July 2025 blog post on Owenomics, Owen Lamont, senior vice president and portfolio manager at Acadian Asset Management, described August through October as "panic season"—a historically documented clustering of major financial crises during the late-summer and early-autumn months. Lamont, who has held faculty positions at Harvard, Yale, the University of Chicago, and Princeton, traced the pattern back centuries, citing agricultural money flows, thin summer liquidity, and the writings of economists including William Stanley Jevons and Oliver Mitchell Wentworth Sprague.
His central probabilistic observation, as reported by Fortune, was direct: "If you do the rough math, there's a 10% chance of an epic disaster between August and October this year, and just a 2% chance from November through the following July." He was careful to note that a crash remains a rare event and that he was not aware of specific levered players positioned to trigger one—while also acknowledging he had no such awareness in August 2007, when the quant crash arrived.
By the summer of 2026, Lamont was documenting what he called a "crisis-like mechanism on a small scale": single-stock dispersion hitting readings comparable to the dot-com bubble peak, some levered hedge funds sustaining large losses, and surface-level index calm masking violent rotation underneath. His conclusion was not a prediction but a posture: markets that look serene may be the most dangerous ones to treat as routine.
That posture is the starting point for every section that follows.
Why This Matters to an MT5 Trader
Most intermediate traders using MetaTrader 5 focus their system reviews on signal quality: win rate, expectancy, drawdown curves. What Lamont's research forces into the frame is a different question—under what market regime is this signal being applied?
The liquidity conditions Lamont describes are not abstract macro trivia. They translate directly into measurable execution realities inside MT5:
- Spread widening: When institutional market makers reduce their presence, bid-ask spreads on equity CFDs, indices, and correlated forex pairs can expand beyond the averages your strategy was tested against.
- Slippage asymmetry: Stop-loss orders placed during low-liquidity windows tend to fill at worse prices than limit entries, creating a structural drag that compounds across a series of trades.
- Correlation breakdown: Instruments that historically move together can decouple sharply when a large institutional flow hits a thin order book. A hedge that worked in backtesting may fail in execution.
- Volatility without trend: Lamont's 2026 observation—that dispersion was extreme while the S&P 500 barely moved at the index level—describes a market that can punish trend-following EAs while simultaneously punishing mean-reversion EAs through sudden, large single-name or sector shocks.
None of this means your system should be switched off in August. It means your system should know what regime it is operating in and respond differently when that regime shifts.
The Common Automation Mistake: One Size Fits All
The most common failure mode in intermediate-level MT5 automation is a strategy designed, optimised, and backtested against a single dataset and then deployed with fixed parameters across all market conditions. The parameters that produced good results in a moderately trending, normally liquid environment then govern behaviour during a low-liquidity, high-dispersion episode.
This is not a coding error. It is an architectural assumption—the implicit belief that the market generating the next trade will resemble the market that generated the training data.
Lamont's research illustrates why this assumption can fail seasonally. The August-to-October window has historically produced a different type of market: thinner depth, larger price impact per unit of volume, and a higher conditional probability of tail events. As Fortune reports, Lamont cites research showing that August and September are periods of "unusually low trading liquidity, as investors and market makers take summer vacations."
An EA with a fixed ATR multiplier for stop placement, a fixed lot-sizing rule, and no mechanism to detect or respond to changes in volatility structure is not a robust system. It is a system optimised for one regime that is being asked to perform in another.
The Mechanism Behind the Risk: A Technical Causal Chain
To understand how a macro seasonality argument becomes a live execution problem in MT5, it helps to trace the causal chain step by step.
- Reduced participation: Institutional traders, market makers, and liquidity providers scale back activity. Order-book depth falls.
- Impact amplification: Each trade—including your EA's orders—moves price by a larger amount per unit of volume. Fills become less predictable.
- Volatility without directionality: Price moves appear large on short timeframes but lack the autocorrelation that trend systems require. Mean-reversion signals fire more frequently but at less reliable inflection points.
- Dispersion spikes: Individual instruments diverge from their historical correlations. A basket hedge or a multi-symbol EA built on correlation assumptions begins misfiring.
- Tail-event potential: If a large forced seller or a macro shock emerges into this thin environment, the amplification effect Lamont describes can accelerate losses rapidly. EAs with no circuit-breaker logic remain fully exposed until a margin call or manual intervention.
The mechanism is straightforward market microstructure, made seasonal by the behavioural regularity Lamont documents. The question for an MT5 trader is whether your system can detect steps two through four before step five arrives.
How to Test It in MetaTrader 5
The workflow below is designed for demo accounts and the Strategy Tester. Do not apply these modifications to a live account until each stage has been validated independently.
Step 1: Define a Regime Detection Filter
Before any signal logic runs, your EA should evaluate whether current conditions match the regime it was designed for. A minimal regime filter uses two observable inputs: realised volatility relative to its own recent average, and a live spread check.
Below is a pseudocode outline—not a compilable MQL5 file—to illustrate the logic structure:
// PSEUDOCODE — illustrative only, not a compilable EA // Step 1: Get ATR handle during OnInit int atrHandle = iATR(_Symbol, PERIOD_H1, 14); // Step 2: In OnTick, copy buffer values double atrBuffer[]; CopyBuffer(atrHandle, 0, 0, 20, atrBuffer); double currentATR = atrBuffer[0]; double averageATR = 0; for(int i = 1; i < 20; i++) averageATR += atrBuffer[i]; averageATR /= 19; // Step 3: Check live spread via MqlTick MqlTick lastTick; SymbolInfoTick(_Symbol, lastTick); double liveSpread = lastTick.ask - lastTick.bid; double normalSpread = SymbolInfoDouble(_Symbol, SYMBOL_SPREAD) * SymbolInfoDouble(_Symbol, SYMBOL_POINT); // Step 4: Regime gate bool volatilityElevated = (currentATR > averageATR * 1.5); bool spreadElevated = (liveSpread > normalSpread * 2.0); bool regimeIsNormal = (!volatilityElevated && !spreadElevated); // Only proceed with signal logic if regime passes if(!regimeIsNormal) return;
The thresholds (1.5× ATR, 2.0× spread) are illustrative starting points. Test them against historical data for your specific instrument before treating them as meaningful.
Step 2: Add Dynamic Position Sizing
In high-ATR regimes, a fixed lot size becomes a disproportionate risk. A volatility-scaled approach adjusts lot size so that the monetary risk per trade stays approximately constant regardless of how wide price is swinging.
// PSEUDOCODE — illustrative only

double riskPerTrade   = AccountInfoDouble(ACCOUNT_BALANCE) * 0.01; // 1% risk
double stopDistPoints = currentATR * 1.5; // stop placed 1.5 ATR from entry
double tickValue      = SymbolInfoDouble(_Symbol, SYMBOL_TRADE_TICK_VALUE);
double tickSize       = SymbolInfoDouble(_Symbol, SYMBOL_TRADE_TICK_SIZE);

double lotSize = riskPerTrade / (stopDistPoints / tickSize * tickValue);
lotSize = MathMax(lotSize, SymbolInfoDouble(_Symbol, SYMBOL_VOLUME_MIN));
lotSize = MathMin(lotSize, SymbolInfoDouble(_Symbol, SYMBOL_VOLUME_MAX));
Step 3: Run a Segregated Backtest by Calendar Segment
In the Strategy Tester, run two separate backtests over at least three years of data:
- Test A: 1 August through 31 October only
- Test B: 1 November through 31 July only
Compare expectancy, maximum drawdown, and average trade duration between the two segments. If your system's performance degrades materially in Test A, you have measurable evidence of regime sensitivity—not an assumption, but a data point.
Step 4: Implement a Session-Level Circuit Breaker
Define a daily drawdown limit that, when breached, halts new order placement for the remainder of that trading session.
// PSEUDOCODE — illustrative only double sessionOpenBalance = AccountInfoDouble(ACCOUNT_BALANCE); // captured at session start double currentEquity = AccountInfoDouble(ACCOUNT_EQUITY); double sessionDrawdown = (sessionOpenBalance - currentEquity) / sessionOpenBalance; if(sessionDrawdown >= 0.02) // 2% intraday halt threshold { // Close all open positions, cancel pending orders // Set a flag to block OnTick signal processing for remainder of session return; }
A Practical Decision Checklist
Before enabling your EA during any elevated-risk window, work through each gate below. These are observable, measurable conditions—not predictions.
| Gate | What to Check | Pass Condition | Fail Action |
|---|---|---|---|
| Spread gate | Live spread vs. 30-day average spread for the symbol | Live spread ≤ 1.5× historical average | Suspend new entries |
| Volatility gate | Current 14-period ATR (H1) vs. 20-period average of that ATR | Current ATR ≤ 1.5× rolling average | Reduce lot size by 50% or suspend |
| Correlation gate | If the EA trades correlated pairs, check the rolling 10-day correlation coefficient | Correlation within ±0.15 of the 90-day baseline | Disable multi-symbol hedging logic |
| Session drawdown gate | Equity vs. session-open balance | Drawdown < 2% of session-open balance | Close positions, halt EA for session |
| Calendar awareness check | Are you in an August–October window with no manual review scheduled? | Either outside the window, or a daily manual review is confirmed | Schedule a daily system review regardless of equity status |
These gates are not a substitute for understanding why your system works. They are a safeguard against the assumption that it will keep working when the environment changes.
Red-Flag Conditions That Warrant Immediate Review
- Average trade duration shortens by more than 40% compared to your backtest baseline without any parameter changes
- Fill prices on market orders consistently deviate from the signal price by more than one average spread
- Two or more correlated instruments in your watchlist break their historical spread relationship simultaneously
- The EA triggers its intraday loss limit on three or more consecutive sessions
Analysis note: The checklist above is an analytical framework, not a guarantee of loss prevention. All thresholds should be calibrated to your specific instrument, timeframe, and strategy logic through demo testing before any live application.
What to Do Before the Next Session
Lamont's research does not tell you when the next crash will occur. It tells you something more useful for a system trader: certain windows carry a structurally higher probability of adverse conditions, and those conditions interact with automated execution in predictable, testable ways.
The action plan below is deliberately non-predictive. It focuses on what you can observe and control.
Tonight or This Weekend
- Open the Strategy Tester and run your EA against August–October data from at least two prior years. Record expectancy, maximum drawdown, and average trade duration separately from your full-year results.
- Pull up a historical spread chart for your primary symbol. If your broker does not provide one, observe live spreads at the same time of day for five consecutive sessions and log them manually.
- Review your EA's source code or settings for any hardcoded lot size, fixed stop distance, or absence of a daily loss limit. Treat each one as a risk item that requires a deliberate decision, not a default.
Before Each Live Session During Elevated-Risk Periods
- Check the live spread against your logged baseline before enabling the EA.
- Confirm the current ATR reading on H1 relative to its 20-period average.
- Set a manual reminder to review open positions at the midpoint of the session—not just at open and close.
The Framing That Should Govern All of This
Lamont's broader point, drawn from centuries of market history and documented by Fortune, is that surface calm and underlying stress can coexist. An index that moves less than 1% per day while individual stocks swing by hundreds of billions in market cap is not a stable environment—it is a dissociated one. Automated systems that read only the top-level signal without interrogating the regime beneath it are operating on incomplete information.
A signal is necessary but not sufficient. The signal tells you what your model sees. The regime tells you whether the conditions that gave that model its edge are currently present. Execution quality determines whether the edge survives the gap between signal and fill. And risk controls determine whether a bad sequence of outcomes remains survivable.
Those four elements—signal, regime, execution, and risk controls—constitute the full audit your system needs before any elevated-risk window. The seasonal pattern Lamont describes is one prompt to conduct that audit. The habit of conducting it regularly, regardless of season, is the actual lesson.
Run the segregated backtest on demo first. Log what you find. Then decide.
Practical next step: If you want to evaluate this mechanism without forcing one strategy onto every market condition, the Ratio X Trader's Toolbox includes specialist MT5 systems for different jobs. Start on demo and examine how regime and volatility workflows apply to the context described above.
Real Screenshots From Ratio X Users
 Trade screenshot shared by a Ratio X user
 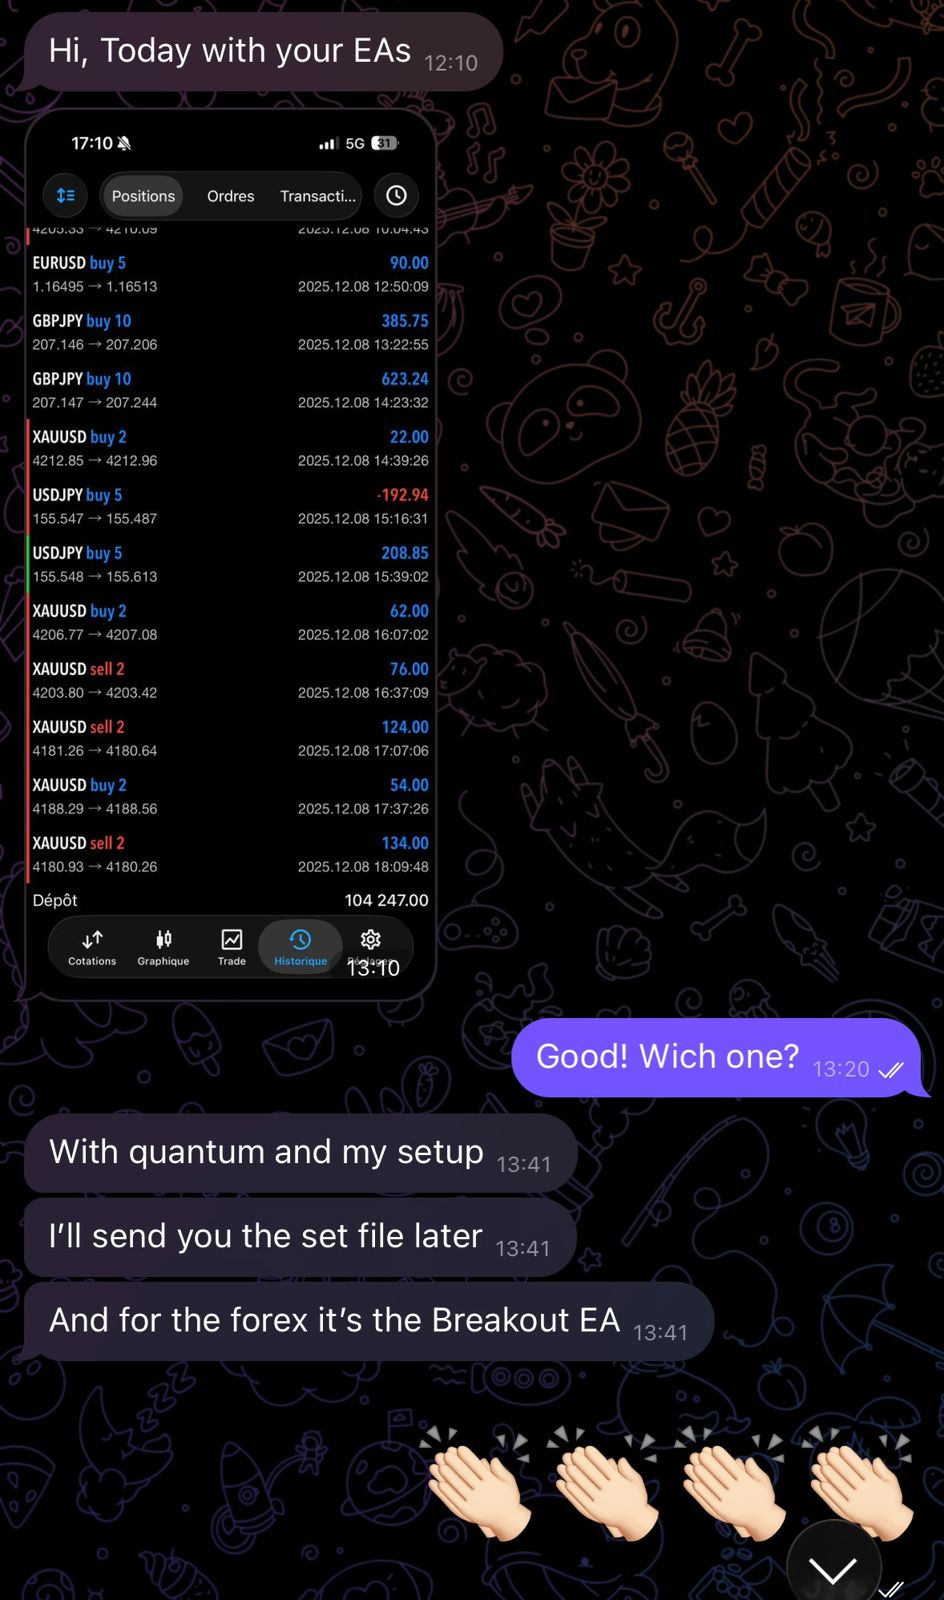 Multiple pairs running simultaneously, shared by a Ratio X user
 These are real screenshots shared by Ratio X users. They are examples of individual outcomes, not typical or guaranteed results. Trading involves risk of loss.
Evaluate the Ratio X Trader's Toolbox on Demo
The Ratio X Trader's Toolbox brings together 10 specialist systems, including one indicator, for regime analysis, trend, range, breakout, execution and XAUUSD workflows. It is designed for structured evaluation—not guaranteed trading results.
Lifetime access is available for a one-time payment of $147, backed by a 7-day money-back guarantee. Test one relevant module on demo, follow its setup guidance and decide whether it fits your process.
Explore the Ratio X Trader's Toolbox
If the Toolbox is the right fit and price is the final obstacle, use MQLFRIEND20 for 20% off. Only 10 coupons are available per month.


