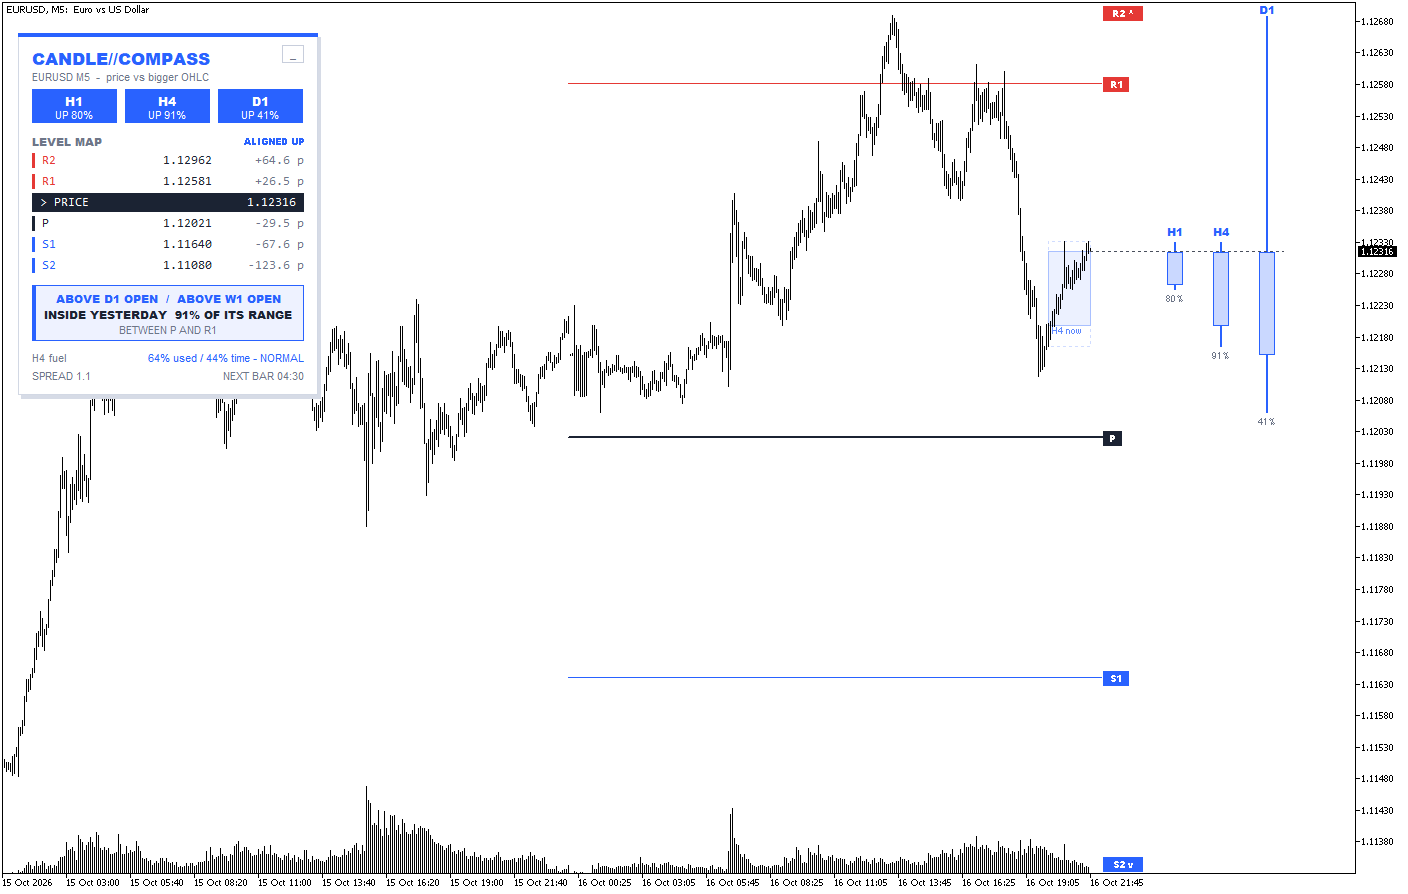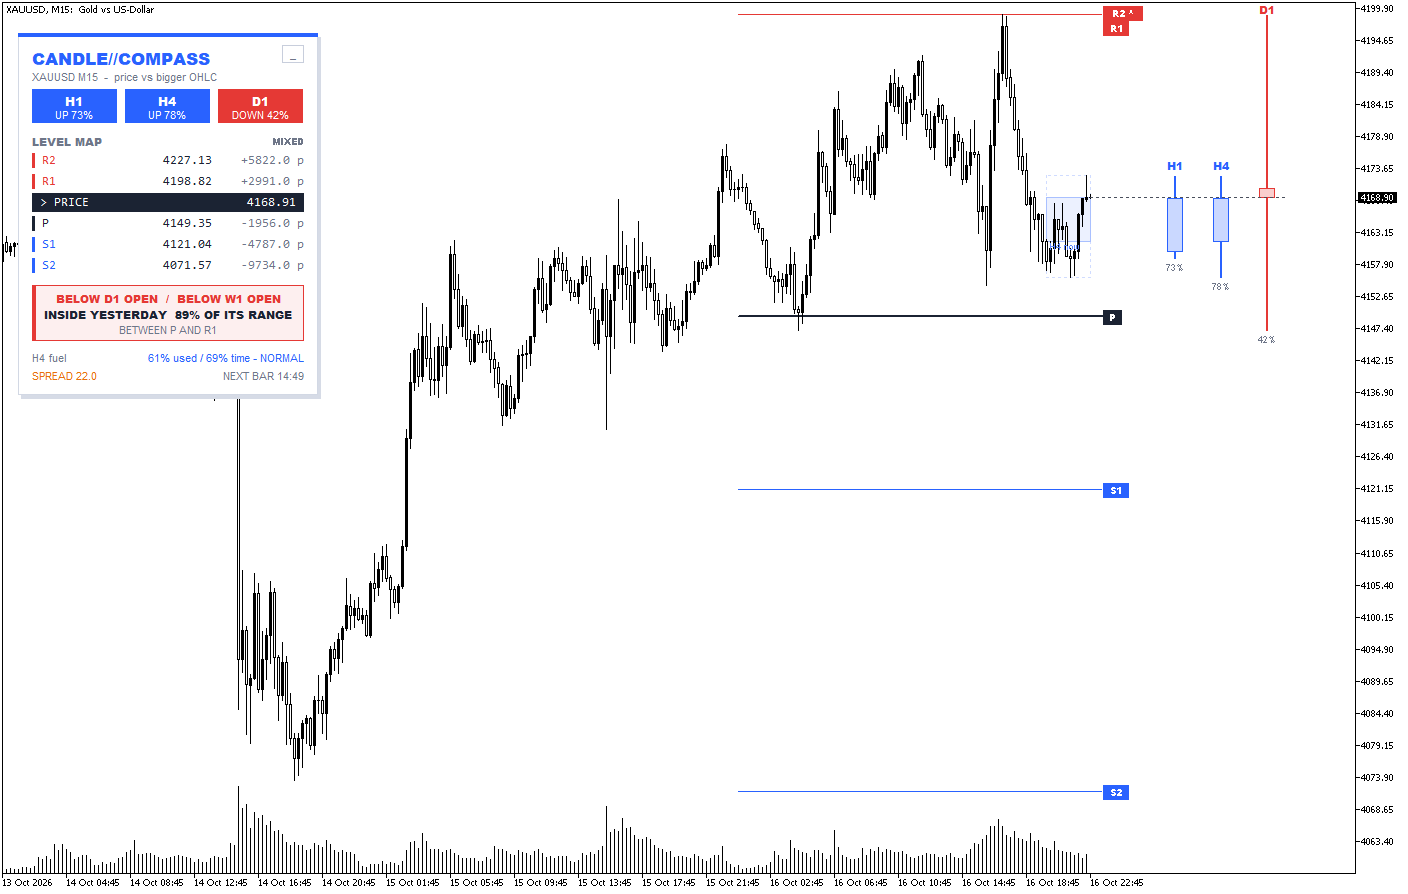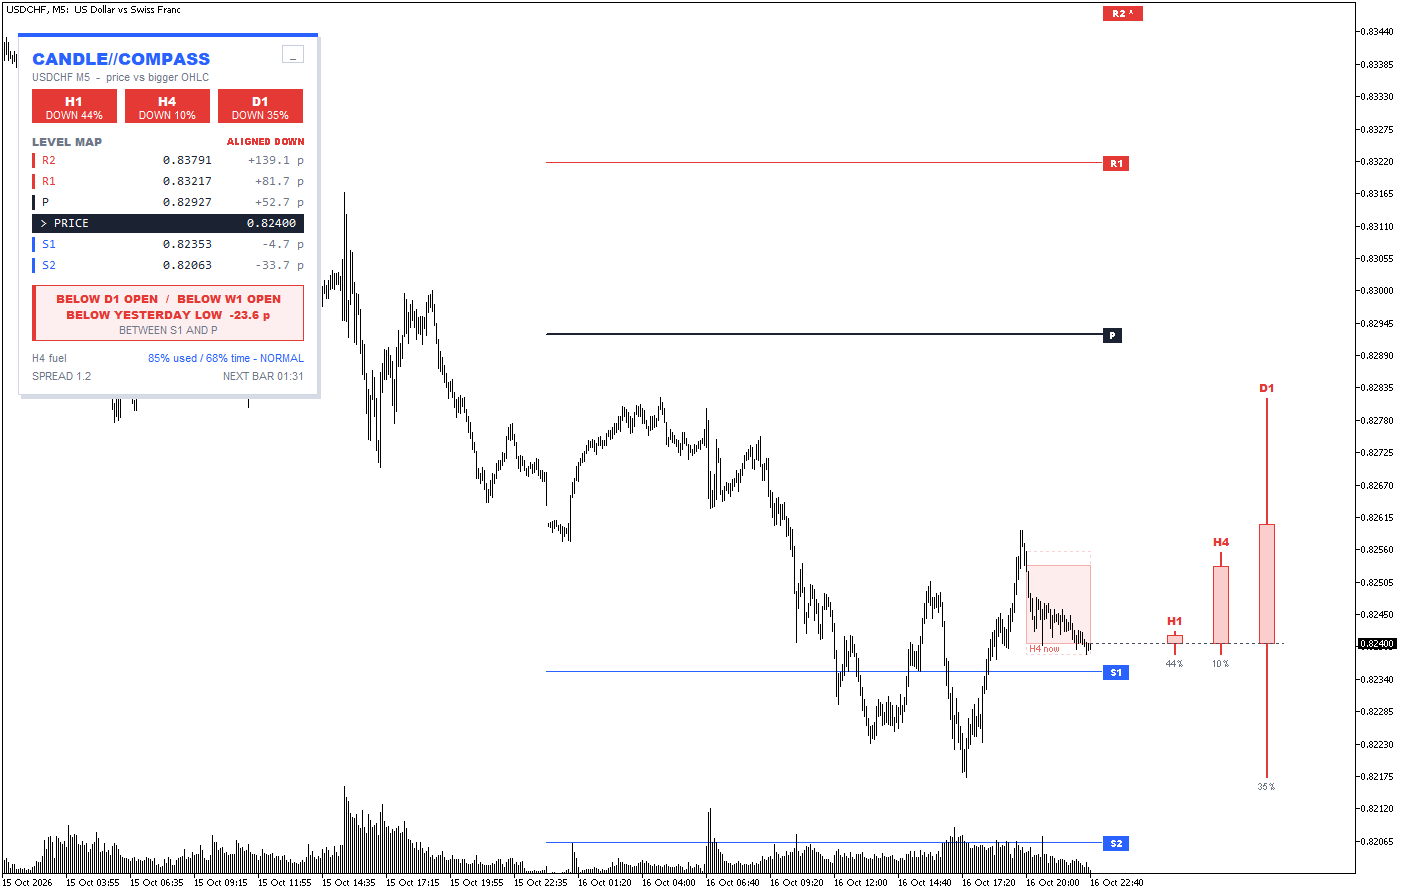

Where Am I? Introducing Candle Compass MT5
Every trader knows this moment. You take a nice setup on M15 and the market runs straight against you. Later you zoom out and see why: you were buying into yesterday’s high, at the top of a bearish daily candle, right under the weekly pivot. The setup wasn’t wrong. You just didn’t know where you were.
Candle Compass was built to answer that one question.
A tribute to pure price action
Open, high, low and close tell the whole story of the market, and the biggest stories are written by the daily, weekly and monthly candles. Candle Compass gives no signals and makes no predictions. It shows where price stands inside the bigger picture.
The chart stays clean. To the right of the last candle stand three small compass candles, for example H4, D1 and W1 on an H1 chart. They are drawn at the true price scale, with a dotted line at the current price, so one glance tells you which way the big candles lean and whether you are near their high or their low.
Levels that fit your timeframe
On M1 to M30 you see the daily pivots. On H1 and higher you get the weekly pivot with its support and resistance, plus the monthly pivot drawn in bold. Only the levels nearest to price are shown, and each has a clean tag on the right.
The panel
Direction chips show each bigger candle and where price sits in its range. The Level Map lists the levels above and below you with their distance in pips. The OHLC status sums it up in three lines:
ABOVE D1 OPEN / BELOW W1 OPEN
INSIDE YESTERDAY, 62% OF ITS RANGE
BETWEEN P AND R1
A fuel meter shows how much of its normal range the daily candle has already used, labelled FAST, SLOW, STRETCHED or NORMAL. Alerts are available for when the bigger candles align, when price closes across a level, or when the daily range is used up.
For scalpers, day traders and swing traders who believe the market already shows everything on a clean chart.
Pure price. Clear direction. Your decision.
Free Download MT5:
https://www.mql5.com/en/market/product/201813