
Trading Day: Tech, tariffs & Treasuries: The Execution Logic Blind Spot

Tech, Tariffs, and Treasuries: The Execution Logic Blind Spot Every MT5 Trader Needs to Close
1. What Happened — and What the Source Actually Says
On Monday, August 24, markets moved across multiple asset classes simultaneously. According to Jamie McGeever's Trading Day column published via Euronext, U.S. bond yields fell at the long end of the curve — dropping roughly five basis points on the 30-year — while technology stocks weighed on U.S. equities. The Nasdaq fell approximately 0.8%, the S&P 500 slipped 0.3%, and the tech sector declined around 1.6%, with Nvidia, Seagate, and Micron each falling several percent.
At the same time, the U.S. dollar gained approximately 0.2%, its best single-day performance in two weeks. The Canadian dollar was the weakest performer in the G10 currency space, pressured by a new threat of 50% tariffs on Canadian automobiles and auto parts. Oil fell roughly 2.5% — only its second decline in fourteen sessions — while gold rose around 1% to its highest level since mid-May. Bitcoin extended a recent rally, approaching the $80,000 level.
Three policy-level forces shaped this picture, as reported in the column. First, the U.S. Treasury signaled plans to conduct buybacks of longer-dated bonds, potentially using the Treasury General Account as a funding mechanism — a move markets appeared to receive positively, at least initially. Second, the Trump administration threatened new tariffs on Canadian imports, with Canada announcing retaliatory measures. Third, incoming Federal Reserve Chair Kevin Warsh was preparing to deliver a keynote at the Jackson Hole symposium later that week, with markets watching closely for signals on inflation, rate policy, and communication strategy.
This is the factual baseline. Note what the source does not say: it does not predict what happens next, it does not confirm whether Treasury's buyback plan will succeed, and it does not resolve the contradictions between Treasury's desire to suppress yields and the Fed's inflation mandate. Those open questions are precisely what makes this session instructive for traders who rely on automated systems.
2. Why This Matters to an MT5 Trader
If you run an automated Expert Advisor in MetaTrader 5, a session like this is not just a headline — it is a stress test of your system's underlying assumptions. Most retail EAs are built and optimized during one type of market environment, then left to run through whatever environment arrives next. That gap is where losses accumulate quietly.
Consider what Monday's session looked like from an execution standpoint:
- A yield-curve flattening event driven by a policy announcement, not a scheduled economic release
- Sector divergence within equities — eight S&P 500 sectors rising while three fell sharply
- A CAD move driven by geopolitical tariff escalation, not a rate differential
- Commodity moves running counter to typical risk-on/risk-off patterns: oil down, gold up
- Bitcoin rallying into a risk-off equity session
Each of these dynamics can individually break a system tuned for a simpler regime. An EA optimized for trending FX pairs during low-volatility periods may generate signals on a day like this, but those signals are being generated inside a regime the system was never designed to navigate. The signal fires, the position opens, and the market does something the model never encountered in its training window.
This is not necessarily a flaw in the signal itself. It is a consequence of missing regime awareness and execution context around that signal.
3. The Common Automation Mistake
The most widespread assumption in retail EA development is what might be called the one-regime fallacy: the idea that a system which performed well across a historical backtest period will continue to perform well because markets are broadly similar. This assumption becomes particularly problematic when multiple policy levers are moving at once.
On a day where Treasury conducts a surprise bond-market intervention, a sitting president issues new tariff threats against a G7 trading partner, and a newly confirmed Fed Chair is preparing a high-stakes public address, correlations between assets shift. Volatility surfaces reprice. Bid-ask spreads widen in instruments that are normally liquid. Slippage on market orders increases. Momentum indicators produce signals that reflect recent price history, not the current structural environment.
A trend-following EA running on USDCAD during Monday's session would have encountered a CAD move driven by headline risk, not technical structure. A mean-reversion EA running on U.S. tech stocks might have read a selloff as an oversold bounce opportunity, while the selling had a fundamental driver that the indicator could not detect. The signal fires correctly by its own internal logic. The regime makes that logic unreliable.
This is the execution logic blind spot: the EA is doing exactly what it was programmed to do, and that is the problem.
4. The Mechanism Behind the Risk
To understand why regime mismatch causes harm, consider the causal chain between market structure and EA execution quality.
Every indicator an EA uses — whether an ATR-based volatility filter, a moving average crossover, an RSI threshold, or a Bollinger Band signal — is a function of recent price history recorded in a specific market regime. When the regime changes, the statistical properties of price movements change with it: mean-reversion rates shift, autocorrelation changes, inter-instrument correlation breaks down, and volatility clustering behaves differently.
The specific causal chain on a policy-shock day runs as follows:
- A policy shock arrives — in this case, a Treasury buyback announcement and a tariff escalation on the same day.
- Institutional order flow reprices — large participants adjust hedges, reduce exposure, and reposition across multiple instruments simultaneously.
- Intraday volatility spikes unevenly — some instruments gap and then mean-revert, others trend sharply, others chop within wide ranges.
- EA indicators lag — they continue computing values based on the prior regime's price data.
- A signal fires based on stale statistical logic — the EA opens a position that was consistent with the training environment but not with current conditions.
- Execution quality deteriorates — spreads are wider, slippage is higher, and stop-loss orders may be triggered before the intended directional move develops.
- Risk controls, if absent or poorly calibrated, fail to limit the damage.
The bond-market dynamic reported in the Trading Day column illustrates steps one and two directly. The Treasury's buyback signal was not a scheduled event — it was a discretionary policy intervention. No economic calendar flag would have warned an EA. This is the category of event that automated systems are structurally least equipped to handle, because they have no mechanism for reading intent from institutional announcements.
5. How to Test It in MetaTrader 5
The appropriate response is not to abandon automation. It is to build regime detection and execution-quality checks into your workflow before running any system on a live account. MetaTrader 5's Strategy Tester and the MQL5 language provide practical tools for this. The following describes a demo-first workflow.
Step One: Implement a Volatility Regime Filter
Before placing any trade, your EA should assess whether current market conditions fall within the volatility parameters it was designed for. A practical starting point is an ATR-based filter using MQL5's handle-and-buffer pattern.
The following is pseudocode that illustrates the logic structure. It is not production-ready and should be adapted to your specific EA architecture before testing:
// PSEUDOCODE — illustrative only, not production-ready // In OnInit(): int atrHandle = iATR(_Symbol, PERIOD_H1, 14); // In OnTick(): double atrBuffer[]; ArraySetAsSeries(atrBuffer, true); int copied = CopyBuffer(atrHandle, 0, 0, 3, atrBuffer); if(copied < 3) return; // insufficient data, skip tick double currentATR = atrBuffer[0]; double baselineATR = 0.0020; // example: derive from your optimization period double regimeRatio = currentATR / baselineATR; if(regimeRatio > 1.8) { // Volatility is significantly elevated relative to the training regime // Suppress new entries; tighten or close existing positions return; } // Proceed with signal evaluation only if within regime bounds
Run this filter in the Strategy Tester across a recent period that includes policy-shock sessions. Compare equity curves with and without the filter active. Examine how many trades the filter suppresses, and whether those suppressed trades were net positive or negative. Conduct this analysis on a demo account only until you have sufficient forward-test evidence.
Step Two: Audit Execution Quality During High-Impact Sessions
MetaTrader 5 logs every order with entry price, requested price, and execution price. After any session involving major policy announcements — such as the Treasury and tariff developments reported on August 24 — review your trade journal and compare requested entry prices to actual fill prices. Elevated slippage on a demo account is a leading indicator of what live execution will look like under similar conditions.
Step Three: Correlation Monitoring Across Instruments
If your EA trades multiple symbols, build a periodic check that measures rolling correlation between those symbols. On days where previously uncorrelated instruments move together — as tends to happen during multi-asset policy shocks — position-sizing logic built on independence assumptions breaks down. A straightforward approach is to compute rolling correlations externally using exported MT5 bar data, then use that result to manually gate your EA's operation during such periods.
6. A Practical Decision Checklist
Before and during any session where multiple policy-level events are active, work through the following gates. If any gate fails, treat it as a stop condition — do not run your EA on live capital until you have resolved the issue the gate identifies.
| Gate | Observable Check | Stop Condition |
|---|---|---|
| Volatility Gate | Is current ATR more than 1.5× the average ATR from your backtest period? | Yes → suspend new entries |
| Correlation Gate | Are instruments your EA treats as independent moving in the same direction today? | Yes → reduce position sizes or suspend |
| Spread Gate | Is the current bid-ask spread more than 2× its normal session average? | Yes → market orders will incur excess slippage; suspend |
| News Gate | Has an unscheduled or surprise policy event occurred in the last two hours? | Yes → review manually before allowing EA to operate |
| Regime Gate | Is the asset class your EA trades showing sharp divergence within the same group? | Yes → cross-asset assumptions may be violated; suspend |
| Risk Limit Gate | Has your EA's open drawdown reached your pre-defined daily limit? | Yes → halt EA, assess manually, do not override the limit |
These gates are not predictions. They are observable conditions you can check before each session using readily available data: your broker's spread information, your MT5 ATR values, and a standard economic calendar supplemented by manual monitoring for unscheduled events.
7. What to Do Before the Next Session
The August 24 session did not resolve the policy tensions it surfaced. The Trading Day report flagged upcoming catalysts explicitly: the Reserve Bank of Australia's meeting minutes, Germany's Ifo business index, U.S. consumer confidence data, a $69 billion two-year Treasury auction, and the Jackson Hole keynote from Fed Chair Warsh. Each represents a scheduled event layered onto already-elevated policy uncertainty — a combination that is among the more challenging environments for automated systems.
Here is a measured, non-predictive action plan for intermediate MT5 traders following this type of session:
- Audit your EA's recent trade log. Compare fill quality — slippage and spread at entry — on high-volatility days versus normal sessions. A large gap suggests live performance will trail your backtest.
- Run your system forward in a demo account through the next scheduled high-impact events. Do not move to live capital until you have observed how the system behaves under real spread and slippage conditions.
- Review your stop-loss and position-sizing logic for regime assumptions. If your EA sizes positions using a fixed ATR multiple, verify that the ATR input is current and not a cached value from a lower-volatility period.
- Document what your EA is not designed to handle. Most EA documentation describes what the system does. Equally important is a written record of the conditions under which it should not operate. Monday's session is a concrete example to add to that record.
- Do not modify optimization parameters in response to a single session's performance. One session is not a dataset. Reactive re-optimization is a common source of curve-fitting and forward-performance degradation.
The lesson from Monday's session is not that automated trading failed. It is that automation without regime awareness and execution-quality monitoring is an incomplete system. A signal is the beginning of a decision, not the end of one. Regime fit, execution quality, and risk controls determine whether that signal can be acted on responsibly. On a day when Treasuries, tech, and tariffs all moved simultaneously in structurally unusual patterns, those three layers of discipline separated systems operating within their design parameters from those operating outside them without knowing it.
Build the gates. Test them in demo. Document the conditions your system is not designed for. That is the work that separates traders who evaluate automated systems rigorously from those who discover their system's limits in a live account during a policy-shock session.
Practical next step: If you want to evaluate this mechanism without forcing one strategy onto every market condition, the Ratio X Trader's Toolbox includes specialist MT5 systems for different jobs. Start on demo and examine how risk-control workflows apply to the context described above.
Real Screenshots From Ratio X Users
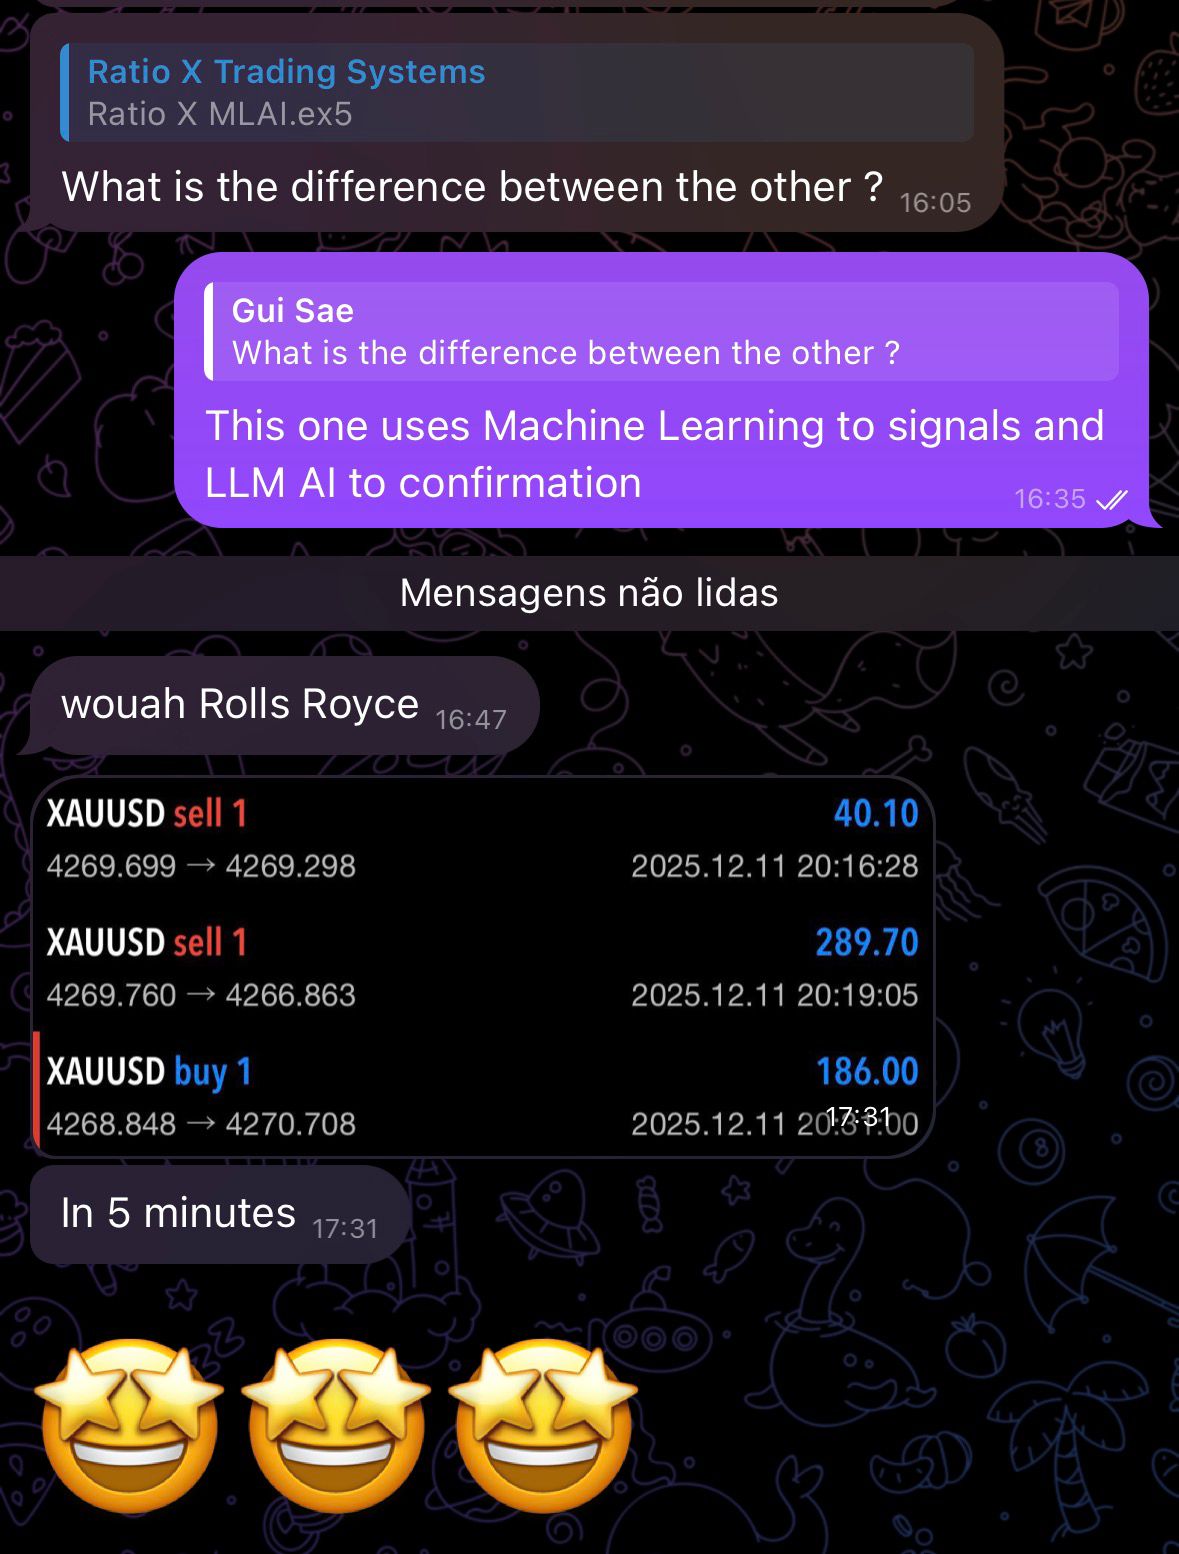 Screenshot shared by a Ratio X user
  Trade screenshot shared by a Ratio X user
 These are real screenshots shared by Ratio X users. They are examples of individual outcomes, not typical or guaranteed results. Trading involves risk of loss.
Evaluate the Ratio X Trader's Toolbox on Demo
The Ratio X Trader's Toolbox brings together 10 specialist systems, including one indicator, for regime analysis, trend, range, breakout, execution and XAUUSD workflows. It is designed for structured evaluation—not guaranteed trading results.
Lifetime access is available for a one-time payment of $147, backed by a 7-day money-back guarantee. Test one relevant module on demo, follow its setup guidance and decide whether it fits your process.
Explore the Ratio X Trader's Toolbox
If the Toolbox is the right fit and price is the final obstacle, use MQLFRIEND20 for 20% off. Only 10 coupons are available per month.