
European stocks flat as markets weigh Iran tensions, await: What Breaks First in Your MT5 Strategy?

European Stocks Flat as Markets Weigh Iran Tensions: What Breaks First in Your MT5 Strategy?
1. What Happened—and What the Source Actually Says
On Monday, August 24, 2026, European shares closed flat, with the pan-European Stoxx 600 ending unchanged at 654.21 points. The session was flat by tension, not by quiet. Markets were simultaneously absorbing US secondary sanctions on countries trading with Iran, diplomatic activity involving Pakistan's army chief in Tehran, and a forward-looking calendar of European economic data including German and French GDP, the German Ifo survey, and Spanish inflation figures.
US Treasury Secretary Scott Bessent's announcement of tougher secondary sanctions added a layer of uncertainty that analysts found difficult to price with confidence. Chris Beauchamp, chief market analyst at IG Group, was quoted directly: "There are a lot of unknowns riding on this at the moment. If you have a situation where the US action is taken as a threat to the Iranian economy and they respond in the only way they can and then take action in the Strait of Hormuz, it would be particularly bad for European markets."
Beneath the flat headline number, sector divergence was visible. Travel and leisure stocks rose 1.7 per cent as Brent crude declined 1.9 per cent. Energy stocks fell 1.6 per cent in line with oil. Defence slipped 1 per cent. Technology fell 0.8 per cent ahead of Nvidia's scheduled results. The flat index reading was the arithmetic result of a market pulling hard in multiple directions at once—not a signal of calm.
This distinction matters for any automated trader. A zero-change close is not the same as low volatility. It can mask intraday whipsaw, sector rotation, and liquidity withdrawal that each stress the assumptions an expert advisor depends on.
2. Why This Matters to an MT5 Trader
Automated systems in MetaTrader 5 are built on historical patterns. Those patterns encode an implicit assumption: that the regime governing the market—its volatility structure, correlation behaviour, and liquidity profile—is stable enough that past relationships will continue to hold. When macro repricing events arrive, that assumption is tested in real time.
The August 24 session contained at least four simultaneous regime stressors:
- Geopolitical uncertainty without resolution. The sanctions announcement did not resolve the Iran situation—it escalated ambiguity. Markets respond to ambiguity differently than to confirmed events. Spreads widen. Participation fragments.
- Inflation narrative continuation. US Treasury yields had hit a multi-decade high the prior week, with persisting Middle East tensions keeping oil elevated. A strategy calibrated before that yield move may be operating with outdated volatility baselines.
- Central bank repricing. Money markets were pricing the ECB deposit rate toward 3 per cent by late 2027. A hawkish repricing of rate expectations changes correlations between equities, bonds, and currencies—often rapidly and non-linearly.
- High-impact data ahead. The week contained GDP figures, business surveys, and inflation prints. These are known unknowns: visible on the calendar, but unknowable in magnitude or market reaction in advance.
For an MT5 trader running an automated system on European indices, euro-denominated FX pairs, or energy-correlated instruments, each of these stressors represents a potential breakpoint. The question is not whether your strategy has an edge in normal conditions. The question is whether it can recognise when normal conditions no longer apply.
3. The Common Automation Mistake
The most common mistake intermediate automated traders make is treating a signal as sufficient justification for a trade. The signal fires; the order goes in. That logic works during the regime the strategy was built and tested in. It can fail when the regime shifts.
A mean-reversion system trained on moderate-volatility European equity sessions may interpret intraday swings driven by sanctions headlines as tradable pullbacks. Each time price moves away from the mean, the system enters. In a geopolitically stressed session, however, those moves may not be pullbacks to a stable mean—they may be competing forces reaching temporary equilibrium before the next headline. The system would be mean-reverting against a mean that is itself in motion.
Similarly, a trend-following system that captures breakouts may trigger on sector-level moves—energy down 1.6 per cent, travel up 1.7 per cent—and treat them as the start of sustained directional moves. Those moves were partly driven by oil price fluctuation within a single session. Whether the decline in oil persists depends on geopolitical developments that no technical signal can anticipate.
The problem is not using automation. The problem is failing to give automation a way to ask: Is the current market regime one where this signal class has a demonstrated edge? Without that gate, the strategy cannot assess its own operating conditions.
4. The Mechanism Behind the Risk
Understanding why automation can break under these conditions requires tracing the chain between macro events and execution quality.
Step One: Volatility Expansion
When geopolitical uncertainty increases, market makers widen spreads to protect themselves from informed order flow. A strategy that was profitable with a narrow spread on a euro-denominated instrument may face materially wider spreads during a sanctions announcement. That change alone can erode a marginal edge.
Step Two: Correlation Breakdown
Strategies that trade relationships between instruments—pairs trading, spread trading, or multi-leg systems—rely on correlations remaining within historical ranges. Macro repricing events can cause correlation breakdown. In the August 24 session, energy stocks fell while travel stocks rose within the same index. A system expecting those two sectors to move together would have been structurally misaligned for the entire session.
Step Three: Execution Slippage
Flat closes can contain violent intraday moves that are partly reversed by the close. A system that entered on an intraday signal may have executed at a price far from where the signal was generated, because the move happened faster than the order could be filled at the expected level. Slippage of this kind is typically worse during geopolitically stressed sessions.
Step Four: Stop-Hunt Vulnerability
During high-uncertainty sessions, price can sweep retail stop clusters at common technical levels before reversing—not as a directional move, but as a liquidity event. An automated system with stops at predictable technical levels is exposed to this: the position is stopped out, and the market then moves in the direction the system originally anticipated. The signal may have been correct; the execution environment destroyed the trade.
These four elements—spread widening, correlation breakdown, execution slippage, and stop vulnerability—can operate simultaneously during sessions like August 24. No individual element is necessarily fatal. The combination can be.
5. How to Test It in MetaTrader 5
The correct response to this risk profile is not to abandon automation. It is to build and verify regime awareness and execution guards before exposing capital. All testing described here should be performed on a demo account first.
Building a Volatility Regime Gate
MetaTrader 5's Strategy Tester and MQL5 environment allow you to construct explicit regime filters. A basic approach uses Average True Range as a volatility proxy, comparing current ATR to a rolling historical average. If current volatility is significantly above the historical norm, the system pauses new entries.
Below is a conceptual pseudocode representation of this logic. This is pseudocode only and does not imply it compiles or executes as written.
// PSEUDOCODE — regime gate concept, not production-ready MQL5 // Demonstrates intent only int atrHandle = iATR(_Symbol, PERIOD_H1, 14); double atrBuffer[]; // Copy recent ATR values using CopyBuffer CopyBuffer(atrHandle, 0, 0, 50, atrBuffer); // Compute a rolling average of ATR as the baseline double baselineSum = 0; for(int i = 1; i <= 50; i++) baselineSum += atrBuffer[i]; double atrBaseline = baselineSum / 50; double currentATR = atrBuffer[0]; double regimeMultiplier = 1.5; // threshold: current ATR > 1.5x baseline = elevated regime bool elevatedRegime = (currentATR > atrBaseline * regimeMultiplier); if(elevatedRegime) { // Suppress new entries; log regime state for review Print("Elevated volatility regime detected. New entries suppressed."); }
In a live MQL5 Expert Advisor, you would use iATR() to obtain an indicator handle, CopyBuffer() to retrieve values into a dynamic array, and ArraySetAsSeries() to control indexing direction. The pseudocode above reflects that architecture conceptually.
Adding an Event Calendar Gate
MetaTrader 5 includes a built-in economic calendar accessible via CalendarValueHistory() and related functions in MQL5. An event-aware system can query scheduled high-impact events within a defined time window around the current bar and suppress entries when such events are present.
This is directly relevant to sessions like August 24, where both the sanctions announcement and the forward-looking data calendar created identifiable windows of uncertainty. A system that pauses entries within a set period before and after high-importance calendar events reduces exposure to the slippage and stop-hunt risk described above.
Spread Monitoring
Use SymbolInfoTick() to retrieve the current ask and bid, compute the live spread, and compare it to a maximum acceptable spread threshold defined as an input parameter. If the live spread exceeds the threshold, the order is not sent. This directly addresses the first step of the risk chain.
Strategy Tester Verification
When running backtests in the MT5 Strategy Tester, use the Every tick based on real ticks model where tick data is available. Backtests using open prices only, or synthetic every-tick models, will not accurately reflect the spread and slippage conditions present during high-volatility macro sessions. After adding regime gates, run comparative tests covering periods that include known macro repricing events and assess whether the gates produced meaningful changes in drawdown behaviour. Analyse the results critically—backtested equity curves are not guarantees of future performance.
6. A Practical Decision Checklist
Before running any automated strategy during a session characterised by active geopolitical developments and scheduled high-impact data, work through the following gates. These assess observable conditions, not predictions.
- Regime check: Is the current ATR on your primary timeframe more than 1.5 times its 20-session average? If yes, treat as elevated regime. Reduce position size or pause entries.
- Spread check: Is the live spread on your instrument more than twice its typical spread during the same session hour? If yes, do not enter new positions.
- Calendar check: Are there high-importance economic releases scheduled within the next 60 minutes? If yes, hold entries until the release has processed and volatility begins to normalise.
- Correlation check: If your strategy trades correlated instruments, have those correlations behaved as expected over the last 10 bars? If divergence is significant and unexplained, treat it as a correlation breakdown signal.
- Geopolitical flag: Has a material unresolved geopolitical development been announced in the current session with no clear resolution timeline? If yes, apply elevated-regime treatment regardless of ATR reading, because headline-driven volatility can arrive faster than ATR updates.
- Stop placement review: Are your current stops placed at obvious round numbers or common technical levels that coincide with visible support and resistance? If yes, consider widening stops by one ATR unit to reduce stop-hunt exposure—and adjust position size accordingly to maintain consistent risk per trade.
- System log review: Has the system's trade log from the last five sessions shown unusual slippage, more frequent stop-outs than historical norms, or entries at prices significantly different from signal prices? If yes, pause live trading and investigate before continuing.
None of these gates predict what will happen next. They assess whether current conditions fall within the operating envelope your system was built to handle. If they do not, the responsible action is to reduce exposure or stand aside until conditions normalise—not because a loss is certain, but because the edge you tested for may not be present.
7. What to Do Before the Next Session
The August 24 session illustrates a durable truth about automated trading: a strategy is not a static object. It is a system operating within a dynamic environment, and its fitness depends on how well that environment matches the conditions under which it was built and tested.
The Iran sanctions development, the ECB repricing narrative, and the approaching data calendar are not isolated events. Money markets were already pricing a more hawkish ECB path toward 3 per cent by late 2027, and the week ahead included German and French GDP, the Ifo survey, and Spanish inflation. Each of those releases had the potential to confirm or challenge the prevailing hawkish narrative, and either outcome could produce significant repricing.
Before the next session, consider these concrete steps:
- Review your strategy's backtested performance during high-ATR periods specifically. Segment the backtest results by volatility regime and assess whether the edge holds across all regimes or only in moderate ones.
- Add spread and ATR logging to your EA if it does not already exist. Even a simple Print() statement writing live spread and ATR to the EA log at each bar gives you post-session data to analyse.
- Check the MT5 economic calendar for the week ahead and note the exact times of high-importance releases. Decide in advance whether your strategy will pause automatically around those times or whether you will manage that manually.
- Run the strategy on demo through any data-heavy period. Observe how it behaves around major releases. Compare actual execution prices to signal prices and assess slippage in real conditions without risking live capital.
- Document your observations in a session log. Note the regime state, any gates that triggered, and what the strategy did or did not do. Pattern recognition across multiple sessions is how intermediate traders build systematic edge—not by finding a better signal, but by understanding when their existing signals are operating within their tested environment and when they are not.
A signal is not enough. The session of August 24, 2026 is a concrete example of why. The Stoxx 600 closed flat—but beneath that number, the market was under significant stress from geopolitical uncertainty, inflationary narrative continuation, and central bank repricing. An automated system that treated the flat close as business as usual was exposed to spread widening, correlation breakdown, execution slippage, and stop-hunt risk at the same time.
Regime awareness, execution guards, and disciplined testing are the mechanism by which an automated strategy remains responsible to use across changing market conditions. Build the gates. Test on demo. Measure everything. Adjust before the market makes the adjustment for you.
Practical next step: If you want to evaluate this mechanism without forcing one strategy onto every market condition, the Ratio X Trader's Toolbox includes specialist MT5 systems for different jobs. Start on demo and examine how regime and volatility workflows apply to the context described above.
Real Screenshots From Ratio X Users
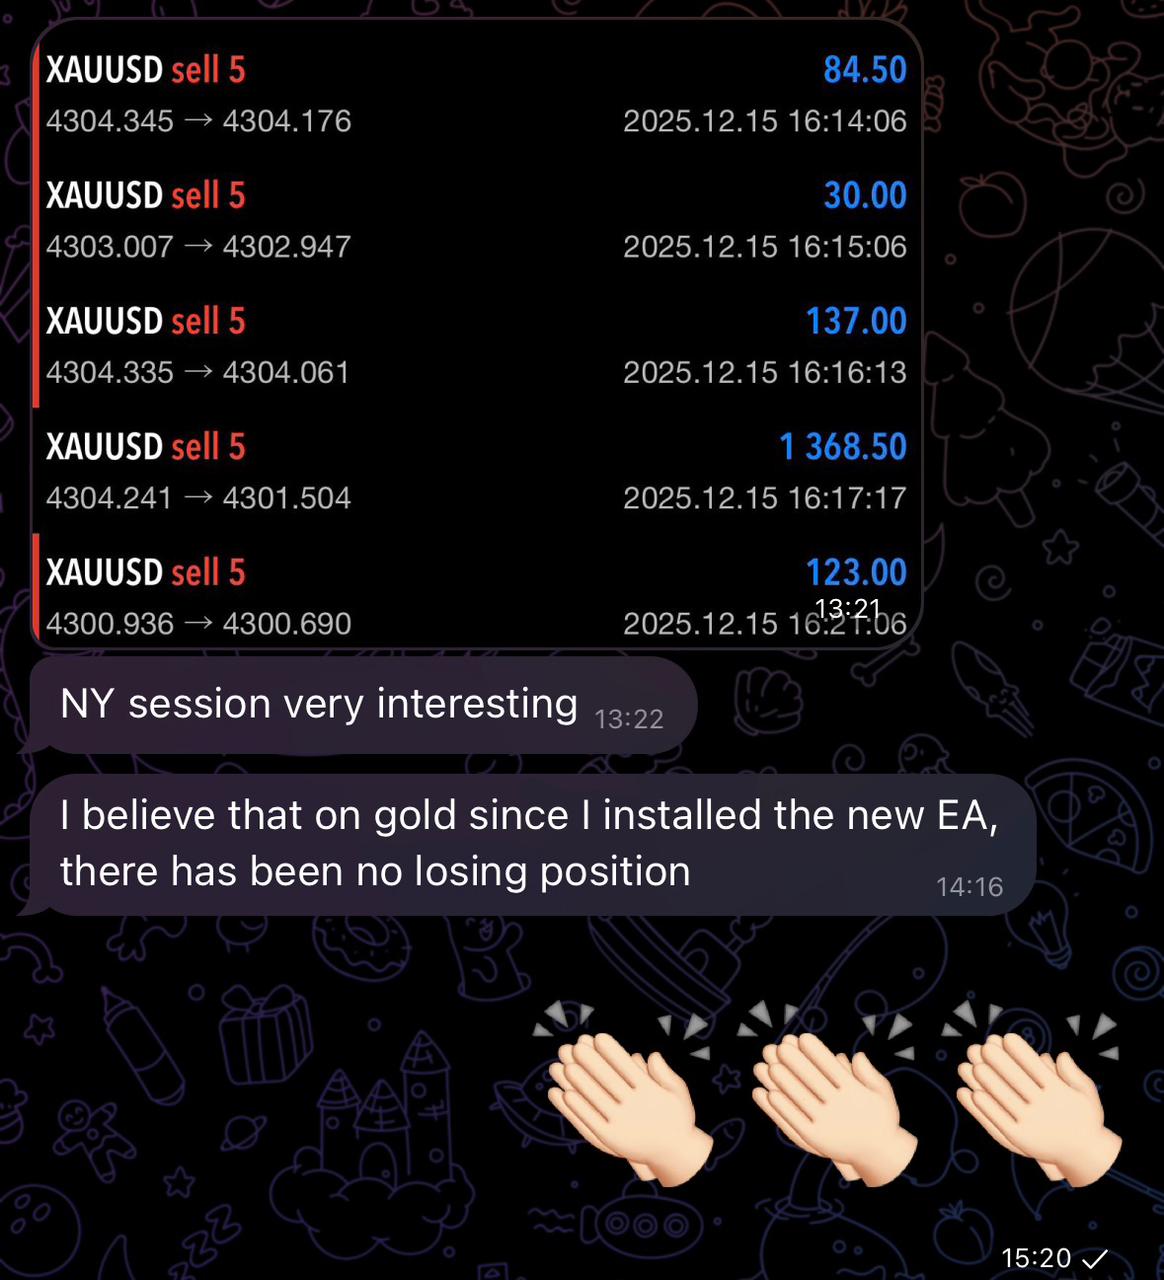 New York session activity shared by a Ratio X user
 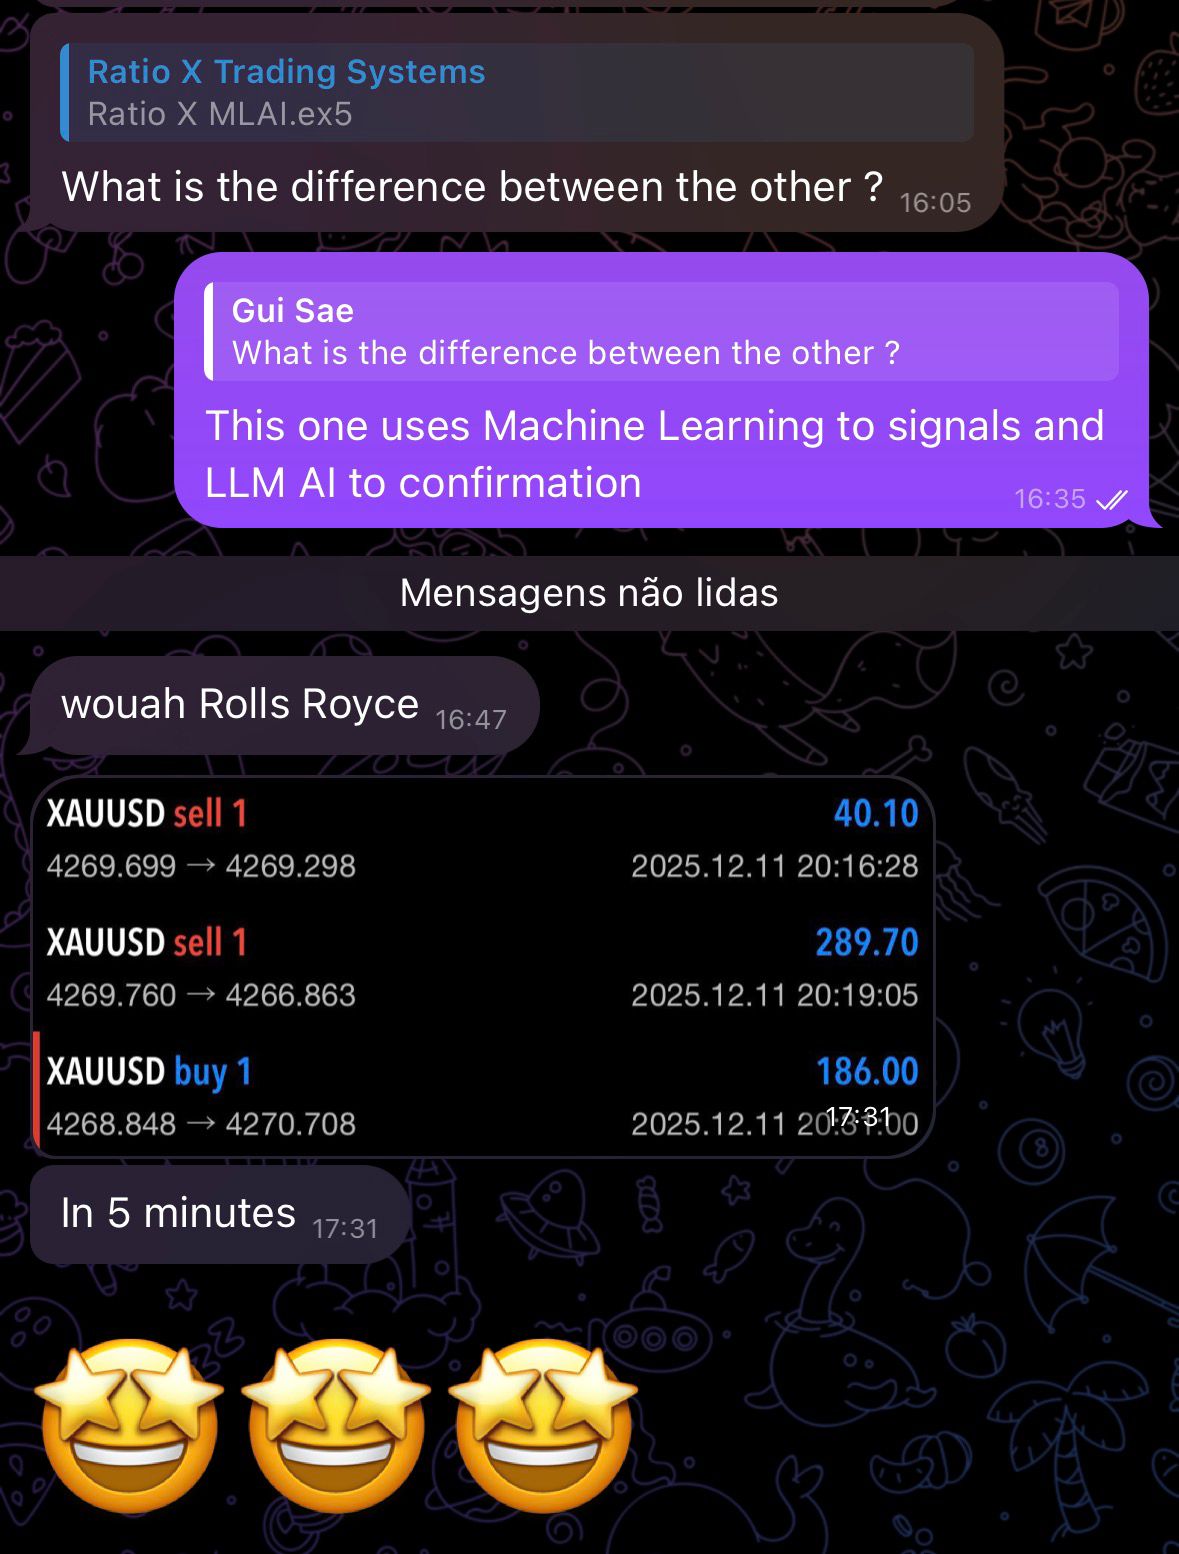 Screenshot shared by a Ratio X user
 These are real screenshots shared by Ratio X users. They are examples of individual outcomes, not typical or guaranteed results. Trading involves risk of loss.
Evaluate the Ratio X Trader's Toolbox on Demo
The Ratio X Trader's Toolbox brings together 10 specialist systems, including one indicator, for regime analysis, trend, range, breakout, execution and XAUUSD workflows. It is designed for structured evaluation—not guaranteed trading results.
Lifetime access is available for a one-time payment of $147, backed by a 7-day money-back guarantee. Test one relevant module on demo, follow its setup guidance and decide whether it fits your process.
Explore the Ratio X Trader's Toolbox
If the Toolbox is the right fit and price is the final obstacle, use MQLFRIEND20 for 20% off. Only 10 coupons are available per month.




