DIVERGENCE SCREENER
MQL5 Blogs = https://www.mql5.com/en/blogs/post/773190
MT4 Version = https://www.mql5.com/en/market/product/187704
MT5 Version = https://www.mql5.com/en/market/product/187705
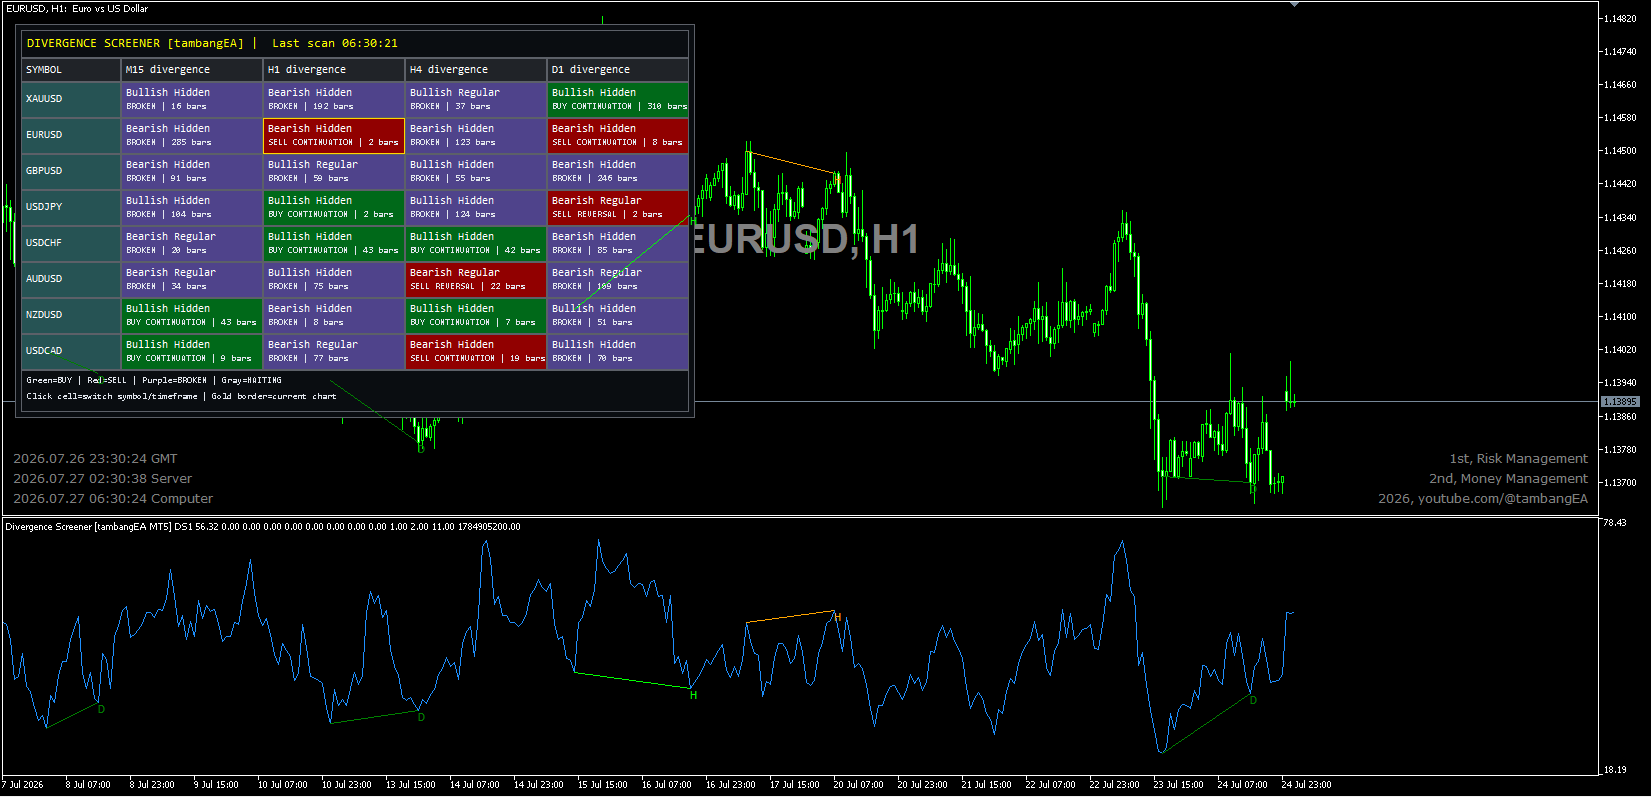
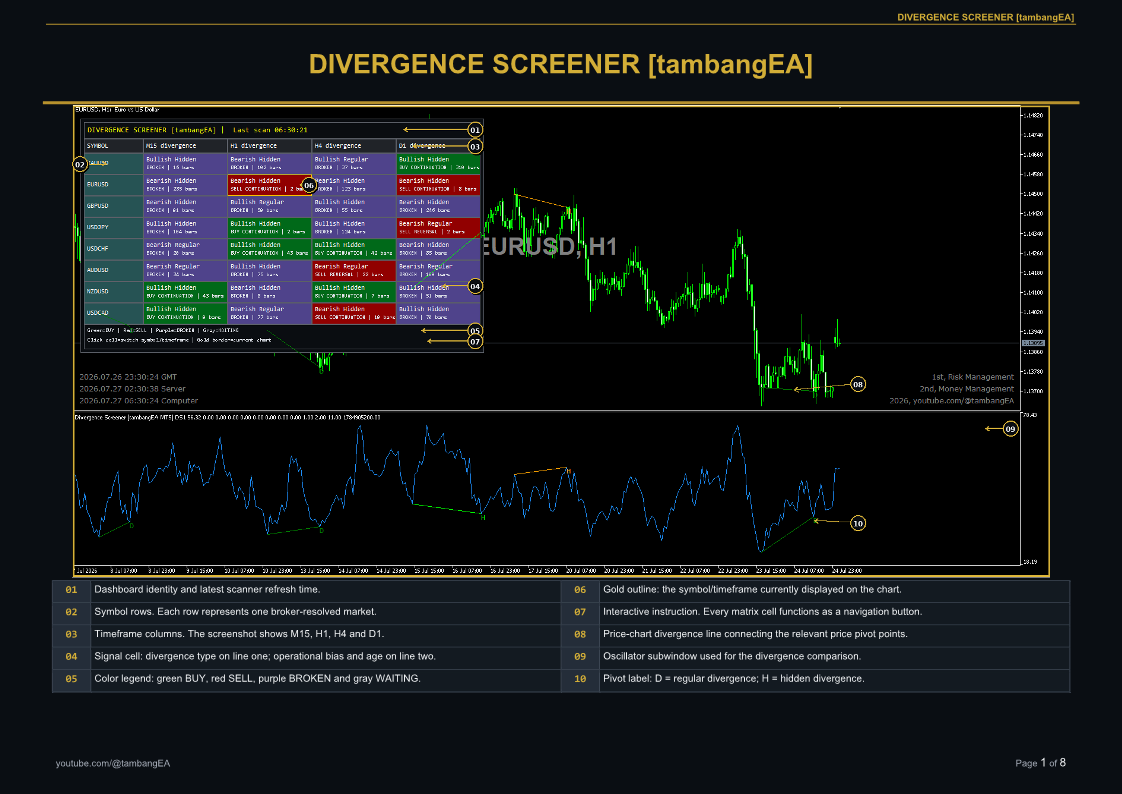
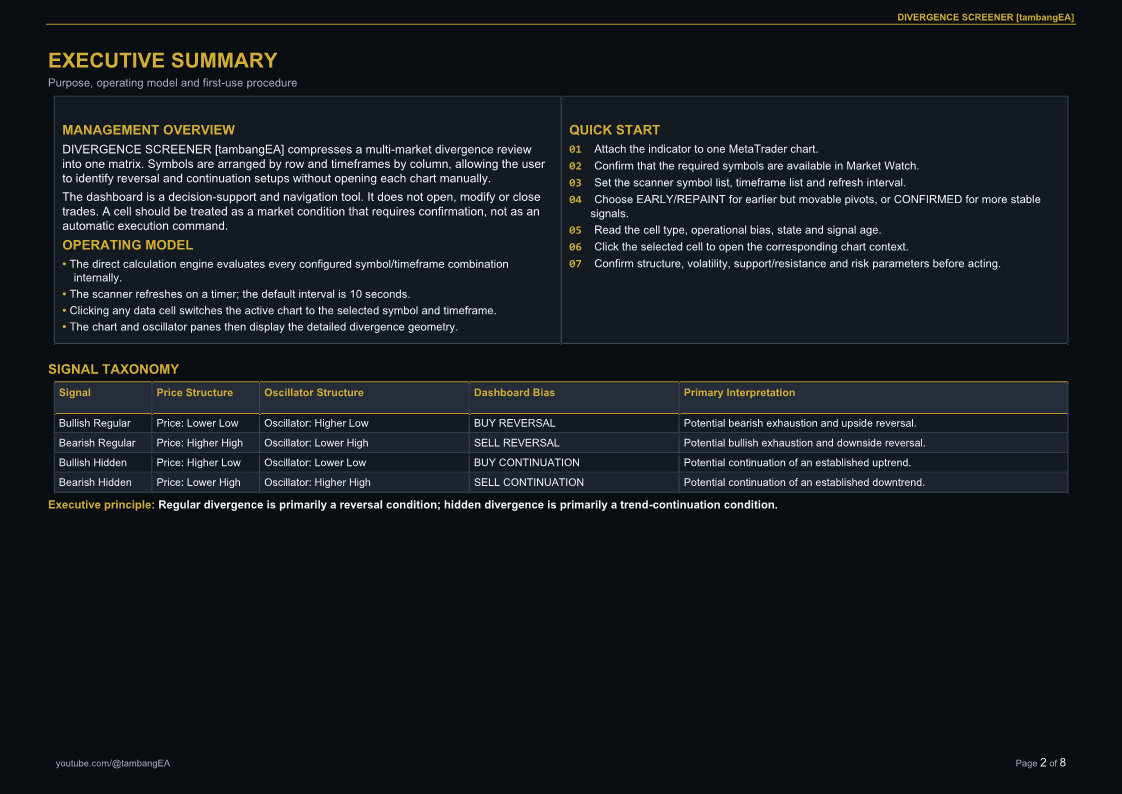
DIVERGENCE SCREENER [tambangEA] is a multi-symbol and multi-timeframe analytical dashboard designed to identify Regular and Hidden Divergence across multiple markets without requiring traders to open and inspect every chart manually.
The indicator organizes symbols into rows and timeframes into columns. Each dashboard cell shows the latest divergence classification, operational bias, current status, and signal age.
Click any dashboard cell to switch the active chart directly to the corresponding symbol and timeframe, then review the complete divergence structure on both the price chart and oscillator window.
The Problem
Traditional divergence analysis requires traders to:
- Open multiple charts.
- Change symbols repeatedly.
- Compare several timeframes manually.
- Inspect price and oscillator pivots one by one.
- Remember which signals remain valid.
- Track whether a divergence is new, active, old, or already invalidated.
This process is slow, repetitive, and difficult to manage when monitoring many markets.
The Solution
DIVERGENCE SCREENER [tambangEA] transforms divergence analysis into a structured command center.
From one dashboard, traders can immediately see:
- Which symbol has a divergence.
- On which timeframe it occurred.
- Whether the signal is bullish or bearish.
- Whether it is a reversal or continuation setup.
- Whether the divergence remains active or has been broken.
- How many bars have passed since the signal appeared.
The dashboard is not only a scanner. Every signal cell also works as an interactive chart-navigation control.
Key Features
Multi-Symbol Scanner
Monitor multiple broker symbols from one chart.
The default symbol list includes:
- XAUUSD
- EURUSD
- GBPUSD
- USDJPY
- USDCHF
- AUDUSD
- NZDUSD
- USDCAD
The symbol list is fully configurable.
Multi-Timeframe Analysis
Scan several timeframes simultaneously.
The default dashboard uses:
- M15
- H1
- H4
- D1
Supported timeframe tokens include M1, M5, M15, M30, H1, H4, D1, W1, and MN1.
Direct Internal Calculation Engine
Every symbol and timeframe combination is calculated directly by the indicator's internal engine.
The scanner does not recursively load another copy of itself through iCustom , helping provide a cleaner and more stable multi-market scanning architecture.
Interactive Dashboard Cells
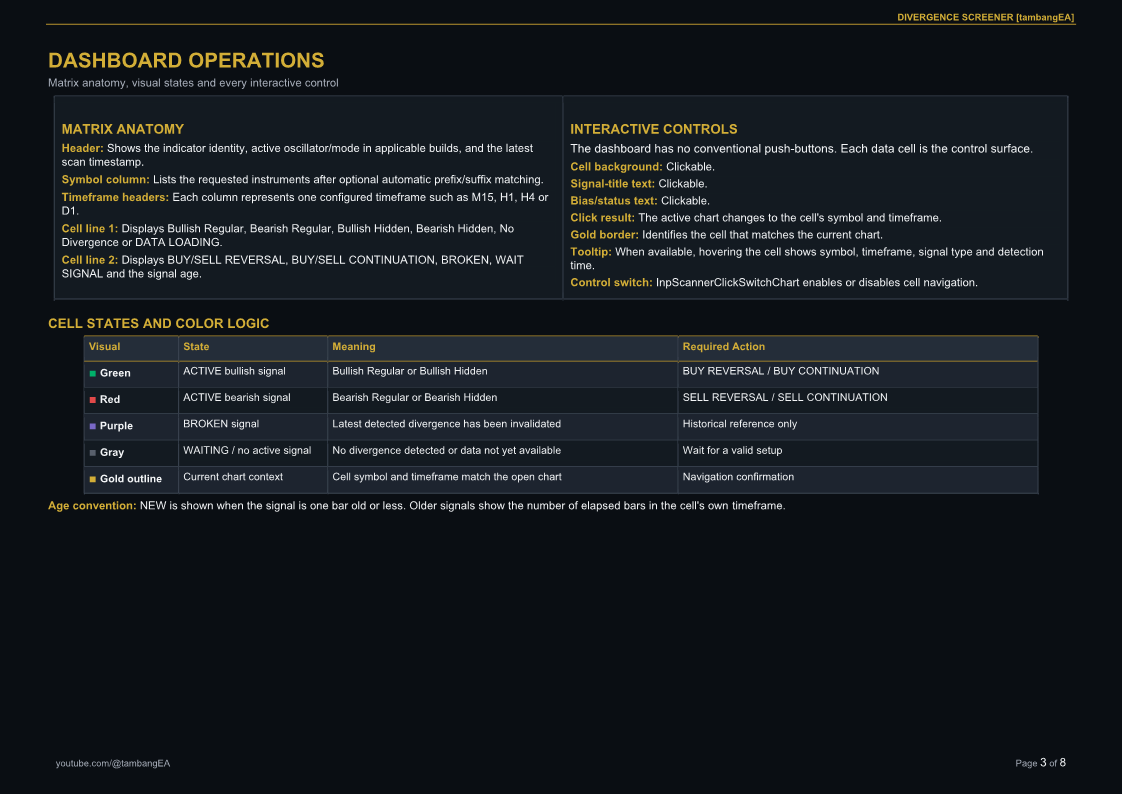
Every data cell is clickable.
Clicking a cell automatically changes the active chart to:
- The selected symbol.
- The selected timeframe.
A gold border identifies the cell that matches the currently displayed chart.
Automatic Broker Symbol Matching
The scanner can automatically recognize broker prefixes and suffixes.
Examples:
- XAUUSD
- XAUUSD.a
- XAUUSDm
- EURUSD.pro
- EURUSDb
This reduces the need to rewrite the entire scanner list for different brokers.
Four Divergence Classifications
Bullish Regular Divergence
Price forms a Lower Low, while the oscillator forms a Higher Low.
Dashboard interpretation:
BUY REVERSAL
This condition may indicate weakening bearish momentum and the possibility of an upside reversal.
Bearish Regular Divergence
Price forms a Higher High, while the oscillator forms a Lower High.
Dashboard interpretation:
SELL REVERSAL
This condition may indicate weakening bullish momentum and the possibility of a downside reversal.
Bullish Hidden Divergence
Price forms a Higher Low, while the oscillator forms a Lower Low.
Dashboard interpretation:
BUY CONTINUATION
This condition may support continuation of an established bullish trend.
Bearish Hidden Divergence
Price forms a Lower High, while the oscillator forms a Higher High.
Dashboard interpretation:
SELL CONTINUATION
This condition may support continuation of an established bearish trend.
Professional Signal Status System
Each dashboard cell displays both the divergence type and its current lifecycle status.
ACTIVE
The latest divergence remains valid according to the indicator's invalidation rule.
NEW
The active divergence is one bar old or less.
BROKEN
Price has closed through the divergence endpoint in the invalidating direction.
Broken signals remain visible as historical context, but they should not be treated as active setups.
WAIT SIGNAL
Calculation is complete, but no divergence is currently available.
DATA LOADING
The selected symbol or timeframe does not yet have sufficient historical data, or the terminal is still preparing the required series.
Color-Coded Dashboard
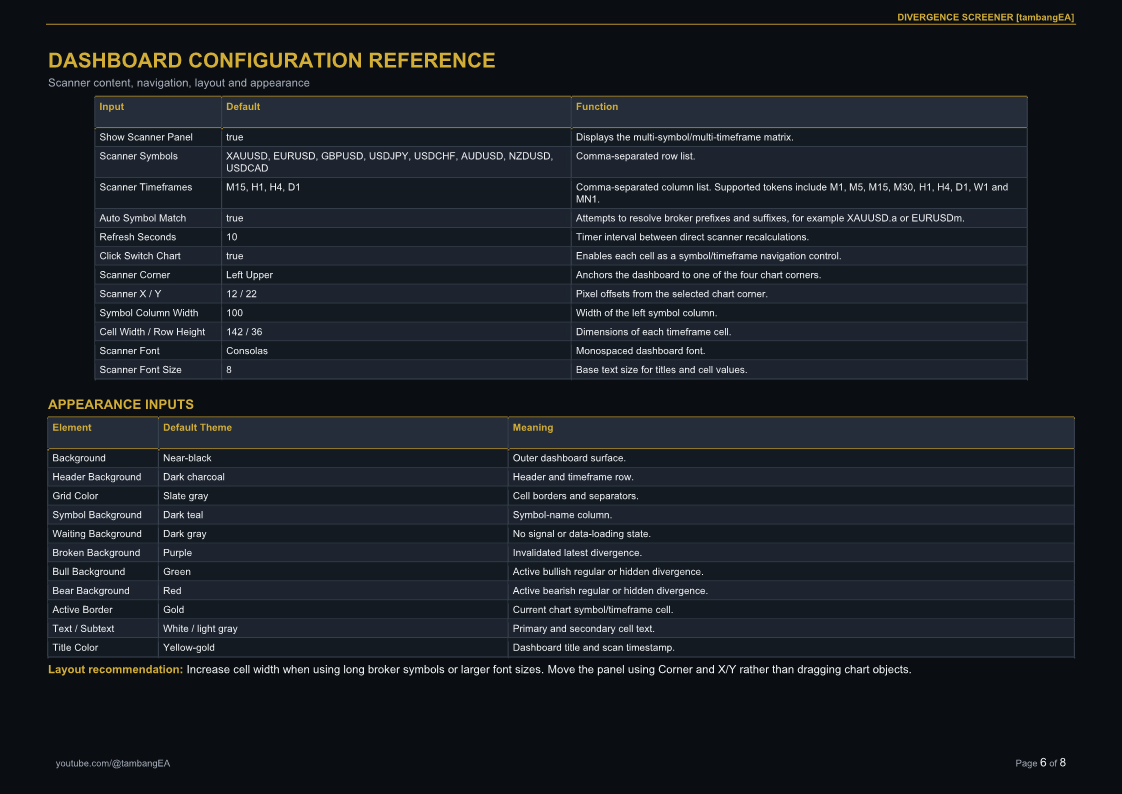
The dashboard uses an intuitive visual classification system:
- Green: Active bullish divergence.
- Red: Active bearish divergence.
- Purple: Broken or invalidated divergence.
- Gray: Waiting or data-loading condition.
- Gold border: Current chart symbol and timeframe.
The dashboard uses a modern dark interface with configurable colors and a professional Consolas font.
Price and Oscillator Confirmation
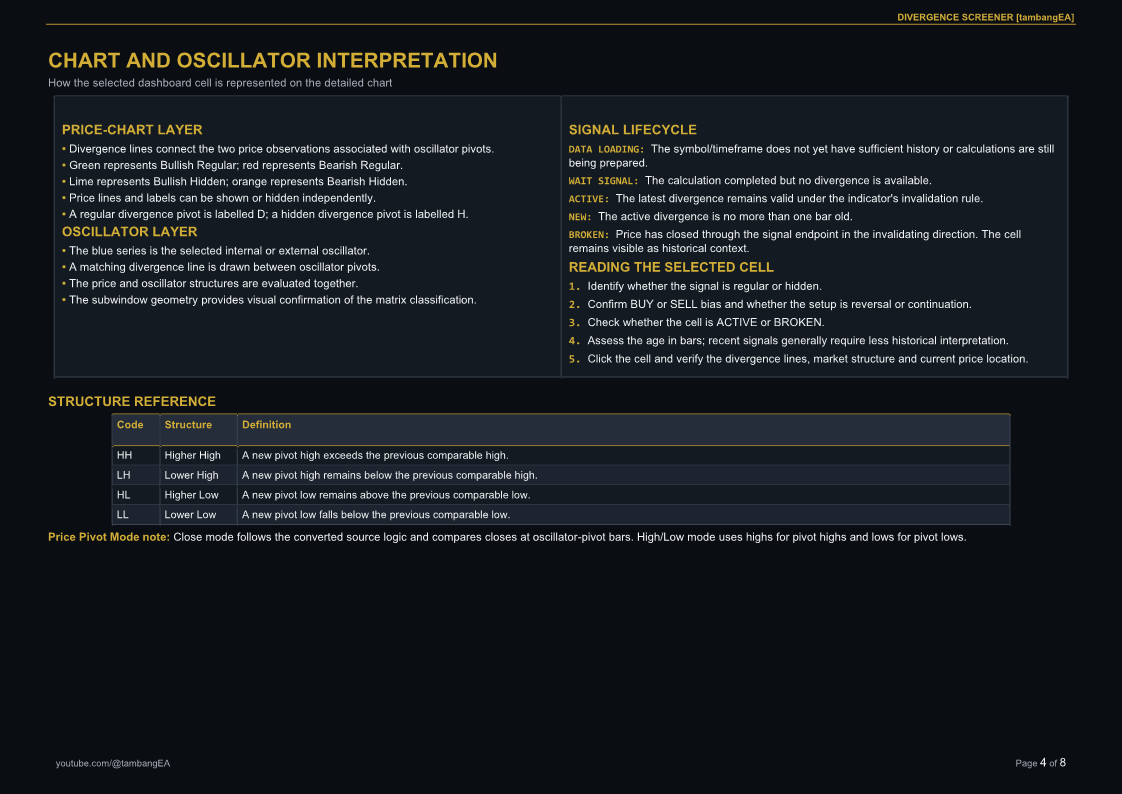
When a dashboard cell is selected, the indicator displays the detailed divergence geometry.
Price Chart
The indicator can display:
- Price divergence lines.
- Bullish and bearish color classification.
- Regular and Hidden Divergence labels.
- Configurable line style and width.
Oscillator Window
The oscillator window displays:
- The selected oscillator series.
- Matching oscillator divergence lines.
- Pivot labels.
- Visual confirmation of the dashboard classification.
Label convention:
- D = Regular Divergence.
- H = Hidden Divergence.
Eight Built-In Oscillators
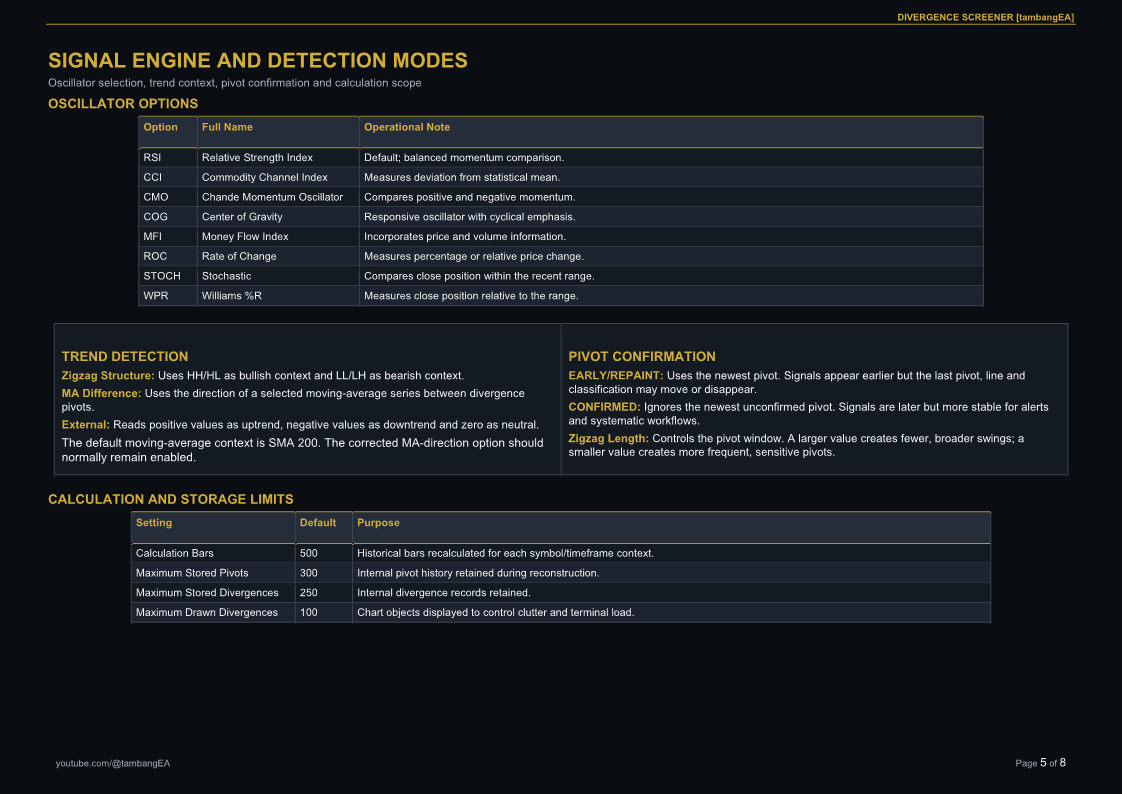
Choose from eight internal oscillator models:
- RSI — Relative Strength Index
- CCI — Commodity Channel Index
- CMO — Chande Momentum Oscillator
- COG — Center of Gravity
- MFI — Money Flow Index
- ROC — Rate of Change
- STOCH — Stochastic
- WPR — Williams %R
The indicator can also read an external oscillator through a configurable indicator name and buffer.
Three Trend Detection Methods
Zigzag Structure
Uses market structure around the divergence pivots:
- HH and HL as bullish context.
- LL and LH as bearish context.
MA Difference
Uses the direction of a configurable moving-average series between divergence pivots.
Multiple MA calculation models are available, including:
- EMA
- SMA
- RMA
- HMA
- WMA
- VWMA
- SWMA
- Linear Regression
- Median
- Momentum
- Highest and Lowest series
- Percent Rank
- High/Low midpoint
External Trend
Reads a selected external indicator buffer:
- Positive value = bullish trend.
- Negative value = bearish trend.
- Zero = neutral trend.
Early and Confirmed Signal Modes
EARLY / REPAINT Mode
Uses the newest developing pivot.
Advantages:
- Earlier signal detection.
- Suitable for active discretionary monitoring.
Important:
- The latest pivot may move.
- The divergence line may change.
- A signal may disappear before confirmation.
CONFIRMED Mode
Ignores the newest unconfirmed pivot.
Advantages:
- More stable divergence signals.
- Better suited to alerts and systematic workflows.
- Reduced dependence on a developing pivot.
Confirmed signals appear later because the next opposing pivot must first establish the previous pivot.
Price Pivot Modes
Close Mode
Compares closing prices at oscillator-pivot bars and follows the converted source methodology.
High/Low Mode
Uses:
- Candle high for pivot-high analysis.
- Candle low for pivot-low analysis.
This mode provides a more classical price-extreme interpretation of divergence.
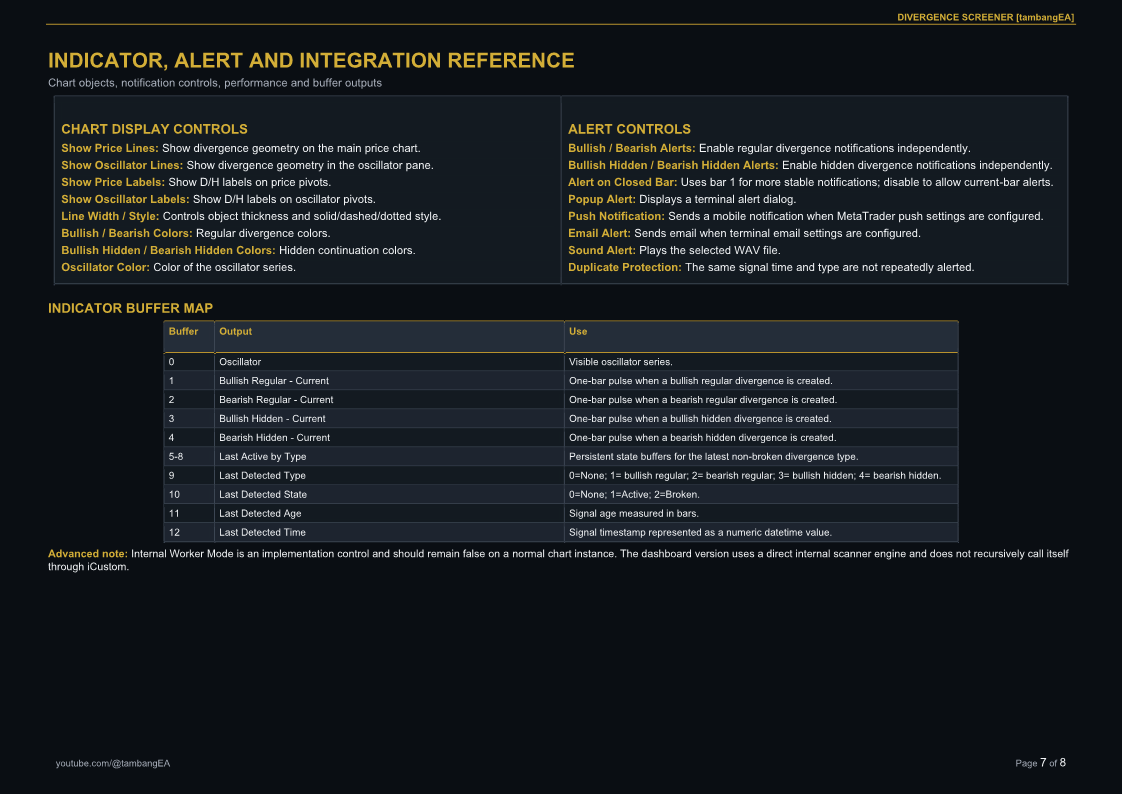
Flexible Alert System
Alerts can be enabled independently for:
- Bullish Regular Divergence.
- Bearish Regular Divergence.
- Bullish Hidden Divergence.
- Bearish Hidden Divergence.
Available delivery methods:
- MetaTrader popup alert.
- Mobile push notification.
- Email notification.
- Sound alert.
The user can also choose between:
- Closed-bar alerts.
- Current-bar alerts.
Duplicate-signal protection prevents the same divergence time and type from being repeatedly reported.
Customizable Dashboard
The scanner interface can be adjusted through inputs for:
- Symbol list.
- Timeframe list.
- Scanner refresh interval.
- Chart corner.
- X and Y position.
- Symbol-column width.
- Timeframe-cell width.
- Row height.
- Font name.
- Font size.
- Background colors.
- Bullish and bearish colors.
- Broken-state color.
- Waiting-state color.
- Grid color.
- Active-cell border color.
This allows the dashboard to fit different chart sizes, resolutions, and workspace layouts.
Advanced Integration Buffers
The indicator provides 13 output buffers for advanced users and EA integration.
Outputs include:
- Oscillator value.
- Current Bullish Regular signal.
- Current Bearish Regular signal.
- Current Bullish Hidden signal.
- Current Bearish Hidden signal.
- Last active signal by divergence type.
- Last detected divergence type.
- Last detected signal state.
- Signal age in bars.
- Signal detection time.
This makes it possible to read divergence conditions from another indicator or Expert Advisor through iCustom .
How to Use
- Attach DIVERGENCE SCREENER [tambangEA] to one chart.
- Make sure the required symbols are available in Market Watch.
- Configure the scanner symbol list.
- Configure the required timeframes.
- Select the oscillator and its period.
- Choose the trend-detection method.
- Select EARLY/REPAINT or CONFIRMED mode.
- Review green and red active cells.
- Check whether the setup is reversal or continuation.
- Review the signal age.
- Click the selected cell.
- Confirm the price and oscillator divergence geometry.
- Evaluate market structure, volatility, spread, and risk before making a trading decision.
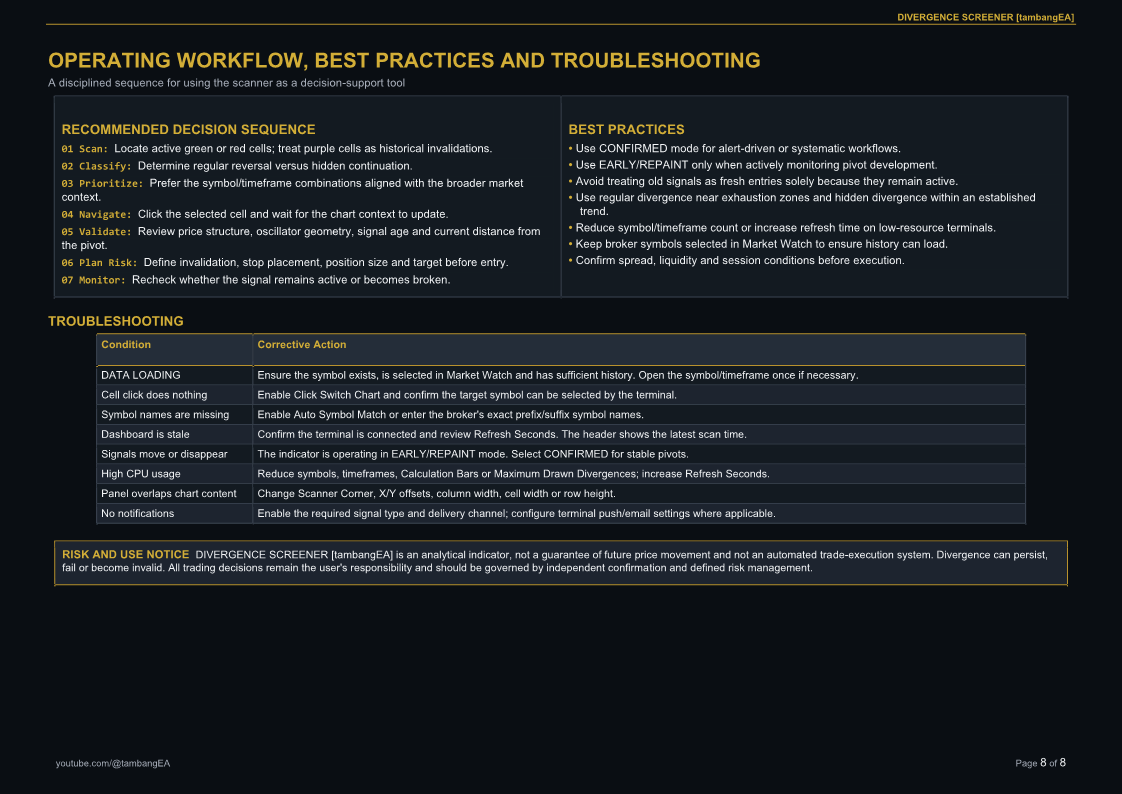
Recommended Workflow
Scan → Classify → Prioritize → Navigate → Validate → Plan Risk → Monitor
- Scan active dashboard cells.
- Classify Regular or Hidden Divergence.
- Prioritize suitable symbol and timeframe combinations.
- Click the selected cell.
- Validate the setup on price and oscillator charts.
- Define invalidation, stop loss, target, and position size.
- Monitor whether the signal remains active or becomes broken.