A Challenge Doesn't Break Where You're Looking. A Walkthrough of Prop Firm Vertical in FX Monitor

Three Days That Shouldn't Have Happened
Picture a $100,000 account. Phase one evaluation, 10% max overall drawdown, 5% daily. The trader — call him Alex — has five years behind him, a flat equity curve on his own account, steady monthly returns. He buys a challenge because it's the logical next step: the strategy works, only the capital is missing.
Day one: +1.2%. Day two: +0.8%. Day three opens with two good trades, equity climbs to +2.7% from the start, and then the market turns. Alex doesn't exit — by his system this is a normal pullback, he's sat through hundreds of them. The floating loss reaches −2.1% of current balance. By the evening the positions close near breakeven and the day ends at −0.3%.
On the morning of day four an email arrives: challenge failed. Daily drawdown breach.
Alex opens the firm's dashboard and can't make sense of it. On closed trades he lost 0.3% — how is that a 5% breach? He writes to support and gets the explanation: daily drawdown is measured on equity, the reference point is the higher of balance and equity at the start of the day, and since he'd been in profit on the previous days, that reference sat higher than he assumed. The floating loss crossed the line intraday. The challenge was closed automatically. The fee is non-refundable.
This story isn't about a bad strategy. It's about the fact that passing a challenge and trading profitably are two different problems, and solving the second one doesn't solve the first. The trader watched profit all day. The rule was watching an entirely different number — one he never saw for a single second.
Prop Firm Vertical is a module inside FX Monitor built around exactly this problem. Not "another trading journal with nice charts", but a layer that evaluates your account the way the firm evaluates it, and answers questions traders have had to close with intuition until now.
What follows is a walkthrough of the mechanics: what's inside, how to use it, and where the limits are.
Why the Firm's Dashboard and Your Trading Journal Don't Close the Gap
Before the features, it's worth pinning down what's missing from the tools that already exist.
The prop firm's dashboard shows you where you are right now. It's honest, but reactive: it updates with a lag, shows final numbers, and almost never explains how they were built. It won't tell you "at your current position size you're two moves away from the cutoff." It will tell you "breach" — after it happened.
A trading journal shows you where you were. It works on closed trades — and there's the core problem. Daily drawdown and every kind of trailing drawdown are computed on equity, not on closed trades. A journal physically cannot see the moment when a floating loss crossed the limit and then recovered. For the journal that event doesn't exist. For the firm it does, and it's fatal.
Neither of them offers a forecast. Neither answers "will I pass, and with what probability." Neither says "this firm doesn't fit your trading style." Neither dissects a failure and points to the trade that became the point of no return.
Prop Firm Vertical fills exactly that gap.
Part 1. The Rule Compliance Engine: Where Traders Actually Break
The core of the module is an engine that every incoming telemetry packet from the account is pushed through. Data arrives from the Expert Advisor at an interval determined by your plan — as fast as every 15 seconds. On every update the account state is re-evaluated against the rules of the specific firm.
Nine rule types are checked:
| Rule | What it checks |
|---|---|
| Overall drawdown | Drop below the allowed level from the reference point |
| Daily drawdown | Drop within the firm's trading day |
| Profit target | Progress toward the target |
| Trading days | Minimum active days and time limit |
| Consistency | Share of the best day in total profit |
| Hedging | Opposing positions on the same instrument |
| Mandatory stop-loss | SL present on open positions |
| Max lot size | Position size against the firm's limit |
| Max open positions | Number of simultaneously open trades |
But the list is less interesting than how the most dangerous of them is calculated.
Four Overall Drawdown Models — and Why This Matters
This is where most traders break, and — frankly — where most tools break too. "10% max drawdown" sounds like a single rule. In practice it's four different mechanics, and the difference between them can cost you the challenge.
static — the cutoff level is fixed from the starting balance and never moves. $100,000 account, 10% limit: the kill line sits at $90,000 and stays there even if you push the account to $120,000. The most forgiving model — the more you earn, the more room you have.
trailing_eod — the level trails the end-of-day balance high. Close the day at $105,000 and the line moves to $94,500. Tomorrow you can no longer fall where you could have fallen yesterday.
trailing_intraday — the level trails the equity high within the day. It reacts to floating profit you never even locked in. Push equity to $107,000 intraday, don't close, give it back — the line has already moved up and it isn't coming back. This is the model behind complaints of the "I was in profit and they disqualified me" variety.
trailing_to_static_lock — the level trails the peak until the account grows by a set percentage, after which it locks permanently. This model is the most common on funded accounts and by far the trickiest. Traders routinely mistake it for ordinary trailing and can't understand why the level stopped moving. Or the reverse — they assume it has already locked when the threshold hasn't been reached, and trade with a false sense of room.
Prop Firm Vertical supports all four and computes them the way the firm computes them. The last and most complex model is covered by a dedicated set of tests — this isn't "we think we handled it", it's pinned-down behaviour.
The practical upshot: the interface shows you the current cutoff level in money and the distance to it. Not "10% limit", but "$3,240 to the cutoff, level locked" or "$2,100 to the cutoff, level trailing the peak". Those are different situations and they call for different trading.
Is your drawdown still trailing the peak, or has it locked? If you don't know the exact answer, you don't know how much room you actually have.
Two Methods for Daily Drawdown
Alex's story from the opening is precisely about this. Daily drawdown is also computed two different ways:
- balance_start_of_day — measured from the balance at the start of the trading day;
- equity_high_water — measured from the higher of balance and equity at the start of the day.
The difference between them can amount to the entire daily limit. If you entered the day holding a position in profit, the first method gives you one reference point and the second a noticeably higher one — which means a much closer daily boundary. The module knows which method your firm uses and shows that firm's number.
The Severity Ladder
Every rule gets a status on a scale: ok → info → warning → critical → failed . The challenge's overall state is the worst of all rules — one red rule colours the whole challenge.
One important nuance in the logic: a breach is treated as fatal only for drawdowns — daily and overall. All other rules escalate to critical at most and do not kill the challenge automatically. That's deliberate: on consistency, hedging or lot size, the disqualification call belongs to the firm, not to a third-party service. We show that the rule was broken and don't pretend to know the verdict.
Part 2. Shadow Modes: Training Under Real Rules Without Buying a Challenge
This is arguably the most underrated part of the module. Four challenge modes are supported in total, and two of them are shadow modes.
Real Challenge
Live mode. Attaches to a live account only. One active real challenge per account — protection against confusion. Full set of alerts and notifications.
Demo Shadow — Firm Rules on a Demo Account
You attach a demo account but take real rules — any rule set from the library. From there the system evaluates you the way the firm would: the same overall drawdown with the same trailing model, the same daily cutoff by the same method, the same alerts, the same thresholds.
Why it matters. First, you get to try a specific firm's rules before paying for the challenge. A challenge fee on a $100,000 account runs into several hundred dollars, and discovering with your own money that a 4% daily limit is incompatible with your style is an expensive lesson. Second, you rehearse discipline under limit pressure. Trading under someone else's rules is psychologically different from trading your own account: there's now a boundary where everything ends, and it's worth getting used to that feeling in advance.
Live Shadow — Firm Rules on Top of Your Live Account
The second shadow mode overlays a firm's rules onto an active real account at an ordinary broker. You trade your own money as usual while the system runs a parallel virtual challenge and shows you whether you'd be passing right now or would already be out.
This is an honest mirror for two groups. For those who haven't bought a challenge yet, it answers "am I ready for prop trading at all". For those already trading, it shows how compatible their habitual style is with someone else's limits. Very often the strategy turns out to be profitable while its drawdown profile simply doesn't fit the box.
The Key Difference of Shadow Modes
The "one active challenge per account" restriction does not apply to shadow modes. That opens up the main use case: you can attach several rule sets from different firms to the same account and compare — simultaneously, on the same trades.
In other words, you trade as usual while the system runs five virtual challenges under five different firms' rules and shows you whose you'd already have passed, whose you're sitting on the edge of, and whose you'd have blown up in week two. This isn't a hypothesis or a backtest — it's your actual trading, projected into five coordinate systems.
Retroactive
The fourth mode is a challenge created after the fact on historical data. Immutable once created, because its outcome is already determined by history. More on it in the next section, where it comes into its own as an analytical tool.
The dashboard lets you filter challenges by mode — real, shadow, retroactive — so that shadow experiments don't get in the way of the real picture.
Part 3. Analytics: Four Tools, Four Different Questions
Retroactive — "Would I Have Passed?"
The tool takes your account's real history, applies a chosen rule set and replays it day by day through the very same compliance engine that runs in real time. Not through a simplified formula — the same logic, the same trailing models.
Three possible outcomes: you'd have passed, you'd have failed, or the window was too short to reach the target. If you'd have failed, it tells you exactly when and on which rule.
A separate feature is the risk multiplier. The same history can be re-run at double or half the volume. This is a direct answer to "what if I'd traded more aggressively" — and it's often sobering: doubling the lot size regularly turns a comfortable pass into a week-two failure, because drawdown scales linearly while your buffer does not.
The result is saved as a separate retroactive challenge and stays in history so scenarios can be compared side by side.
You already have six months of trading history. Run it through a firm's rules and get the answer before you pay for the challenge.
Rolling Window — a "When to Start" Heatmap
An extension of the previous tool, and to my mind the most interesting analytical idea in the whole module.
A single retroactive run answers "would I have passed if I'd started on this day". The problem is that the answer depends heavily on the start date — which makes a single run of limited value. Start a week earlier and the result could be the opposite.
Rolling Window runs the retroactive simulation across every possible window of the firm's time limit, shifted one day at a time, over the account's entire available history. Then it builds a heatmap: one outcome per start date.
This moves the question out of "was I lucky" territory and into statistics. If out of 120 possible start days you'd have passed on 34, your actual odds are around 28% — not "well, I'm profitable overall". The difference between those two statements is the difference between a decision based on data and a decision based on self-assessment.
The map is interactive: clicking any day creates a full retroactive challenge on that window, so you can drill into a specific scenario and see what happened day by day. The risk multiplier works here too — you can watch the whole map recolour as volume changes. Both MT4 and MT5 are supported.
You'd have passed the challenge if you'd started in March. And blown it if you'd started in April. Here's the map.
Forecaster — Pass Probability via Monte Carlo
A tool for those trading Expert Advisors. It works on backtest data: you pick a strategy report and a firm's rule set and get a probabilistic forecast.
Mechanics: 2,000, 5,000 or 10,000 simulations, 5,000 by default. The sampling method is chosen automatically — bootstrap over the real trades from the report, or parametric generation when the sample is small (under 30 trades). The simulation horizon equals the firm's time limit, or 180 days if there is no limit.
The output isn't a single number but a breakdown:
- pass probability;
- failure causes split by type — daily drawdown, overall drawdown, time limit exceeded;
- median days to pass, plus the 5th and 95th percentiles, i.e. the optimistic and pessimistic scenarios;
- share of runs that never reached the target within the horizon;
- an explicit list of which rules took part in the calculation and which didn't.
That last item deserves a note. The tool displays an honest warning: a backtest contains no intraday equity, so real drawdowns may cross the limit slightly earlier, and for trailing rules the estimate is somewhat optimistic. That's a deliberate choice — users pick a firm based on this number, and staying quiet about the margin of error would be dishonest.
It's important to understand the boundary: Forecaster answers "will this strategy pass", not "will I pass my current challenge". It's a selection and tuning tool, not a monitoring one.
Your EA is profitable. But will it pass a challenge? Thousands of simulations give you an answer in percent instead of a feeling.
Counterfactual — "What Went Wrong"
Runs on a challenge that has already failed. The tool reconstructs the history and searches for the minimum change that would have produced a different outcome. Three objectives to choose from:
- avoid failure — what you'd have needed to do to survive;
- maximise profit — where profit was left on the table;
- minimise drawdown — what contributed most to the drawdown.
The result is interpreted by an AI model and delivered as connected prose: which trade or sequence proved decisive, what would have changed without it, what to do differently next time.
Worth noting separately: the tool correctly distinguishes three fundamentally different situations — failure driven by closed trades, failure driven by intraday floating drawdown while closed trades looked perfectly fine (Alex's case), and the case where the challenge wasn't actually failed at all. Those are different diagnoses and they call for different treatment.
The challenge is gone. One trade or a systemic problem? Answer in 30 seconds.
Recommender — Matching a Firm to Your Style
A tool that inverts the usual selection logic. Traders typically look for the firm with the softest rules or the biggest split. Recommender suggests looking for the one whose rules match how you already trade.
It analyses the last 90 days of trading and builds a style profile: average holding time, average and maximum lot size, trades per day, distribution across sessions (Asia / London / New York), weekend holding, drawdown profile (max and average daily, max overall), profit evenness.
It then runs that profile against every rule set in the library and assigns a compatibility score from 0 to 100 — with an explanation: three arguments for and three against, in plain text. For example: "your worst day of −4.8% already exceeds the 4% daily limit", or "you hold positions over the weekend and this firm prohibits it".
The scoring also accounts for the fact that trailing drawdown is objectively stricter than static — trailing rule sets take a scoring penalty, all else being equal.
Don't look for the firm with the softest rules. Look for the one whose rules match how you already trade.
Part 4. Monitoring and Alerts
Analytics answers the "before" and "after" questions. A different layer runs in real time.
Warning thresholds are configured per challenge — for daily and overall drawdown. The recommended value of 80% of the firm's limit is pre-filled by default, but the threshold is set manually: some prefer a signal at 60%, others only want to hear about it at 90%.
Individual toggles for each event type: daily drawdown, overall drawdown, target reached, actual breach. Keep only what you need and skip the noise.
Channels — push notifications and Telegram, enabled independently. Anti-spam — a cooldown between repeat notifications, 30 minutes by default, so that one volatile session doesn't turn into forty messages.
A separate stream carries alerts for non-drawdown rule breaches — consistency, hedging, lot size, missing stop-losses — when they reach a critical level.
On top of that, each challenge keeps an event log: creation, start, pauses and resumes, warnings, critical states, breaches, milestones, rule set changes, manual notes. It's both material for a later review and an evidence trail if a dispute with the firm comes up.
A technical point worth mentioning: the system tracks and stores peaks — the all-time equity high and the all-time balance high. Trailing drawdown levels are anchored to those, and without a correctly preserved peak history they can't be computed properly. When old snapshots are thinned out, extremes are never discarded — equity minima and maxima are always kept, because the entire calculation rests on them.
Part 5. Rule Set Library and Rule Freezing
Rule sets are tied to a firm, a phase and an account size. Phases: first evaluation, second evaluation, verification, funded, custom.
Two mechanisms here deserve attention.
Versioning. Each rule set carries a version number and a pointer to the set that superseded it. When a firm changes its terms, the old set isn't overwritten — it's marked as replaced. That keeps history correct: a challenge started in March is judged by March's rules, not July's.
Immutable snapshot. When a challenge is created, the rules are copied into it in full and frozen. Even if the firm changes its terms tomorrow and the library updates, your running challenge continues to be evaluated under the rules you started it with. That's protection against retroactive surprises — the terms of the game changing mid-match.
The library comes with search and a comparison table: daily limit, overall limit with the trailing type spelled out, target, minimum days, time limit, weekend holding, hedging, mandatory SL, consistency — all in one place, without touring the firms' websites.
Part 6. Custom Rules — When You Need Your Own
The builder lets you assemble your own rule set. Configurable:
- daily loss limit in percent and its calculation method;
- daily reset timezone;
- overall limit and its type — all four models, including the lock threshold for trailing_to_static_lock ;
- profit target;
- time limit and minimum active days, plus the criterion for what counts as an active day (including "the day only counts if closed profit exceeds X%");
- consistency rule with a maximum share for any single day in total profit;
- weekend holding, hedging, mandatory stop-loss;
- news trading restriction with a buffer in minutes.
There's a sanity check on validation: a set with no limit and no target can't be created.
Custom sets participate in every tool on equal footing with the official ones — you can run a challenge on them, run retroactives, build a heatmap and compute a forecast.
Three scenarios that come up most often:
- The firm isn't in the library yet. Build a set from its terms and every tool works.
- Your own constraints are stricter than the firm's. A classic self-discipline technique: the firm allows 5% a day, you set yourself 3% and get a warning long before the real boundary.
- A manager's or investor's rules. If you trade someone else's money under agreed constraints, those digitise into a rule set just as easily.
Are your own rules stricter than the firm's? Build the set and live by it — the system will warn you before the firm does.
Part 7. AI Assistant With Your Challenges in Context
A dedicated chat you can connect specific challenges to. The model sees their state: rules, current metrics, history, breaches. Conversation history, multiple parallel chats and ready-made prompts for a quick start are all supported.
In practice it looks like this: instead of cross-referencing numbers across five tabs yourself, you ask "why am I in warning status" or "what's keeping me from hitting the target on this challenge" and get an answer grounded in your actual account data rather than general reasoning.
The model understands the difference between a real and a shadow challenge and doesn't mix them up in its recommendations — which matters when several shadow rule sets are running on one account at once.
Prompts for the analytical write-ups live in an administrable, versioned catalogue: each scenario (counterfactual analysis, forecast summary and so on) has versions, and the active one is switched without touching code. Analysis quality improves without a client update.
Request consumption is visible in the interface — a counter of used versus available on your plan, no surprises.
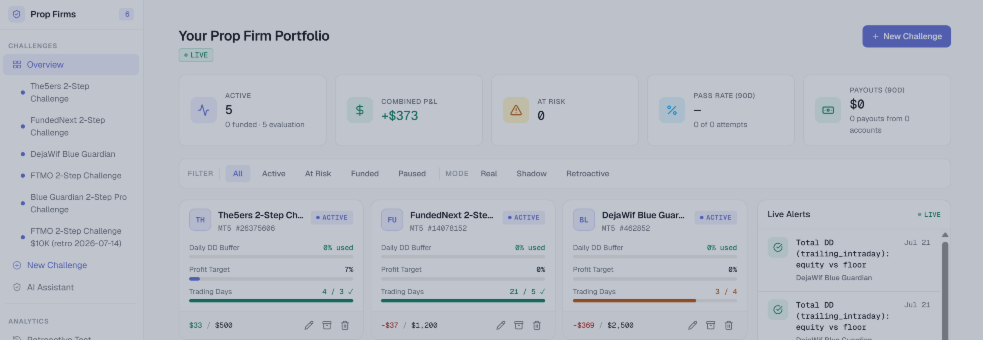
Part 8. Dashboard: Five Top-Level Numbers
A summary across your entire challenge portfolio:
- active challenges, split into funded and evaluation;
- total capital under management;
- challenges at risk — what to look at first;
- pass rate — how many passed out of how many attempts;
- payouts — amount and count, with the number of accounts they came through.
Filters by status (all / active / at risk / funded / paused) and by mode (real / shadow / retroactive), plus a feed of recent alerts.
The challenge lifecycle is fully covered: creation, pause and resume, rename, archive, delete. Separately, there's reopening a failed challenge — if the firm was accommodating and restored the account, the challenge returns to active status with peaks correctly recalculated. Retroactive challenges can't be reopened: their outcome is determined by history.
A challenge survives the archiving of its trading account correctly — no data is lost and the card stays readable thanks to a stored snapshot of the account details.
The interface is available in 11 languages: English, Russian, Ukrainian, German, Spanish, French, Italian, Portuguese, Indonesian, Malay, Arabic. MT4 and MT5 are both supported.
What the Module Doesn't Do — and Why That's Worth Saying Plainly
The section marketing materials usually omit. But if you're making a decision about money, the limits of a tool matter more than its capabilities.
This is not a replacement for the firm's dashboard. The source of truth on disqualification is the firm's server. Prop Firm Vertical's figures are based on account telemetry and are accurate within the update interval. The right framing is independent monitoring and forecasting — not official challenge status.
Not every firm rule is monitored. In real time the engine checks the nine rule types listed above. News trading restrictions and weekend holding can be configured in the builder, are stored and are taken into account when matching a firm — but they are not checked in real time. The claim "we monitor compliance with all of a firm's rules" would be false.
The trading day boundary is currently determined without adjusting for the broker server's timezone. At some brokers, trades in the first two or three hours after the reset may land in the neighbouring day. Work on this is planned; until then, treat daily drawdown as a very accurate reference rather than a byte-for-byte copy of the firm's calculation.
Forecaster is not a live-account forecast. It works on backtest reports and answers "will this strategy pass", not "will I pass my current challenge".
The system doesn't close positions. It warns — in advance, at your configured thresholds, via push and Telegram — but it doesn't intervene in your trading. That's a deliberate product decision: an analytics service doesn't take on responsibility for execution. "Won't let you blow the account" would be a lie; "will warn you in advance" is accurate.
The Bottom Line: Three Questions That Now Have Answers
Back to Alex from the opening. What would have been different with Prop Firm Vertical.
Before buying the challenge, he'd have run his six-month history through Rolling Window and seen the map: out of a hundred-plus possible start days, here's the share where he'd have passed. And he'd have checked Recommender to see which firm fits his profile — quite possibly a firm using equity_high_water with a 5% daily limit would have scored low, with the note "your intraday drawdown profile conflicts with this limit".
During the challenge, he wouldn't have been watching "+2.7% profit" but the distance to the daily cutoff in money, computed by his firm's method. And he'd have received a push at 80% of the limit — roughly an hour before it all ended.
After the failure, Counterfactual would have told him in thirty seconds what took a week of support emails to establish: the failure came not from closed trades but from intraday floating drawdown, one specific position was decisive, and here's what needs to change in the approach.
Passing a challenge is a separate skill layered on top of trading. You can learn it with your own money, one attempt at a time — or in shadow mode, retroactives and heatmaps, where a mistake costs nothing.
Prop Firm Vertical is part of FX Monitor. Data is supplied by an Expert Advisor for MT4 and MT5; the update interval depends on your plan and goes down to 15 seconds. Shadow modes work on demo accounts as well.