
Mastering XAUUSD Daily: What Smart Traders Are Watching Today, April 1,2026

“The hardest part of trading is not analysis, it’s self-control.”
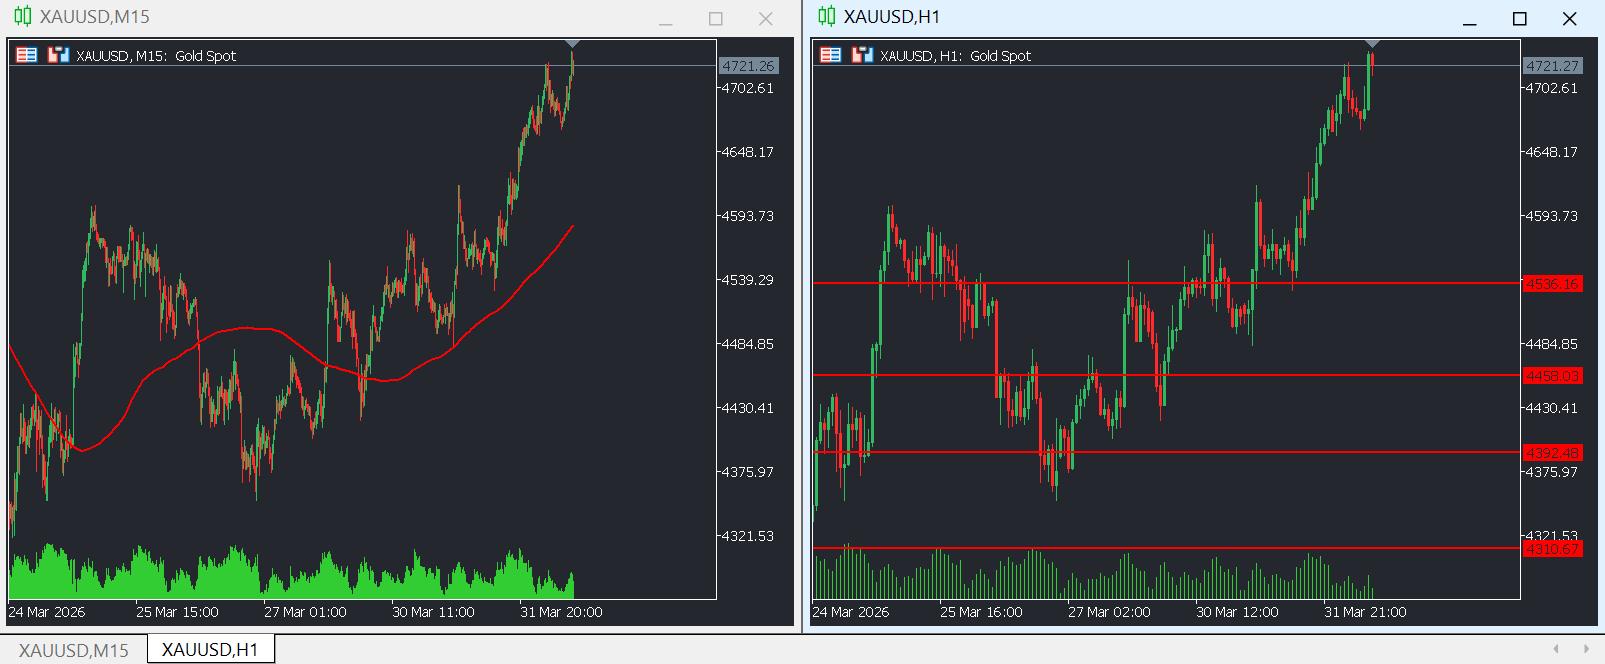
We'll examine what the chart actually conveys today, including where buyers and sellers are active, which levels are crucial, and how momentum is shifting in real time.
Before we begin, I would like to share with you the best ways to use MQL4 and MQL5 to transform your trading strategies into extremely profitable machines. In order to teach traders how to construct MT4 and MT5 trading algorithms from the bottom up, I have created basic instructions.
📘LEARN HOW TO DEVELOP THE PERFECT TRADING ALGORITHM FOR MT4
📘LEARN HOW TO DEVELOP THE PERFECT TRADING ALGORITHM FOR MT5
A powerful system/ trader assistant tool designed to enhance analysis, improve timing, and give traders a structured approach to market execution.
Market Overview
Gold (XAUUSD) is showing signs of recovery on April 1, 2026, currently trading at approximately $4,677.35 per ounce, as traders digest the aftermath of March's dramatic sell-off that saw the precious metal crash over $800 from above $5,000 to lows near $4,700. The metal is attempting to stabilize after what has been one of the most aggressive bearish phases in recent decades, triggered by a hawkish Federal Reserve pivot and stronger-than-expected inflation data.
Today's session has opened at $4,511.17 and has seen prices oscillate between $4,482.88 and $4,619.14, reflecting moderate intraday volatility as markets attempt to find a bottom after the steep decline. According to current forecasts, XAU/USD may continue to recover on April 1, 2026, with technical indicators showing early signs of bullish momentum building.
Current Market Context
The dramatic context of gold's recent price action cannot be overstated. After spending most of early 2026 consolidating near all-time highs above $5,000, gold lost approximately 6% in two consecutive sessions in mid-March, crashing through the psychologically critical $5,000 barrier and extending the decline to $4,700 per ounce on March 19, 2026 - the lowest price since early February.
Key Price Levels (April 1, 2026):
- Current Price: $4,677.35
- Opening Price: $4,511.17
- Today's Range: $4,482.88 - $4,619.14
- Previous Close: $4,511.17
- All-Time High: $5,595.46 (January 29, 2026)
- Recent Low: ~$4,700 (March 19, 2026)
- Year-to-Date Change: +4.23%
- 52-Week Range: $2,956.60 - $5,595.46
- 1-Year Change: +45.79%
What Triggered the Crash?
The mid-March crash was triggered by a confluence of factors:
-
Hawkish Fed Pivot: The March FOMC decision held rates steady (as expected at 90%+ probability), but what caught markets off guard was the hawkish tone of the dot plot. The Fed trimmed its 2026 rate cut projections from two cuts to one, citing hotter-than-expected producer inflation.
-
Inflation Concerns: February's PPI came in at +0.7%, well above consensus, signaling that the Strait of Hormuz-driven oil spike is creating inflation persistence that prevents easing.
-
Rising Yields: The 10-year Treasury yield jumped to 4.2%, and the Dollar Index climbed toward 99.9, creating headwinds for non-yielding gold.
-
Technical Break: The break below the 50-day MA near $4,978 and below the $5,000 psychological level triggered momentum selling and profit-taking from crowded longs.
-
Oil-Gold Paradox: The irony is that gold is being sold during an active Middle East conflict precisely because the oil shock from that conflict is reigniting inflation and forcing the Fed to stay hawkish. Higher oil → higher inflation → higher-for-longer rates → gold suffers despite the geopolitical backdrop that should theoretically support it.
H1 Timeframe Analysis: The Recovery Pattern
Market Structure & Bottoming Formation
On the hourly (H1) chart, XAUUSD is displaying classic bottoming characteristics after the steep sell-off. The market has carved out a potential low around $4,482-$4,500 and is now attempting to build a recovery structure.
H1 Bias: Tentatively Bullish (Short-term Recovery)
The market structure shows:
- Recovery range: $4,441.34–$4,576.74 (immediate recovery zone)
- Bottoming pattern: Potential double bottom forming around $4,480-$4,500
- Higher lows formation: Price making higher swing lows since March 19 low
- Momentum shift: From panic selling to cautious buying
According to technical analysis, a Three White Soldiers pattern has formed within the $4,441.34–$4,576.74 range, signaling a potential upward move. This is a classic bullish reversal pattern that often appears at the end of downtrends, consisting of three consecutive bullish candlesticks with progressively higher closes.
Critical Chart Patterns
Three White Soldiers (Bullish Reversal): This pattern is highly significant given the context:
- Formation after steep decline suggests genuine buying interest
- Pattern within defined range indicates controlled recovery
- Validates $4,441-$4,480 as potential intermediate bottom
- Targets initial resistance at $4,576-$4,645
Potential Double Bottom: The price action around $4,480-$4,500 suggests:
- First touch: March 19 panic low
- Second touch: Late March retest
- Neckline: $4,576-$4,620 range
- Target if confirmed: $4,760-$4,821 (measuring gap from bottom to neckline)
Rising Channel Formation: Early signs of ascending channel developing:
- Lower support: Rising from $4,441
- Upper resistance: Around $4,645-$4,701
- Bullish structure if maintained
- Breakout above $4,700 would confirm
Technical Indicators on H1
RSI (Relative Strength Index): RSI is rising, holding around 56 and potentially moving higher. This reading indicates:
- Recovery from deeply oversold conditions
- Momentum shifting from bearish to neutral/bullish
- Room for further upside before overbought (70 level)
- Positive divergence from price lows (RSI making higher lows while price was falling)
MACD (Moving Average Convergence Divergence): MACD is moving sideways in positive territory, with bullish momentum showing signs of recovery. This means:
- Histogram bars turning green
- Signal line crossed above MACD line (buy signal)
- Momentum recovering from extreme bearish readings
- Confirmation needed with volume to sustain
MFI (Money Flow Index): MFI is rising, showing capital inflows. This volume-weighted indicator suggests:
- Smart money beginning to accumulate at these levels
- Selling pressure exhausted
- Buyers stepping in at perceived value
- Supporting reversal thesis
VWAP & Moving Averages: VWAP and SMA20 are below the market price, indicating bullish strength. This is a significant shift from recent price action and suggests:
- Price reclaimed short-term averages
- Bulls regained control intraday
- Supportive for continuation higher
- Key test will be holding above these levels
Key Support and Resistance Levels (H1)
Immediate Resistance:
- $4,576.74: First major resistance (recovery range top)
- $4,645.91: Secondary resistance
- $4,701.55: Critical resistance (psychological and technical)
- $4,760.74: Major resistance if rally extends
- $4,821.84: Significant resistance zone
- $4,937.88: Stronger resistance
- $4,996.26: Psychological resistance near $5,000
Critical Support Zones:
- $4,509.74: Immediate support (current price zone)
- $4,441.34: Strong support (bottom of recovery pattern)
- $4,373.89: Major support if correction resumes
- $4,313.67: Deeper support
- $4,254.97: Significant support
- $4,202.40: Critical support zone
- $4,157.41: Major support level
H1 Price Action Dynamics
The current price action suggests a market attempting to carve a bottom:
Scenario A - Continued Recovery (55% probability):
- Three White Soldiers pattern confirmed
- Price breaks and holds above $4,576-$4,620
- Targets: $4,701, $4,760, $4,821, $4,937
- Requires: Sustained volume, hold above $4,441
Scenario B - Range-Bound Consolidation (30% probability):
- Consolidates between $4,441-$4,701
- Builds energy for next move
- Choppy, two-way trading
- Awaiting next catalyst
Scenario C - Failed Recovery / Double Top (15% probability):
- Fails at $4,620-$4,701 resistance
- Retests and breaks $4,441
- Targets: $4,373, $4,313, $4,254 or lower
- Would require fresh bearish catalyst
M15 Timeframe Analysis: Intraday Recovery Precision
Intraday Price Dynamics
On the 15-minute (M15) chart, the price action reveals the tactical battle as buyers attempt to establish control. The M15 timeframe shows accumulation patterns and deliberate buying at key support levels.
M15 Bias: Bullish with Cautious Optimism
The M15 chart characteristics include:
- Ascending structure: Making higher lows and higher highs
- Breakout attempts: Testing resistance at $4,576-$4,620
- Volume patterns: Increasing on rallies, decreasing on dips
- Momentum building: Short-term EMAs turning bullish
M15 Technical Setup
Smart Money Concepts (SMC) Analysis:
The intraday price action reveals institutional footprints:
Demand Zones (Order Blocks):
- $4,500 - $4,520: Current accumulation zone (strong)
- $4,480 - $4,500: Major demand (recent low area)
- $4,441 - $4,460: Critical demand (pattern low)
- $4,400 - $4,420: Deep demand zone
- $4,350 - $4,380: Major demand if deeper correction
Supply Zones:
- $4,576 - $4,595: Immediate supply (recent resistance)
- $4,620 - $4,645: Secondary supply
- $4,680 - $4,701: Major supply zone
- $4,760 - $4,785: Significant resistance
- $4,820 - $4,850: Stronger supply
Fair Value Gaps (FVG): The recovery has created several FVGs:
- Gap around $4,520-$4,540 (partially filled)
- Gap around $4,560-$4,580 (resistance area)
- Gap around $4,620-$4,650 (target if breakout)
M15 Momentum Indicators
RSI on M15: The M15 RSI is likely in the 55-65 range, showing:
- Bullish momentum building
- Not yet overbought (below 70)
- Higher lows pattern established
- Positive trend
Stochastic Oscillator: Stochastic readings indicate:
- Emerging from oversold territory
- K-line crossed above D-line (buy signal)
- Momentum turning positive
- Room to run before overbought
Moving Average Alignment: Short-term moving averages showing:
- Price above 5 EMA and 10 EMA (bullish)
- EMAs beginning to slope upward (bullish trend)
- 20 EMA providing support
- Golden cross formation developing
M15 Key Levels for Intraday Trading
Micro Resistance:
- $4,520 - $4,530: Immediate resistance
- $4,545 - $4,560: Near-term resistance
- $4,576 - $4,590: Key resistance (pattern breakout)
- $4,620 - $4,640: Major resistance zone
Micro Support:
- $4,500 - $4,510: Immediate support
- $4,480 - $4,495: Strong support (recent pivot)
- $4,460 - $4,475: Secondary support
- $4,441 - $4,455: Critical support (pattern low)
M15 Trading Opportunities
Scenario 1: Breakout Continuation (Probability: 50%)
- Setup: Break and hold above $4,576-$4,595
- Entry: $4,580-$4,600 (on breakout or successful retest)
- Targets:
- Target 1: $4,645 (risk-reward 2:1)
- Target 2: $4,701 (risk-reward 3.5:1)
- Target 3: $4,760 (risk-reward 5:1)
- Stop Loss: $4,535 (below support cluster)
- Rationale: Following established recovery momentum
Scenario 2: Dip Buying at Support (Probability: 35%)
- Setup: Pullback to $4,500-$4,520 demand zone
- Entry: $4,505-$4,520 (on bullish reversal candles)
- Targets:
- Target 1: $4,560 (risk-reward 2.5:1)
- Target 2: $4,600 (risk-reward 4:1)
- Target 3: $4,645 (risk-reward 6:1)
- Stop Loss: $4,480 (below demand zone)
- Rationale: Buying value in established uptrend
Scenario 3: Range Trading (Probability: 25%)
- Setup: Price consolidates $4,500-$4,620
- Buy: $4,505-$4,520 (at lower range)
- Sell: $4,600-$4,620 (at upper range)
- Targets: 50-80 pip moves
- Stops: 30-40 pips outside range
- Rationale: Trading consolidation before breakout
Scenario 4: Failed Breakout Fade (Probability: 20%)
- Setup: Break above $4,620 quickly reverses (false breakout)
- Entry: $4,600-$4,615 (short on failed breakout)
- Targets:
- Target 1: $4,550 (risk-reward 2:1)
- Target 2: $4,500 (risk-reward 4:1)
- Stop Loss: $4,650 (above false breakout high)
- Rationale: Fading weak breakouts in recovery phase
Multi-Timeframe Synthesis: H1 + M15 Integration
Strategic Framework for Current Market
Optimal trading combines H1 recovery bias with M15 execution precision:
Current Market Alignment:
- H1 Direction: Bullish recovery from crash lows
- M15 Execution: Testing breakout levels
- Alignment: Both timeframes showing recovery structure
Integrated Trading Approach:
For Long Positions (Favored Currently):
- H1 requires: Hold above $4,441, preferably above $4,500
- M15 requires: Break above $4,576-$4,595 with volume
- Entry: Breakout confirmation or dip to $4,500-$4,520
- Stops: Below $4,480 for breakouts, below $4,440 for dip buys
- Targets: $4,645, $4,701, $4,760, $4,821
- Position size: Standard (1.5-2% risk) - volatility still elevated
For Short Positions (Counter-trend, Higher Risk):
- H1 confirms: Failure at $4,701-$4,760 resistance
- M15 confirms: Break below $4,500 with momentum
- Entry: $4,490-$4,505 on confirmed breakdown
- Stops: Above $4,545-$4,560
- Targets: $4,441, $4,373, $4,313
- Position size: Reduced (1% risk) - fighting recovery trend
For Scalpers:
- Current range: $4,500-$4,620 (intraday)
- Strategy: Buy dips to $4,500-$4,520, sell rallies to $4,600-$4,620
- Risk: Breakout could happen quickly
- Sizing: Small positions, quick profits (20-40 pips)
Risk Management Protocol
Position Sizing:
- Volatility remains elevated: 1.5-2% risk per trade
- Wider stops necessary: 60-100 pips typical
- Scale into positions at key levels
- Maximum exposure: 4% across all gold positions
Stop Loss Placement:
- Day trades: Below M15 demand zones + 30-40 pip buffer
- Swing trades: Below H1 support + 60-80 pip buffer
- Use stops religiously - market still volatile post-crash
Take Profit Strategy:
- Scale out: 30% at first target, 40% at second, 30% runner
- Trail stops: Using M15 or H1 swing points
- Book profits at resistance: Don't be greedy in recovery
Fundamental Catalysts for the Week
Key Economic Data Releases
This week features critical data that will influence gold's recovery trajectory:
April 1 - ADP Nonfarm Employment Change (March):
- Private sector employment data
- Leading indicator for Friday's NFP
- Strong number = bearish for gold (supports Fed hawkish stance)
- Weak number = bullish for gold (easing hopes)
April 1 - Manufacturing PMI (March):
- Manufacturing sector health
- Below 50 = contraction (bullish for gold)
- Above 50 = expansion (bearish for gold if too strong)
April 2 - Initial Jobless Claims:
- Weekly unemployment indicator
- Rising claims = labor market weakening (bullish gold)
- Falling claims = strong labor market (bearish gold)
April 3 - Nonfarm Payrolls (NFP):
- THE BIG ONE - most important release of the month
- Consensus expectations critical
- Beat = bearish for gold (Fed stays hawkish)
- Miss = bullish for gold (easing hopes resurface)
April 3 - Unemployment Rate:
- Headline unemployment figure
- Rising rate = economic concerns (bullish gold)
- Falling rate = economic strength (bearish gold)
April 3 - Services PMI (March):
- Service sector health (larger part of economy)
- Critical for inflation outlook
- Strong services = potential inflation concerns
Fed Policy Implications
The March FOMC hawkish pivot remains the dominant fundamental theme:
- Rate cuts in 2026: Now expecting only ONE cut (down from two)
- Inflation concerns: PPI at +0.7% well above expectations
- Higher-for-longer: Fed signaling rates will stay elevated
- Real yields: 10-year at 4.2% creates headwind for gold
What Gold Needs for Sustained Recovery:
- Softer economic data (NFP miss, rising unemployment)
- Lower inflation prints (PCE, CPI moderating)
- Fed dovish signals (recognizing growth slowdown)
- Dollar weakness (DXY falling from 99.9)
- Yield curve changes (10-year falling below 4%)
Geopolitical Situation
The Middle East situation remains a complex factor:
- Strait of Hormuz tensions: Ongoing but stabilized somewhat
- Oil prices: Elevated but not spiking further
- Safe haven demand: Muted due to inflation/rate dynamics
- Paradox continues: Geopolitical risk offset by inflation implications
The key insight remains: gold is being punished by the secondary effects (oil-driven inflation) rather than benefiting from the primary geopolitical risk.
Central Bank Demand
Long-term structural support remains intact:
- PBOC (China): Likely continued buying (15+ months consecutive)
- De-dollarization: Continues as strategic theme
- Reserve diversification: Supports price floor
- Physical demand: Provides downside protection
This institutional demand creates a fundamental floor, likely in the $4,200-$4,400 range.
Technical Indicators Summary
Overall Signal: BUY (Recovery Phase)
| Indicator | H1 Timeframe | M15 Timeframe | Signal | Weight |
|---|---|---|---|---|
| Trend | Bullish recovery | Bullish short-term | Buy | High |
| RSI | 56 (Rising) | 55-65 (Bullish) | Buy | High |
| MACD | Positive, recovering | Bullish crossover | Buy | High |
| MFI | Rising | Capital inflows | Buy | Medium |
| VWAP/SMA20 | Below price | Below price | Buy | High |
| Patterns | Three White Soldiers | Higher highs/lows | Buy | Very High |
| Volume | Improving on rallies | Supportive | Buy | Medium |
| Support/Resistance | Above $4,441 | Testing $4,576 | Buy | Very High |
| OVERALL | STRONG BUY | BUY | BUY | HIGH |
Technical Rating: Currently rated BUY across multiple timeframes (1M: Strong Buy, 5M: Strong Buy, 15M: Strong Buy, 1H: Strong Buy, Daily: Buy, Weekly: Buy, Monthly: Strong Buy)
Trading Strategies for April 1, 2026
Strategy 1: Breakout Trading (Primary Strategy)
Profile: For traders wanting to capitalize on recovery momentum
Bullish Breakout Setup:
- Trigger: H1 close above $4,576-$4,595 with volume
- Entry: $4,580-$4,605 (on breakout or pullback retest)
- Targets:
- Target 1: $4,645 (Take 30% profit)
- Target 2: $4,701 (Take 40% profit)
- Target 3: $4,760-$4,821 (Trail 30%)
- Stop Loss: $4,535 (below support cluster)
- Risk-Reward: Minimum 2.5:1
- Position Size: 1.5-2% risk
Key Points:
- Wait for clear break and close above resistance
- Volume confirmation essential
- Can add on pullback retest
- Trail stops aggressively once in profit
Strategy 2: Dip Buying (Value Play)
Profile: For traders seeking better entry prices
Setup:
- Philosophy: Buy weakness in established recovery
- Entry: $4,500-$4,520 (on pullback to demand zone)
- Confirmation: Look for bullish reversal candles, RSI oversold on M15
- Targets:
- Target 1: $4,576 (Take 30% profit)
- Target 2: $4,620-$4,645 (Take 40% profit)
- Target 3: $4,701+ (Trail 30%)
- Stop: $4,475 (below demand zone)
- Position Size: 2% risk
- Risk-Reward: 3:1 or better
Best if: Market consolidates rather than breaks out immediately
Strategy 3: Conservative Range Trading
Profile: For risk-averse traders
Setup:
- Action: Trade established intraday range
- Buy zone: $4,500-$4,520
- Sell zone: $4,600-$4,620
- Size: 1% risk per trade
- Targets: 50-80 pip moves
- Stops: 40-50 pips outside range
- Management: Quick profits, no overnight holds
- Rationale: Capitalize on consolidation before breakout
Strategy 4: Swing Trading Recovery
Profile: For experienced traders with higher risk tolerance
Setup:
- Action: Position for multi-day recovery
- Entry: $4,505-$4,550 (current levels or slight pullback)
- Targets:
- Target 1: $4,760 (Take 25%)
- Target 2: $4,937 (Take 35%)
- Target 3: $4,996-$5,000 (Trail 40%)
- Stop: $4,420 (below pattern low)
- Hold time: 5-10 days
- Position size: 1.5% risk
- Rationale: Capture full recovery to $5,000 retest
Market Outlook: Short, Medium, and Long Term
Immediate Term (This Week): Data-Driven Volatility
Base Case (50% probability): Consolidation and gradual recovery between $4,500-$4,760. NFP on Friday will be key determinant. Soft data supports rally to $4,760-$4,821. Strong data could trigger retest of $4,441 or lower.
Bull Case (35% probability): Strong recovery rally. Break above $4,701 sustained. Weak economic data triggers Fed easing hopes. Gold rallies to $4,937-$5,000 by end of week. Requires: Weak NFP, rising unemployment, dovish Fed commentary.
Bear Case (15% probability): Failed recovery, new lows. NFP beats expectations significantly. Fed rhetoric reinforces higher-for-longer. Gold breaks $4,441, falls to $4,313-$4,254. Requires: Very strong labor data, hot inflation, hawkish Fed.
Trading Implication: Favor longs but remain nimble. Friday's NFP is critical event. Don't over-leverage ahead of data.
Short-Medium Term (April-May): Recovery or Resumption?
Most Likely Path: April sees gradual recovery as positioning adjusts. Market tests $4,800-$5,000 range. May brings clarity on Fed trajectory. If data softens, gold retests $5,000-$5,200. If data stays strong, gold consolidates $4,500-$4,900.
Key Levels:
- Resistance: $4,645, $4,701, $4,760, $4,821, $4,937, $4,996, $5,107
- Support: $4,509, $4,441, $4,373, $4,313, $4,254, $4,202
Critical Factors:
- NFP and unemployment trajectory
- Inflation data (CPI, PCE)
- Fed rhetoric and dot plot updates
- Dollar strength/weakness
- Real yields movement
Long Term (Rest of 2026): Bullish Structure Challenged But Intact
Despite the March crash, the long-term bullish case for gold remains valid, though the path will be more volatile:
Year-End 2026 Scenarios:
Conservative Case ($4,800-$5,200):
- Probability: 40%
- Fed cuts once as projected
- Inflation moderates slowly
- Growth slows but no recession
- Gold consolidates gains, trades range
Base Case ($5,200-$5,800):
- Probability: 35%
- Fed forced to cut 2-3 times
- Soft landing achieved
- Geopolitical risks persist
- Gold resumes uptrend
Bullish Case ($5,800-$6,500):
- Probability: 20%
- Recession forces aggressive Fed cuts
- Flight to safety dominates
- Dollar weakens materially
- Gold makes new all-time highs
Bearish Case ($4,000-$4,500):
- Probability: 5%
- Economy stays strong
- No Fed cuts in 2026
- Real yields surge further
- Gold extends correction
Structural Drivers Supporting Long-Term Bulls:
- Central Bank Demand: 15+ months PBOC buying continues
- De-dollarization: Structural trend intact
- Debt Concerns: US debt/GDP at record highs
- Geopolitical Uncertainty: Multiple flashpoints globally
- Inflation Hedge: Even if moderating, still above target
Risks to Bull Thesis:
- Persistent Strength: US economy refuses to slow
- Fed Higher-for-Longer: No cuts materialize
- Dollar Strength: DXY breaks higher
- Real Yields: Continue rising
- China Pullback: PBOC slows or stops purchases
Advanced Technical Analysis
Elliott Wave Count
The March crash significantly alters the wave count:
Previous Count (Now Invalidated):
- Wave 1: $2,956 → $5,595 (completed)
- Wave 2: Correction expected to $5,200-$5,300
Revised Count (Post-Crash):
- Primary Wave 3: $2,956 → $5,595 (completed)
- Primary Wave 4: $5,595 → $4,700 (potentially complete or nearing completion)
- Primary Wave 5: $4,700 → ? (next leg up, target $6,000-$6,500)
Alternative Count: If $4,700 was just Wave A of a larger correction:
- Wave A: $5,595 → $4,700 (complete)
- Wave B: $4,700 → $4,900-$5,200 (in progress - bounce)
- Wave C: $4,900-$5,200 → $4,200-$4,400 (yet to come)
Key Level: Holding above $4,200 keeps primary bullish count alive. Break below suggests deeper correction.
Fibonacci Analysis
From $5,595 (ATH) to $4,700 (Recent Low):
- 23.6% Retrace: $4,911 (first resistance)
- 38.2% Retrace: $5,042 (key resistance)
- 50.0% Retrace: $5,147 (major resistance)
- 61.8% Retrace: $5,253 (strong resistance)
Current Position: Price at $4,677 is just above the recent low. Recovery to 23.6% ($4,911) would confirm short-term bullish structure. Break above 38.2% ($5,042) would signal strong recovery.
Extension Targets (If Recovery Continues): From $4,700 low:
- 127.2%: $5,734
- 161.8%: $6,197
- 200%: $6,595
Volume Profile & Market Structure
Point of Control (POC): After the crash, the POC has shifted dramatically lower. High volume trading occurred around $4,700-$4,900 during the panic selling. This area now represents "value" in the shorter term.
Value Area:
- Upper: $4,850-$4,950
- Middle: $4,700-$4,800
- Lower: $4,550-$4,650
Current price at $4,677 is in the middle of the new value area, suggesting fair pricing at these levels.
Volume Characteristics:
- High volume on decline (distribution)
- Decreasing volume on bounce (needs improvement)
- Need volume expansion on rally for confirmation
- Capitulation volume seen at lows suggests selling exhaustion
Risk Factors & Considerations
Known Risks This Week
- NFP Friday: Biggest risk - can move market 100-200 pips instantly
- ADP Data: Leading indicator could set tone
- PMI Data: Manufacturing/Services health critical
- Technical Failure: Rejection at $4,701 could trigger new lows
- Dollar Surge: DXY above 100 creates strong headwind
- Geopolitical Surprise: Middle East escalation (bullish) or resolution (bearish)
Trading Risks
- Whipsaw Volatility: Recovery rallies can fail quickly
- False Breakouts: Common in bottoming processes
- Overnight Gaps: Economic data creates gap risk
- Liquidity Issues: Thinner liquidity during bottoming
- Sentiment Shifts: News-driven reversals common
Mitigation Strategies
For Long Positions:
- Use wider stops (60-100 pips)
- Scale in rather than all-in
- Book profits at resistance levels
- Reduce size before NFP Friday
- Trail stops once profitable
For Short Positions:
- Very tight stops (fighting recovery trend)
- Only with clear rejection patterns
- Quick to exit if wrong
- Small position sizes
For All Traders:
- Don't over-leverage
- Respect the $4,441 support level
- Be ready for NFP volatility
- Consider cash positions before data
- Honor stops religiously
Final Thoughts & Key Takeaways
Gold stands at a critical juncture on April 1, 2026. After one of the most dramatic sell-offs in recent memory - losing over $800 in two weeks - the metal is attempting to stabilize and recover from the $4,700 lows.
Critical Conclusions:
-
Bottoming Process Underway: Three White Soldiers pattern and price holding above $4,441 suggests a bottom may be forming, but confirmation needed.
-
Recovery Not Guaranteed: While technical indicators are improving, fundamental headwinds (hawkish Fed, strong dollar, high yields) remain in place.
-
NFP Critical: Friday's jobs report will be the week's most important catalyst. Soft data supports recovery; strong data risks new lows.
-
Technical Levels Matter: $4,576-$4,645 is critical resistance. Break above confirms recovery. $4,441 is critical support. Break below suggests more downside.
-
Long-Term Bull Case Intact: Despite the crash, structural factors (central bank demand, de-dollarization, geopolitical risk) support higher prices long-term.
-
Volatility Remains Elevated: Expect 100+ pip daily ranges to continue. Position sizing and risk management crucial.
-
Paradox Persists: Geopolitical risk (Middle East) being offset by its inflationary impact. Unique and challenging environment.
-
Value Opportunity: For long-term bulls, current levels ($4,600-$4,700) represent potentially attractive entry points if fundamental outlook improves.
Trading Wisdom for Current Conditions
DO:
- Trade with the trend (currently attempting recovery)
- Use wider stops to accommodate volatility
- Scale into positions
- Book profits at resistance
- Reduce exposure before major data
- Keep powder dry for opportunities
DON'T:
- Over-leverage (volatility is extreme)
- Fight clear breakouts
- Ignore major support/resistance
- Hold full positions through NFP
- Chase price without confirmation
- Underestimate downside risk
Price Predictions
Next 24-48 Hours:
- Bullish Above: $4,600
- Bearish Below: $4,500
- Expected Range: $4,500-$4,700
- Most Likely: Gradual drift higher to $4,650-$4,700
This Week (Through NFP):
- Bull Case: $4,760-$4,821
- Base Case: $4,600-$4,760
- Bear Case: $4,400-$4,550
End of April:
- Bull Case: $4,900-$5,100
- Base Case: $4,700-$4,900
- Bear Case: $4,400-$4,650
Rest of 2026:
- Bull Case: $5,800-$6,500 (new ATH)
- Base Case: $5,200-$5,800
- Bear Case: $4,000-$4,500
Closing Thought
"After the storm comes the calm. Gold is attempting to find its footing after a historic sell-off. The recovery won't be linear, but for patient traders, opportunity emerges from chaos."
Gold has experienced one of its most brutal corrections in years, driven by a perfect storm of hawkish Fed policy, rising yields, and the paradox of geopolitical risk creating inflationary headwinds rather than safe-haven flows.
Yet the metal is showing signs of life. The Three White Soldiers pattern, improving RSI, and price holding above key support suggest a bottom may be forming. The question is whether this is a tradable bounce or the start of a genuine recovery.
The answer will come from the economic data. Weak jobs numbers would breathe new life into Fed easing expectations and support gold. Strong numbers would validate the Fed's hawkish stance and potentially trigger another leg down.
For traders, the setup is clear: favor longs with tight risk management, be ready to pivot if data disappoints, and remember that the long-term bullish structure remains intact despite the violent correction. This is not the time for hero trades - it's time for discipline, patience, and proper position sizing.
Disclaimer: This analysis is for educational and informational purposes only and does not constitute financial advice. Trading gold and other financial instruments involves substantial risk of loss. Past performance is not indicative of future results. The NFP release on Friday presents significant event risk that can cause dramatic price movements. Gold has experienced extreme volatility recently with 6%+ declines in two sessions. Always conduct your own research, understand the risks involved, and consider consulting with a licensed financial advisor before making investment decisions. Never risk more than you can afford to lose.
Published: April 1, 2026
Timeframes Analyzed: H1 (1-Hour), M15 (15-Minute)
Asset: XAUUSD (Gold Spot vs US Dollar)
Current Price: $4,677.35
Market Condition: Recovery Attempt After Historic Sell-Off
Analysis Type: Technical Analysis with Fundamental Context
Next Update: April 2, 2026 (Pre-NFP Analysis)
⚠️ HIGH VOLATILITY WARNING ⚠️
Gold has experienced extreme volatility with a $900+ decline from $5,595 to $4,700 in recent weeks. Expect continued high volatility with daily ranges of 100+ pips. Critical NFP data on Friday (April 3) will likely cause significant market movements. Consider reducing position sizes, using wider stops, and avoiding over-leverage. This market requires experience with high-volatility trading conditions and strong risk management discipline.


 Trading Guide")
")
 Free Indicator")