
Mastering XAUUSD Daily: What Smart Traders Are Watching Today, Feburary 25,2026

"Every trade must be planned. Unplanned trades are emotional trades."
We'll examine what the chart actually conveys today, including where buyers and sellers are active, which levels are crucial, and how momentum is shifting in real time.
Before we begin, I would like to share with you the best ways to use MQL4 and MQL5 to transform your trading strategies into extremely profitable machines. In order to teach traders how to construct MT4 and MT5 trading algorithms from the bottom up, I have created basic instructions.
📘LEARN HOW TO DEVELOP THE PERFECT TRADING ALGORITHM FOR MT4
📘LEARN HOW TO DEVELOP THE PERFECT TRADING ALGORITHM FOR MT5
A powerful system/ trader assistant tool designed to enhance analysis, improve timing, and give traders a structured approach to market execution.
Market Overview
Gold (XAUUSD) is displaying impressive strength on February 25, 2026, currently trading at approximately $5,191.49 per ounce, representing a remarkable 75% year-over-year gain. The precious metal has successfully surged past the critical 5,101–5,037 resistance zone during its upward correction phase and is now consolidating near multi-week highs, demonstrating the resilience of the bullish trend that has dominated throughout 2025 and continues into 2026.
Today's session opened at $5,104.34 and has seen the price reach as high as $5,176.53, reflecting strong bullish momentum. According to current forecasts, XAUUSD is expected to trade between $5,153.72 and $5,208.41 on February 25, 2026, with moderate volatility anticipated this week amid key macroeconomic data releases.
Current Market Context
The recent price action represents a significant technical development. After testing support near $4,960 in mid-February and successfully defending the psychologically critical $5,000 level, gold has staged a powerful rally. Recent reports indicate that on February 23, 2026, gold had a 2% surge, pushing up to nearly $5,170, breaking through key resistance levels and signaling renewed bullish momentum.
Key Price Levels (February 25, 2026):
- Current Price: $5,191.49
- Opening Price: $5,104.34
- Today's Range: $5,104.34 - $5,176.53
- All-Time High: $5,595.46 (January 29, 2026)
- 52-Week Range: $2,832.63 - $5,595.46
- Year-to-Date Change: +75%
- Key Resistance: $5,200-$5,300
- Key Support: $5,100-$5,150
The market is now at a critical juncture, having reclaimed the 5,101–5,037 zone after weeks of correction. This technical breakout, combined with strong fundamental drivers, has positioned gold for potential continuation toward new highs.
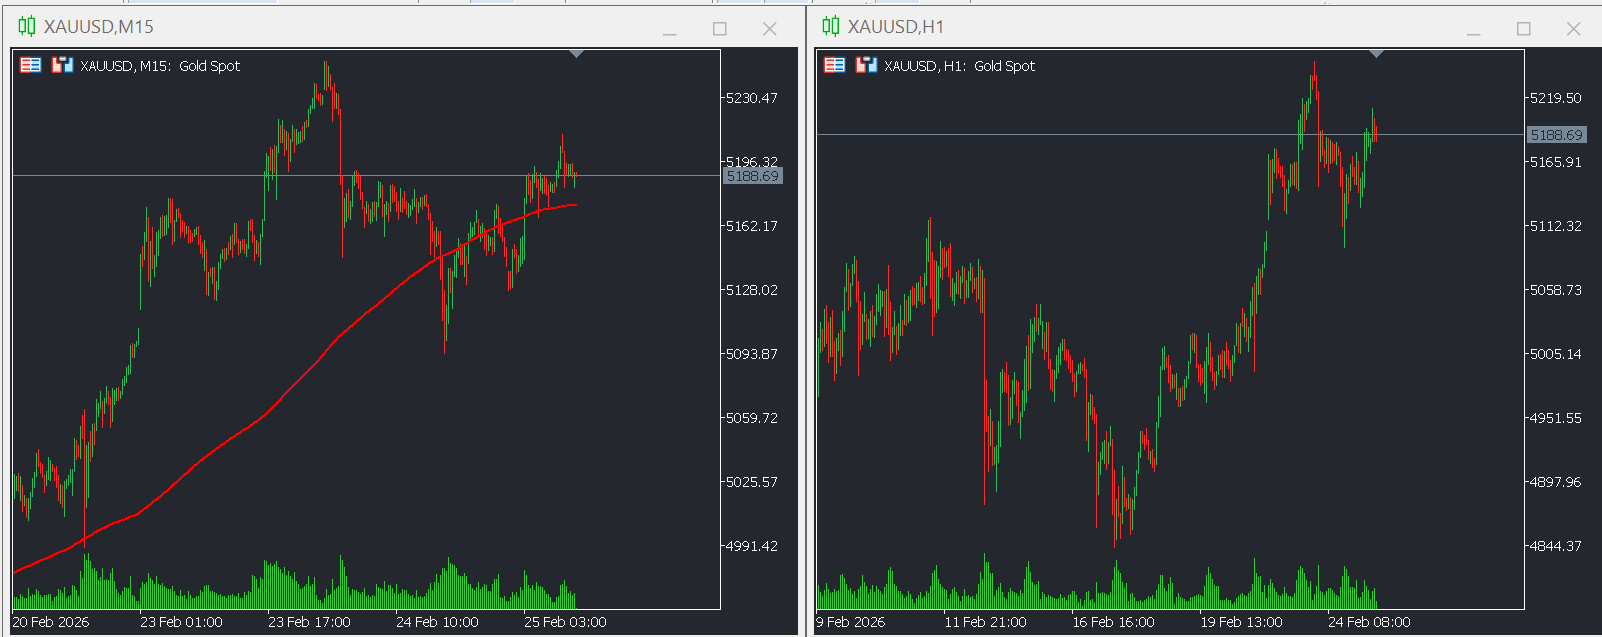
H1 Timeframe Analysis: The Intermediate Picture
Market Structure & Trend Assessment
On the hourly (H1) chart, XAUUSD has completed a decisive breakout above the downtrend resistance that had capped prices since early February. The gold price has once again tested the trend boundary of 5,101–5,037 during an upward correction, and this time it successfully broke through with conviction, establishing a new higher low structure.
H1 Bias: Bullish
The market structure has shifted decisively bullish. After consolidating in the $4,950-$5,050 range for over a week, gold has broken out with increased volume and momentum. The price action shows:
- Higher highs and higher lows formation (classic uptrend)
- Break above descending trendline resistance
- Successful retest of broken resistance as new support
- Volume expansion on upside breakout
According to technical patterns identified, a Rising Three Methods pattern has formed near $5,153.72, from that level, the prices moved up to $5,208.41. This continuation pattern typically signals that the uptrend will persist after a brief consolidation phase.
Critical Chart Patterns
Rising Three Methods Pattern: This bullish continuation pattern appeared near $5,153.72, indicating that buyers are firmly in control despite brief consolidation. The pattern consists of:
- A long bullish candle (establishing trend)
- Three small bearish/consolidation candles (profit-taking/pause)
- Another strong bullish candle (continuation confirmation)
However, traders should note that a Bearish Engulfing reversal pattern later developed, signaling a potential shift to a downtrend. This conflicting signal suggests that while the overall trend remains bullish, near-term pullbacks are possible as the market digests recent gains.
Bullish Hammer (Weekly): On the 4-hour chart, gold has smashed through the $5,107 barrier and is set to keep on climbing. The weekly chart shows that a 'bullish hammer' has formed, clearly indicating that buyers are firmly in control of the market. This weekly timeframe confirmation adds significant weight to the bullish case.
Technical Indicators on H1
RSI (Relative Strength Index): RSI has turned lower from the overbought zone and is holding near the upper boundary at 65, suggesting a possible price pullback in the near term. However, this reading should be interpreted in context:
- RSI at 65 shows strong momentum but not extreme overbought conditions
- The pullback from overbought (>70) is healthy in a strong uptrend
- RSI holding above 60 typically indicates the bulls maintain control
- The RSI is climbing steadily towards 60 on weekly timeframes, confirming broader bullish momentum
MACD (Moving Average Convergence Divergence): MACD is declining in positive territory, indicating that the bullish momentum is weakening. This suggests:
- The recent rally may be losing steam temporarily
- A consolidation or pullback could materialize
- However, MACD remaining in positive territory is still bullish
- Watch for MACD to find support and turn higher for continuation signal
MFI (Money Flow Index): MFI has also turned lower, showing an outflow of liquidity from the asset. This volume-weighted indicator suggests:
- Some profit-taking is occurring after the recent rally
- Smart money may be reducing positions temporarily
- However, this is normal behavior at resistance levels
- A bounce in MFI would signal renewed institutional buying
VWAP & Moving Averages: VWAP and SMA20 are near the market price, suggesting market uncertainty. This configuration indicates:
- Price is trading at "fair value" based on recent volume
- Market is in equilibrium between buyers and sellers
- A move away from VWAP in either direction will signal the next trend
- SMA20 near current price provides dynamic support/resistance
Bollinger Bands: According to weekly analysis, prices stabilised in the 4,950–5,000 zone after a deep correction, with Bollinger Bands narrowing. The narrowing bands preceded the recent breakout, which is classic technical behavior. Now that price has expanded outside the bands, continued momentum is likely.
Stochastic Oscillator: The Stochastic Oscillator allows for short-term pressure, suggesting that despite the bullish breakout, some near-term consolidation or pullback is possible.
Key Support and Resistance Levels (H1)
Immediate Resistance:
- $5,200 - $5,208: Near-term resistance (top of Rising Three Methods pattern)
- $5,257: With $5,107 under their belt, investors will be looking to take the price up to $5,257
- $5,290: Next psychological resistance
- $5,326: Resistance levels are located at 5,118 and 5,326
- $5,400 - $5,500: Major resistance zone before ATH retest
Critical Support Zones:
- $5,153 - $5,170: Immediate support (Rising Three Methods base)
- $5,107 - $5,118: Key support levels are 4,816 and 4,696, while resistance levels are located at 5,118
- $5,037 - $5,101: Former resistance turned support (critical zone)
- $5,000: The $5,000 level remains the crucial support that investors are watching, with the long-term thesis for gold only really looking good if it stays above this level
- $4,950 - $4,960: Secondary support
- $4,816: Major support level
- $4,696: Deeper support if correction extends
H1 Price Action Dynamics
The recent breakout above $5,107 resistance is technically significant for several reasons:
- Volume Confirmation: The move was accompanied by increased trading activity, validating the breakout
- Timeframe Alignment: Multiple timeframes (H1, H4, Daily, Weekly) now show bullish alignment
- Momentum Shift: The break changed the intermediate trend from corrective to bullish
- Psychological Impact: Reclaiming $5,100+ reinforces confidence in the bull trend
However, traders should remain aware of potential near-term headwinds:
- Overbought indicators on shorter timeframes
- Natural profit-taking after 2% surge
- Bearish Engulfing pattern suggesting caution
- Approaching major round number resistance at $5,200
M15 Timeframe Analysis: Precision Trading Perspective
Intraday Price Dynamics
On the 15-minute (M15) chart, price action reveals the tactical battle between bulls and bears at these elevated levels. The M15 timeframe is crucial for identifying precise entry points, stop-loss placement, and take-profit targets for day traders and scalpers.
M15 Bias: Bullish with Consolidation
The M15 chart shows gold in a bullish channel with occasional consolidation phases as it digests gains. The intraday structure reveals:
- Series of higher highs and higher lows intact
- Shallow pullbacks being quickly bought
- Support forming at broken resistance levels
- Minor consolidation near $5,175-$5,190
M15 Technical Setup
Smart Money Concepts (SMC) Analysis:
The market has created distinct institutional zones during its recent rally:
Supply Zones (Order Blocks):
- $5,200 - $5,210: Fresh supply zone (untested)
- $5,230 - $5,250: Medium-term supply
- $5,280 - $5,300: Major supply before $5,326 resistance
- $5,350 - $5,400: Significant supply zone
Demand Zones:
- $5,170 - $5,190: Current price action zone (consolidation)
- $5,150 - $5,165: Immediate demand (Rising Three Methods base)
- $5,100 - $5,120: Strong demand (breakout zone)
- $5,037 - $5,070: Major demand (former resistance)
- $5,000 - $5,020: Psychological support and institutional demand
Fair Value Gaps (FVG): During the recent rally from $4,960 to $5,190, several FVGs were created:
- Gap around $5,080-$5,090 (partially filled)
- Gap around $5,130-$5,140 (unfilled - potential magnet on pullback)
- Gap around $5,160-$5,170 (currently being filled)
M15 Momentum Indicators
RSI on M15: The RSI on M15 has been oscillating between 50-70, indicating strong bullish momentum with periodic cooling. Current reading near 65 suggests:
- Strong momentum but not extreme
- Room for slight consolidation without breaking structure
- Pullback to 50 RSI would be healthy and buyable
- Break above 70 would signal acceleration
Moving Average Alignment: On M15, shorter moving averages (5, 10, 20 period) are all pointing higher and properly aligned:
- Price above 5 EMA > 10 EMA > 20 EMA = bullish
- EMAs fanning out = strong trend
- Price consolidating near 5 EMA = normal in strong trend
Volume Analysis: Volume patterns on M15 reveal:
- Higher volume on up-moves vs. down-moves (bullish)
- Volume spiking at breakout levels (confirmation)
- Lower volume on pullbacks (weak selling pressure)
- Increasing volume as price approaches round numbers (accumulation/distribution battles)
M15 Key Levels for Intraday Trading
Micro Resistance:
- $5,195 - $5,200: Immediate resistance
- $5,208: Intraday target (Rising Three Methods projection)
- $5,220 - $5,230: Secondary resistance
- $5,257: Next major target
Micro Support:
- $5,180 - $5,185: Immediate support
- $5,165 - $5,175: Near-term support
- $5,150 - $5,160: Minor support zone
- $5,135 - $5,145: FVG support (if pullback occurs)
- $5,100 - $5,110: Major intraday support
M15 Trading Opportunities
Scenario 1: Continuation Breakout (Probability: 55%)
- Setup: Price breaks above $5,200 with volume
- Entry: $5,202-$5,210 (on breakout or retest)
- Targets:
- Target 1: $5,230 (risk-reward 2:1)
- Target 2: $5,257 (risk-reward 3.5:1)
- Target 3: $5,290 (risk-reward 5:1)
- Stop Loss: $5,175 (below recent consolidation)
- Rationale: Trend following with momentum confirmation
Scenario 2: Buy the Dip (Probability: 45%)
- Setup: Pullback to $5,150-$5,165 demand zone
- Entry: $5,152-$5,165 (watch for bullish reversal pattern)
- Targets:
- Target 1: $5,190 (risk-reward 2:1)
- Target 2: $5,210 (risk-reward 3:1)
- Target 3: $5,240 (risk-reward 5:1)
- Stop Loss: $5,135 (below FVG and demand zone)
- Rationale: Buying at support in strong uptrend
Scenario 3: Range Trading (Probability: 30%)
- Setup: Price consolidates between $5,170-$5,200
- Buy: $5,172-$5,178 (lower range)
- Sell: $5,195-$5,202 (upper range)
- Targets: 15-25 pip moves
- Stops: 15-20 pips outside range
- Note: Exit if range breaks decisively
Scenario 4: Failed Breakout/Reversal (Probability: 25%)
- Setup: Price rejects at $5,200-$5,210 with bearish engulfing
- Entry: $5,195-$5,200 (on confirmed rejection)
- Targets:
- Target 1: $5,165 (risk-reward 2:1)
- Target 2: $5,140 (risk-reward 3:1)
- Target 3: $5,110 (risk-reward 5:1)
- Stop Loss: $5,220 (above failed breakout)
- Rationale: Counter-trend trade - requires strict discipline
Multi-Timeframe Synthesis: H1 + M15 Integration
Strategic Trading Framework
Optimal trading combines H1 directional bias with M15 execution precision:
Current Market Alignment:
- H1 Direction: Bullish breakout confirmed, testing new highs
- M15 Execution: Bullish with consolidation near highs
- Alignment: Strong positive alignment favoring longs
Integrated Approach:
For Long Positions (Primary Strategy):
- H1 confirms: Breakout above 5,101-5,037 successful
- M15 confirms: Making higher highs and higher lows
- Entry: Use M15 pullbacks to $5,150-$5,170 for better risk-reward
- Stops: Below $5,135 (M15) or $5,100 (H1 swing traders)
- Targets: $5,257, $5,290, $5,326+
- Position Size: Standard (1.5-2% risk) given strong alignment
For Short Positions (Counter-Trend Only):
- Only consider: If strong rejection at $5,200-$5,210 with reversal pattern
- Entry: Very close to resistance
- Targets: Quick scalp to $5,170-$5,150
- Stops: Very tight above $5,220
- Size: Reduced (0.5-1% risk max)
- Warning: Fighting a strong trend is dangerous
Risk Management Protocol
Position Sizing:
- Bullish positions: Standard size (1.5-2% account risk)
- Counter-trend positions: Half size (0.5-1% account risk)
- Maximum total exposure: 4% across all gold positions
Stop Loss Placement:
- Day trades: Below M15 swing lows with 10-15 pip buffer
- Swing trades: Below H1 support zones with 30-40 pip buffer
- Always use stops - no exceptions in this volatile environment
Take Profit Strategy:
- Scale out: 33% at each target level
- Trail stops: Use M15 swing lows for remaining position
- Never move targets further away - maintain discipline
Fundamental Catalysts Driving Current Price Action
Geopolitical Risk Premium
The recent surge in gold prices has been significantly driven by escalating geopolitical tensions. Geopolitical tensions, including Trump's new 15% global tariff and Iran's nuclear developments, are driving investors towards gold as a safe-haven asset.
Key geopolitical factors:
- US-Iran Tensions: Despite tentative diplomatic progress, underlying tensions persist
- Global Tariff Concerns: Trump's 15% global tariff announcement creating uncertainty
- Nuclear Developments: Iran's nuclear program progression raising concerns
- Trade War Risks: Escalating protectionism affecting global trade
Geopolitical risks around Iran are present, but without escalation, suggesting the market is pricing in continued tension without immediate crisis - a "Goldilocks" scenario for gold that maintains safe-haven premium without triggering risk-off collapse.
Central Bank Demand
One of the most powerful structural drivers for gold remains unprecedented central bank accumulation. Central banks are significantly increasing their gold purchases, aiming to build reserves and reduce reliance on dollar-denominated assets.
Specific data points:
- Gold purchases by central banks totaled 863 tonnes in 2025 and are expected to ease slightly to 850 tonnes in 2026
- PBOC (People's Bank of China) has extended purchases for 15th consecutive month
- De-dollarization trend continues among emerging market central banks
- Central banks buying at high prices signals conviction about future appreciation
This institutional demand provides a strong floor for gold prices and limits downside potential.
Federal Reserve Policy Outlook
The Fed's policy trajectory remains a critical variable. According to CME Group data, the probability of an interest rate cut to 3.25–3.50% in March stands at 7.9%. Meanwhile, 92.1% of market participants expect rates to remain unchanged at 3.50–3.75%.
Key policy considerations:
- Market has largely priced out near-term cuts (March)
- Focus shifting to H2 2026 for potential easing
- The FOMC minutes showed disagreements within the Federal Reserve, prompting the market to lower expectations for rate cuts in 2026
- Some Fed members even discussing potential rate hike if inflation persists
Paradoxically, gold is rallying despite "higher for longer" expectations because:
- Elevated rates eventually hurt growth (bullish for gold)
- Geopolitical risks outweighing rate concerns
- Real yields remain manageable (not excessively high)
- Market looking 6-12 months ahead to eventual pivot
This Week's Economic Calendar
Moderate volatility is expected this week amid the release of initial jobless claims data, other macroeconomic reports. Additional key data includes:
- GDP Data: The focus is on GDP and PCE, which will clarify the Fed's policy trajectory
- PCE Price Index: Key inflation measure the Fed watches closely
- Jobless Claims: Labor market strength indicator
These releases could trigger volatility but are unlikely to derail the bullish trend unless dramatically different from expectations.
Demand-Supply Dynamics
Investment Demand:
- Strong ETF inflows returning after Q4 2025 outflows
- Retail demand robust in key markets (India, China, Middle East)
- High net worth individuals increasing allocations
Jewelry Sector: Due to exceptionally high prices, global jewelry sales fell 18% in 2025, with the sharpest decline recorded in China, where demand dropped by 24%. This price-sensitive demand destruction is offset by:
- Investment and central bank demand
- Safe-haven flows
- Speculative positioning
Supply Constraints: Global gold production reached 3.67 thousand tonnes in 2025, while recycled gold supply increased by 2–3%. Supply growth remains modest, unable to meet surging demand.
Technical Indicators Summary
Overall Signal: BUY (Strong Bullish Trend)
| Indicator | H1 Timeframe | M15 Timeframe | Signal | Weight |
|---|---|---|---|---|
| Trend Structure | Higher highs/lows | Higher highs/lows | Strong Buy | High |
| RSI | 65 (Strong, pullback possible) | 60-65 (Strong) | Buy | High |
| MACD | Positive, weakening | Rising | Buy | Medium |
| MFI | Declining (caution) | Mixed | Neutral | Low |
| VWAP | At price | At price | Neutral | Medium |
| SMA20 | At price | Below price | Buy | Medium |
| Bollinger Bands | Expanding | Expanding | Buy | Medium |
| Volume | Confirming | Above average | Buy | High |
| Pattern | Rising Three Methods | Bullish channel | Buy | High |
| Support/Resistance | Above key levels | Above $5,100 | Buy | High |
| OVERALL | BUY | BUY | BUY | HIGH CONFIDENCE |
Trading Strategies for February 25, 2026
Strategy 1: Momentum Continuation Swing Trade
Profile: For traders with 3-7 day holding period
Setup:
- Entry Method: Two approaches
- Approach A: Buy on breakout above $5,200 with volume
- Approach B: Wait for pullback to $5,150-$5,165 (better R:R)
- Position Size: 2% account risk
- Entry Zones:
- Aggressive: $5,200-$5,210 (breakout)
- Conservative: $5,150-$5,165 (pullback)
- Targets:
- Target 1: $5,257 (Take 30% profit, move stop to BE)
- Target 2: $5,326 (Take 40% profit)
- Target 3: $5,400+ (Trail remaining 30%)
- Stop Loss:
- For breakout entry: $5,135
- For pullback entry: $5,120
- Risk-Reward: Minimum 3:1
Management:
- If entered on breakout and price pulls back to $5,150 without stopping out, consider adding to position
- Trail stop using H1 swing lows once $5,257 reached
- Take profits if bearish engulfing forms on H4 or Daily chart
Strategy 2: Scalping the Consolidation
Profile: For active M15/M5 traders
Setup:
- Premise: Price will consolidate in $5,170-$5,200 before next move
- Buy Zone: $5,172-$5,180 (at support)
- Sell Zone: $5,195-$5,202 (at resistance)
- Position Size: 1% risk per trade
- Targets: 15-25 pip moves
- Stops: 12-18 pips (tight)
- Max Trades: 4-6 per session
- Rules:
- Exit ALL positions if range breaks (close outside $5,170-$5,200 on M15)
- Don't trade first 30 min after major news
- Stop trading after 3 consecutive losses
Strategy 3: Breakout Retest Strategy
Profile: For disciplined traders waiting for optimal entry
Setup:
- Entry Criteria:
- Price breaks above $5,200 on H1 close
- Initial momentum carries to $5,220-$5,240
- Price pulls back to retest $5,200-$5,210 area
- Bullish reversal pattern forms on M15 or H1
- Entry: $5,202-$5,215 (on confirmed retest hold)
- Position Size: 1.5-2% risk
- Targets:
- Target 1: $5,257 (40% profit take)
- Target 2: $5,290 (35% profit take)
- Target 3: $5,350+ (trail 25%)
- Stop Loss: $5,175 (below retest zone)
- Risk-Reward: 3:1 to 5:1
Advantages:
- Better risk-reward than chasing breakout
- Confirmation that breakout is real, not false
- Clear invalidation level
- Lower risk of being trapped
Strategy 4: Conservative Long-Term Position
Profile: For investors with multi-week/month horizon
Setup:
- Philosophy: Ride the major uptrend, minimize trading
- Entry: Build position in 3 tranches
- 33% now at $5,190
- 33% on pullback to $5,100-$5,120
- 34% on deeper dip to $5,000-$5,050 (if occurs)
- Position Size: 3-5% total portfolio allocation
- Targets:
- Target 1: $5,595 (retest ATH - sell 25%)
- Target 2: $6,000-$6,300 (analyst targets - sell 35%)
- Target 3: Hold remaining 40% for long term
- Stop Loss: Daily close below $4,950 (only for entire position)
- Time Horizon: 3-6 months
Management:
- Don't obsess over daily movements
- Add on any panic dips to $5,000 level
- Reduce 25% if price gets parabolic above $5,800
- Rebalance if gold position exceeds 10% of portfolio
Market Outlook: Short, Medium, and Long Term
Short-Term (This Week): Consolidation Then Continuation
Base Case (60% probability): Gold consolidates between $5,150-$5,230 for remainder of week. Volatility persisted amid the FOMC minutes, and this week's GDP/PCE data will likely cause similar choppiness. After digesting recent gains, breakout above $5,230 likely by week's end.
Bullish Case (25% probability): Weak GDP or dovish Fed commentary triggers immediate breakout. Gold surges to $5,290-$5,326 by Friday. Requires:
- GDP miss or downward revision
- PCE inflation data showing meaningful cooling
- Geopolitical escalation (Iran situation)
- Dollar weakness
Bearish Case (15% probability): Strong data or hawkish Fed speak causes pullback to $5,100-$5,120. This would be healthy correction offering better entry. Requires:
- Stronger than expected GDP
- Stubborn inflation (high PCE)
- Risk-on rally in equities
- Dollar surge
Trading Implication: Bias toward bullish continuation, but expect volatility around data releases. Use dips to $5,150 as buying opportunities.
Medium-Term (March-April 2026): Testing All-Time Highs
Analysts predict gold could reach between $5,400 and $6,300 by the end of 2026, driven by sustained demand and geopolitical risks.
For the next 6-8 weeks, the technical and fundamental setup suggests:
Expected Path:
- Late February: Consolidate $5,150-$5,300
- Early March: Break toward $5,400-$5,500
- Mid-March: Test/break ATH at $5,595
- Late March/April: Either:
- Pull back to $5,200-$5,400 to build base OR
- Accelerate to $5,800-$6,000 if breaks ATH cleanly
Key Levels:
- Next Targets: With $5,107 under their belt, investors will be looking to take the price up to $5,257 and $5,290 in the coming days
- Resistance: $5,326, $5,400, $5,595 (ATH), $6,000
- Support: $5,100, $5,000, $4,816
Critical Factors:
- Fed policy signals (March FOMC meeting)
- Geopolitical developments
- Central bank buying pace
- Dollar trajectory
- Real yields behavior
Long-Term (Full Year 2026): New All-Time Highs Expected
The long-term outlook remains overwhelmingly bullish. The outlook for the XAUUSD pair's performance in 2026 is optimistic. The price is expected to range between $5,591.00 and $10,833.00 by the end of the year.
Year-End 2026 Forecasts:
- Conservative: $5,900-$6,500
- Base Case: $6,500-$7,500
- Bullish: $8,000-$10,000
- Aggressive: $10,000-$10,833
Quarterly Projections:
- Q1 2026 (Current): $5,000-$5,600
- Q2 2026: $5,400-$6,200
- Q3 2026: $5,800-$7,000
- Q4 2026: $6,500-$8,500
Multi-Year Outlook: Forecasts for 2027 are also positive. According to analysts, gold prices may vary from $6,219.00 to $13,222.00 depending on market conditions. The precious metal is projected to maintain its upward momentum in 2028–2030, fluctuating between $6,846.00 and $14,896.00.
Structural Bull Market Drivers:
- Central Bank Accumulation: De-dollarization trend multi-year
- Geopolitical Instability: No signs of major conflicts resolving
- Fiscal Concerns: Global debt levels unsustainable
- Monetary Policy: Eventually Fed will cut, boosting gold
- Inflation Hedge: Persistent inflation supporting real assets
- Technical: Long-term uptrend firmly intact
Potential Risks to Bull Case:
- Fed Stays Hawkish: Higher rates for much longer than expected
- Dollar Strength: Strong USD from rate differentials
- Peace Dividends: Major geopolitical de-escalation
- Growth Surprise: Unexpectedly strong global growth
- Technical Break: Loss of $4,800-$5,000 support zone
Most Likely Path: Gold continues grinding higher throughout 2026 with periodic 5-10% corrections. The path won't be linear - expect volatility. But the combination of central bank demand, geopolitical uncertainty, and eventual Fed pivot should drive gold to $7,000-$8,000 by year-end.
Advanced Technical Analysis
Elliott Wave Count
From the $2,832 low to $5,595 high appears to be a five-wave impulse:
- Wave 1: $2,832 → $3,800
- Wave 2: $3,800 → $3,400
- Wave 3: $3,400 → $5,200 (extended)
- Wave 4: $5,200 → $4,850
- Wave 5: $4,850 → $5,595
Current Correction from $5,595: Could be labeled as:
- Wave A: $5,595 → $4,860 (completed)
- Wave B: $4,860 → $5,300? (in progress) ← WE ARE HERE
- Wave C: $5,300 → $5,000? (or already done if simpler zigzag)
Alternative Count: The dip to $4,860 completed the entire correction (simple zigzag), and we're now in a new impulsive wave sequence toward $6,000+. The breakout above $5,100 and strong momentum support this interpretation.
Fibonacci Analysis
From ATH ($5,595) to Low ($4,860):
- 23.6% Retrace: $5,033 ✓ (exceeded)
- 38.2% Retrace: $5,140 ✓ (exceeded)
- 50.0% Retrace: $5,227 ← Testing now
- 61.8% Retrace: $5,314
- 78.6% Retrace: $5,437
Current Price Action: Gold at $5,191 is approaching the 50% retracement at $5,227. This is a critical Fibonacci level where:
- Success: Break above signals correction complete, target 61.8% and higher
- Failure: Rejection could send price back to test $5,100-$5,140
Extension Targets (if correction complete):
- 127.2% Extension: $5,850
- 161.8% Extension: $6,100
- 200% Extension: $6,330
Volume Profile Analysis
Point of Control (POC): The highest volume node since January ATH sits around $5,050-$5,100, which explains why this zone acted as such strong resistance and now should provide support.
Value Area:
- Upper: $5,200-$5,250
- Middle: $5,050-$5,150
- Lower: $4,950-$5,000
Current price trading at upper value area suggests either:
- New value area forming higher (bullish)
- Price extended from fair value (pullback due)
Sentiment and Positioning
COT Report Implications:
- Commercial hedgers have likely covered shorts during the dip to $4,860
- Large speculators probably added longs on the breakout
- Small speculators (retail) likely chasing here - contrarian bearish
Sentiment Indicators:
- Put/Call Ratios: Likely shifted more bullish
- ETF Flows: Inflows accelerating
- Social Sentiment: Bullish fervor increasing (watch for extreme optimism)
Contrarian Perspective: When "everyone" is bullish, corrections become more likely. Current enthusiasm is high but not yet at euphoric extremes. Watch for:
- Mainstream media headlines about gold
- Retail FOMO (fear of missing out)
- Excessive bullish positioning
These would signal caution, but we're not there yet.
Risk Factors and Black Swans
Known Risks
- Fed Policy Surprise: Unexpected rate hike if inflation spikes
- Dollar Surge: Safe-haven flows to USD on global crisis
- Equity Crash: Forced liquidation of gold to cover margin calls
- China Slowdown: PBOC stops buying, other central banks follow
- Technical Break: Loss of $5,000 level could trigger cascade
Potential Black Swans
- Peace Breakthrough: Major Israel-Gaza or Russia-Ukraine peace deal
- Fed U-Turn: Emergency rate cuts on financial crisis
- Gold-Backed Currency: Major nation announces gold-backed money
- Mining Discovery: Massive new gold deposit found
- Crypto Integration: Central banks shifting to crypto reserves
Hedging Strategies
For Long Positions:
- Buy protective puts if holding large position
- Use stop-losses religiously
- Diversify across multiple uncorrelated assets
- Consider selling covered calls to generate income
For Portfolio Risk:
- Gold should be 5-10% of portfolio maximum for most investors
- Rebalance if position grows above allocation
- Consider gold miners (GDX) for leveraged exposure
- Physical gold ownership for true safe-haven protection
Final Thoughts and Key Takeaways
Gold stands at a pivotal moment on February 25, 2026. Trading at $5,191 and up 75% year-over-year, the precious metal has demonstrated remarkable strength despite periodic volatility.
Critical Conclusions:
-
Bullish Breakout Confirmed: The break above $5,100-$5,107 resistance is technically significant and validates the continuation of the long-term uptrend.
-
Multiple Timeframe Alignment: H1 and M15 charts both show bullish structure, with higher highs and higher lows intact across timeframes.
-
Strong Fundamentals: Geopolitical tensions, central bank demand, and Fed policy expectations all support higher gold prices.
-
Near-Term Caution Warranted: Overbought indicators (RSI 65, declining MACD momentum) suggest consolidation or minor pullback possible before next leg higher.
-
$5,200 Psychological Resistance: This round number represents immediate hurdle. Break above likely triggers acceleration to $5,257-$5,290.
-
$5,100 Critical Support: This former resistance must hold to maintain bullish structure. Loss would target $5,000.
-
Long-Term Target: $6,000-$7,000+: Analysts consensus and technical projections point to significantly higher prices by year-end 2026.
-
Risk Management Essential: Despite bullish outlook, always use stops and position sizing. Volatility will remain elevated.
Trading Wisdom for Current Market
Do:
- Buy pullbacks to $5,150-$5,170 support zones
- Use disciplined stop-losses below $5,100-$5,135
- Take partial profits at resistance levels ($5,257, $5,290, $5,326)
- Scale into positions rather than going all-in
- Follow the trend - don't fight it
Don't:
- Chase price above $5,220 without pullback
- Ignore overbought indicators completely
- Overlever age in this volatile environment
- Fight the trend with stubborn shorts
- Ignore major news events (GDP, PCE this week)
Price Predictions
24-48 Hour Outlook:
- Bullish Above: $5,180
- Bearish Below: $5,150
- Expected Range: $5,155-$5,225
- Most Likely: Consolidation then break higher to $5,210-$5,230
This Week:
- Bull Scenario (60%): $5,230-$5,290
- Neutral Scenario (25%): $5,150-$5,220 (consolidation)
- Bear Scenario (15%): $5,100-$5,170 (healthy pullback)
This Month (February Close):
- Optimistic: $5,300-$5,400
- Base Case: $5,250-$5,350
- Conservative: $5,150-$5,250
Closing Thought
Put the 'digital gold' vs 'physical gold' debate to bed because right now the yellow metal is very much in charge. With 75% gains over the past year, gold has proven itself as the ultimate safe-haven asset in uncertain times.
The technical setup is bullish, fundamentals are supportive, and momentum remains strong. While near-term consolidation is likely and healthy, the path of least resistance is higher. The breakout above $5,100 was the signal many technical traders were waiting for - the bulls are in control.
For traders and investors alike, the message is clear: respect the trend, manage risk, and let the market reward your discipline. The gold bull market is alive and well, and those who trade it with proper risk management should find ample opportunities in the months ahead.
Disclaimer: This analysis is for educational and informational purposes only and does not constitute financial advice. Trading gold and other financial instruments involves substantial risk of loss. Past performance is not indicative of future results. Always conduct your own research, understand the risks involved, and consider consulting with a licensed financial advisor before making investment decisions. Never risk more than you can afford to lose.
Published: February 25, 2026
Timeframes Analyzed: H1 (1-Hour), M15 (15-Minute)
Asset: XAUUSD (Gold Spot vs US Dollar)
Current Price: $5,191.49
Analysis Type: Comprehensive Technical Analysis with Fundamental Context


 Terminals on One Windows PC (Complete Beginner Guide)")