
Mastering XAUUSD Daily: What Smart Traders Are Watching Today, January 26,2026

Rules protect traders from themselves
We'll examine what the chart actually conveys today, including where buyers and sellers are active, which levels are crucial, and how momentum is shifting in real time.
Before we begin, I would like to share with you the best ways to use MQL4 and MQL5 to transform your trading strategies into extremely profitable machines. In order to teach traders how to construct MT4 and MT5 trading algorithms from the bottom up, I have created basic instructions.
📘LEARN HOW TO DEVELOP THE PERFECT TRADING ALGORITHM FOR MT4
📘LEARN HOW TO DEVELOP THE PERFECT TRADING ALGORITHM FOR MT5
A powerful system/ trader assistant tool designed to enhance analysis, improve timing, and give traders a structured approach to market execution.
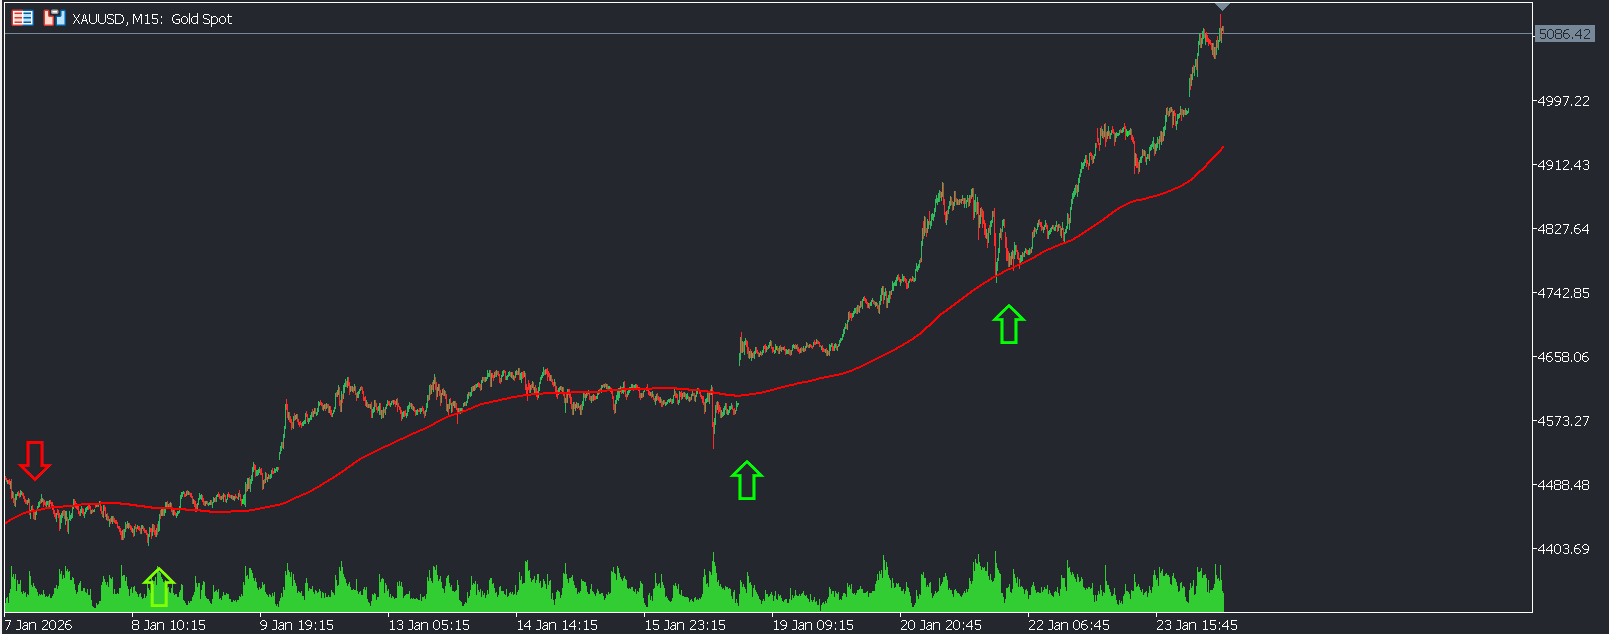
📊 XAU/USD Technical Analysis – 26 January 2026 Intraday structure tightens as gold prepares for its next directional move (H1 & M15)
As we move into 26 January 2026, XAU/USD continues to trade in a technically rich environment, where intraday structure and liquidity behavior are offering clearer signals than higher timeframes. Following the volatility expansion seen earlier in January, gold is now transitioning into a controlled consolidation, creating tactical opportunities for disciplined H1 and M15 traders.
This analysis focuses on how price is behaving, where buyers and sellers are active, and how traders can align execution with structure rather than prediction.
📈 Market Context – H1 Timeframe
On the H1 chart, gold maintains a constructive bullish structure, with price still respecting prior higher lows. However, momentum has slowed, and the market is currently rotating within a defined intraday range.
This behavior suggests that the market is:
-
digesting the previous impulse
-
reallocating liquidity
-
preparing for either continuation or a deeper corrective leg
Importantly, no structural breakdown has occurred on H1, which keeps the broader bias bullish-neutral rather than bearish.
👉 H1 bias: Bullish structure, short-term consolidation
📌 Key H1 Technical Levels
🟢 Support Zones
-
Immediate intraday support: short-term demand and reaction zone
-
H1 higher-low support: key structure level holding bullish bias
-
Range support: breakdown here would signal a corrective extension
🔴 Resistance Zones
-
Intraday supply: recent rejection area
-
Range high: ceiling of consolidation
-
Bullish continuation level: confirmed break opens upside expansion
Price is currently rotating between these zones, signaling balance rather than dominance.
⏱️ Intraday Execution – M15 Timeframe
The M15 chart reveals the internal mechanics of the consolidation. Price action is characterized by:
-
frequent short-term highs and lows
-
reduced candle follow-through
-
liquidity sweeps around obvious levels
This is a classic environment where patience and confirmation outperform aggression.
High-probability setups on M15 are emerging from:
-
clear rejection at H1 levels
-
break-and-retest structures
-
continuation patterns aligned with the H1 bias
👉 M15 bias: Range-bound with directional potential on breakout
📊 Indicator Alignment
-
Moving Averages: Still respected on both H1 and M15, reinforcing trend integrity
-
RSI: Hovering near equilibrium, confirming consolidation
-
Momentum: Contracting, often a precursor to expansion
Indicators support what price is already showing: compression, not weakness.
🔍 Technical Scenarios for 26 January 2026
📈 Bullish Continuation Scenario
-
Condition: H1 close above range high with M15 acceptance
-
Targets: Previous highs → measured expansion levels
-
Logic: Trend continuation as buyers regain control
📉 Corrective Scenario
-
Condition: Loss of H1 higher-low support
-
Targets: Lower demand zones
-
Logic: Deeper pullback within a broader bullish structure
🔄 Intraday Range Scenario (Highly Probable)
-
Buy setups: Near H1 support with M15 confirmation
-
Sell setups: Near H1 resistance with rejection
-
Logic: Mean-reversion trades while structure holds
🧠 Price Action Insight & Risk Management
Given the current market phase:
-
avoid chasing breakouts without confirmation
-
reduce position size during consolidation
-
let H1 define direction and M15 define execution
In compressed conditions, risk control is a strategy, not a constraint.
🏁 Conclusion
For 26 January 2026, XAU/USD remains structurally healthy, but temporarily balanced. The market is clearly communicating patience: it is not yet time for impulsive positioning, but rather for precise execution around key levels.
👉 A decisive move is likely once price exits the current H1 range with conviction. Until then, traders who respect structure and price action will maintain the edge.


")