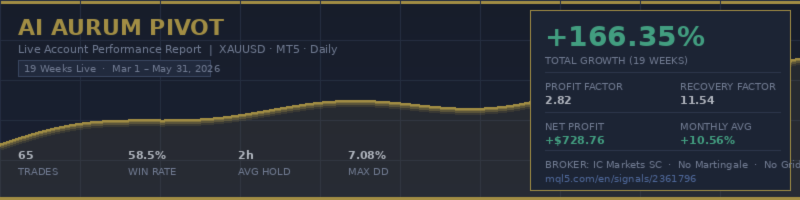

📅 May 31, 2026 | XAUUSD (Gold) | MetaTrader 5 | Live Account Report — 19 Weeks
AI Aurum Pivot — 19-Week Live Account Analysis (March–May 2026)
AI Aurum Pivot | XAUUSD Dedicated | MetaTrader 5 | Daily Timeframe | No Martingale · No Grid · Hard SL Every Trade
This post documents the performance of the AI Aurum Pivot live signal account from its launch on March 1, 2026 through the end of May 2026 — a total of 19 weeks of continuous operation on a real IC Markets SC account. All figures are sourced directly from the publicly audited MQL5 signal page and are independently verifiable by anyone.
👉 Live Signal: https://www.mql5.com/en/signals/2361796
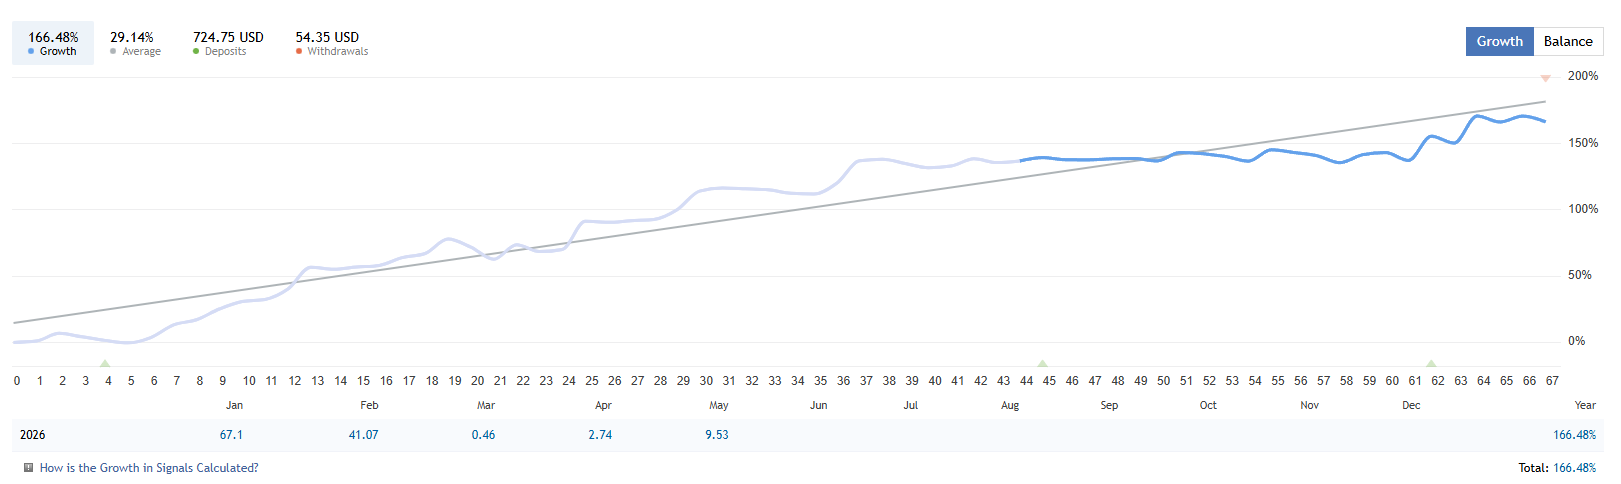
The equity curve over 19 weeks shows a consistent upward trajectory from the $300 starting deposit to over $1,750. No major equity crashes or deep drawdown periods are visible. The curve is characterized by steady compounding with gradual pullbacks that recover quickly — a profile consistent with a disciplined single-trade-at-a-time system with hard stop losses on every position.
■ Summary Statistics — 19 Weeks Live (Mar 1 – May 31, 2026)
| Metric | Value |
|---|---|
| Total Growth | +166.35% |
| Net Profit | +728.76 USD |
| Starting Deposit | 300.00 USD |
| Current Balance | 1,753.51 USD |
| Total Trades | 65 trades |
| Profitable Trades | 38 (58.46%) |
| Loss Trades | 27 (41.54%) |
| Gross Profit | 1,128.43 USD (89,924 pips) |
| Gross Loss | -399.67 USD (30,204 pips) |
| Profit Factor | 2.82 |
| Average Profit per Win | +29.70 USD |
| Average Loss per Loss | -14.80 USD |
| Win/Loss Ratio (Avg) | 2.01 : 1 |
| Best Single Trade | +134.52 USD |
| Worst Single Trade | -38.84 USD |
| Max Consecutive Wins | 8 trades (+227.04 USD) |
| Max Consecutive Losses | 3 trades (-18.52 USD total) |
| Max Balance Drawdown | 63.17 USD (7.08%) |
| Max Equity Drawdown | 2.32% (35.86 USD) |
| Recovery Factor | 11.54 |
| Sharpe Ratio | 0.41 |
| Monthly Growth Rate | +10.56% / month |
| Annual Forecast (extrapolated) | +128.13% |
| Avg Holding Time | 2 hours |
| Max Deposit Load | 3.32% |
| Algorithmic Trades | 84% |
| Long / Short Split | 52.31% Long / 47.69% Short |
| Symbol | XAUUSD only |
| Broker | IC Markets SC — MT5 |
| Leverage | 1:500 |
| Account Started | March 1, 2026 |
■ Trade Quality Analysis
The system recorded 65 trades over 19 weeks — an average of roughly 3–4 trades per week. This is consistent with a strategy that prioritizes setup quality over frequency. The EA description confirms this is by design: the internal AI filter evaluates market structure before approving entries, and low-quality breakout conditions are skipped entirely.
The win rate of 58.46% is moderate by typical EA standards, but the key metric here is the relationship between average win and average loss. Average winning trades (+$29.70) are exactly twice the size of average losing trades (-$14.80), producing a realized risk-to-reward ratio of approximately 2:1. This is what generates a profit factor of 2.82 — meaning the system earns $2.82 in gross profit for every $1 of gross loss absorbed.
The extreme ends of the trade distribution are also informative. The best single trade captured +$134.52 while the worst single loss was contained to -$38.84. The maximum consecutive losing run produced only -$18.52 in total damage across 3 trades — a figure that is negligible relative to the overall account equity at that point in the run. Meanwhile, the best consecutive winning streak of 8 trades generated +$227.04. This asymmetry — small clustered losses versus large clustered wins — is a structural characteristic of trend-following breakout systems when their quality filters are functioning correctly.
■ Drawdown and Risk Profile
Maximum balance drawdown over the full 19-week period was $63.17 (7.08%). Maximum equity drawdown was significantly lower at 2.32% ($35.86) — indicating that the system rarely holds losing positions deep into negative territory before exiting. The hard stop loss on every trade limits open-position exposure before it compounds into account-level damage.
The recovery factor of 11.54 is a meaningful metric in this context. It represents the ratio of total net profit to maximum drawdown — essentially measuring how efficiently the system recovers from its worst period. A recovery factor above 3.0 is generally considered solid; 11.54 indicates that the system generates approximately 11.5 times its maximum drawdown in net profit over the measured period. This is a strong result, though it should be noted that 19 weeks is a relatively short live period and future drawdown conditions may differ.
Maximum deposit load peaked at 3.32%, meaning the system never committed more than a small fraction of account capital to open exposure at any single moment. This is consistent with a single-trade-at-a-time approach and conservative lot sizing relative to account balance.
■ Observations on Trading Activity
The signal log shows several periods of reduced or paused trading activity, particularly in mid-March and late April. These gaps are consistent with the EA's stated design philosophy — the AI filter skips setups that do not meet quality thresholds, and some market environments simply produce no qualifying entries for extended periods.
A notable operational change was recorded on March 9, 2026: the default timeframe setting was updated from H2 to Daily. This reflects active ongoing development and adaptation to live market conditions. All performance statistics above reflect the combined period under both settings.
The long/short distribution (52.31% long vs 47.69% short) indicates the system does not carry a systematic directional bias over this period. It trades both directions on XAUUSD with near-equal frequency, which reduces exposure to single-direction macro risk.
■ Context and Caveats
19 weeks is a meaningful live sample — long enough to observe system behavior through multiple market conditions — but not long enough to draw definitive conclusions about long-term robustness. Gold markets during March–May 2026 had their own specific volatility characteristics, and performance may vary under different macro conditions (rate decision cycles, geopolitical regimes, risk-off periods).
The Sharpe Ratio of 0.41 is below the conventional 1.0 threshold typically associated with strong risk-adjusted returns. This is common for breakout-style trading systems and reflects the inherent variability of infrequent, high-reward trades rather than consistent small gains. Traders evaluating this metric should weight it accordingly.
Slippage data from the signal page shows variation across brokers — from near-zero on RoboForex and Exness to 26+ pips on some Exness MT5 real accounts. Traders considering this EA should account for their specific broker's execution environment when evaluating expected performance replication.
■ Conclusion
Over 19 weeks of live operation on a real IC Markets account, AI Aurum Pivot has produced a verified +166.35% return with a 7.08% maximum drawdown, a profit factor of 2.82, and a recovery factor of 11.54. Trade frequency is selective (65 trades over 19 weeks), the win/loss dollar ratio is approximately 2:1, and the maximum consecutive loss sequence produced minimal account impact.
The results reflect a system operating within its stated design parameters: confirmed pivot breakout entries on XAUUSD, AI-filtered setup quality, hard stop losses on every trade, and no martingale or grid logic. Whether this performance is representative of the system's long-term behavior requires continued forward observation — but the 19-week record is a transparent and verifiable starting point for any trader conducting due diligence.
Full trade history and live statistics are publicly accessible on MQL5:
👉 https://www.mql5.com/en/signals/2361796
EA product page:
👉 https://www.mql5.com/en/market/product/161326
⚠ Past performance on a live signal account is not a guarantee of future results. All figures in this report are sourced from the publicly available MQL5 signal page and are accurate as of May 31, 2026. Trading involves significant risk of loss. Always apply proper risk management.